
ABSTRACT
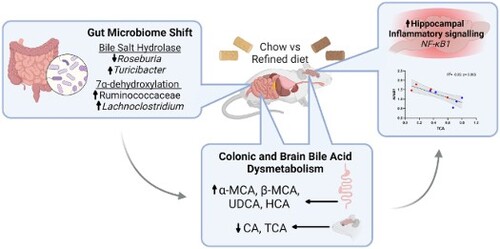
Over recent decades, dietary patterns have changed significantly due to the increasing availability of convenient, ultra-processed refined foods. Refined foods are commonly depleted of key bioactive compounds, which have been associated with several deleterious health conditions. As the gut microbiome can influence the brain through a bidirectional communication system known as the ‘microbiota-gut-brain axis’, the consumption of refined foods has the potential to affect cognitive health. In this study, multi-omics approaches were employed to assess the effect of a refined diet on the microbiota-gut-brain axis, with a particular focus on bile acid metabolism. Mice maintained on a refined low-fat diet (rLFD), consisting of high sucrose, processed carbohydrates and low fibre content, for eight weeks displayed significant gut microbial dysbiosis, as indicated by diminished alpha diversity metrics (p < 0.05) and altered beta diversity (p < 0.05) when compared to mice receiving a chow diet. Changes in gut microbiota composition paralleled modulation of the metabolome, including a significant reduction in short-chain fatty acids (acetate, propionate and n-butyrate; p < 0.001) and alterations in bile acid concentrations. Interestingly, the rLFD led to dysregulated bile acid concentrations across both the colon (p < 0.05) and the brain (p < 0.05) which coincided with altered neuroinflammatory gene expression. In particular, the concentration of TCA, TDCA and T-α-MCA was inversely correlated with the expression of NF-κB1, a key transcription factor in neuroinflammation. Overall, our results suggest a novel link between a refined low-fat diet and detrimental neuronal processes, likely in part through modulation of the microbiota-gut-brain axis and bile acid dysmetabolism.
GRAPHICAL ABSTRACT
1. Introduction
Modern society is experiencing a shift in dietary patterns in which the consumption of convenient, ultra-processed refined foods has increased dramatically. These calorie-dense foods are typically stripped of nutritional components, including dietary fibre, instead containing refined carbohydrates and fructose, starch and sucrose. Consequently, refined diets have been associated with deleterious health problems, including effects on brain health. Indeed, in mice, the long-term consumption of a refined diet leads to cognitive impairment relating to hippocampal synaptic loss mediated through gut microbial metabolites [Citation1]. Similarly, anxiety-related [Citation2] and compulsive-like behaviour have also been reported in response to a refined diet, resulting from metabolite-mediated neuroinflammation and nitric oxide activation, respectively [Citation3].
One proposed mechanism linking dietary intake to the brain is through modulation of a ‘microbiota-gut-brain’ axis, a bidirectional signalling pathway connecting the gut and the brain that is modulated by the gut microbiome. Recent pre-clinical and clinical evidence has revealed the significance of diet on gut microbiota composition, which subsequently alters numerous microbial-derived metabolite, neuroendocrine, autonomic and neuroimmune pathways, which can both directly and indirectly influence brain function [Citation4, Citation5]. However, despite evidence that a refined diet can modulate gut microbiota composition [Citation5], the specific effects of a refined diet on the microbiota-gut-brain axis remain unknown.
Bile acids (BAs), which are produced by hepatic and bacterial enzymes from cholesterol to assist in digestion and regulate inflammatory signalling, form a key communication system along the microbiota-gut-brain axis and are one of the top microbial-derived metabolites associated with cognitive health [Citation6]. Primary BAs are produced from cholesterol in the liver, of which most (∼95%) are secreted into the intestine by the gallbladder and are actively reabsorbed in the ileum via enterohepatic circulation. The remaining 5% are converted by gut microbial action to form secondary BAs in the colon and therefore their production is strongly associated with multiple bacterial species [Citation7]. The gut microbiome performs two essential roles in BA synthesis. Firstly, conjugated primary BAs reach the gut, and microbiota with bile salt hydrolase (BSH) activity deconjugate glycine or taurine residuals [Citation8]. Following this, selected members of the gut microbiota with 7α-dehydroxylase activity convert these primary BAs to secondary BAs. BAs also regulate the gut microbiota due to their antimicrobial properties creating strong selectional forces [Citation9]. More recently, over 20 conjugated and unconjugated BAs and their receptors have been found in both human and rodent brains, suggesting BAs can not only cross the blood–brain barrier (BBB) but also bind to nuclear receptors and initiate physiological responses [Citation10, Citation11]. Therefore, the composition of the brain BA pool is regulated by the action of the gut microbiota, with BAs forming part of a complex communication system between the gut and the brain. As such, cognition may be influenced by the dysregulation of BA synthesis and metabolism. Indeed, BA profiles are reportedly altered in cases of mild cognitive impairment and Alzheimer’s disease, suggesting a role of the gut microbiome in disease progression [Citation12].
Here, we investigate the impact of a refined low-fat diet on the microbiota-gut-brain axis. In particular, we explore changes in gut microbiota and metabolome profiles, including changes in BA profiles in the periphery and brain. Further, we provide a novel link between changes in neuronal BAs and detrimental neuronal signalling, suggesting a novel pathway between refined dietary intake and brain health.
2. Materials and methods
2.1. Study approval
All experimental procedures and protocols used in this study were reviewed and approved by the Animal Welfare and Ethical Review Body (AWERB) and were conducted within the provisions of the Animals (Scientific Procedures) Act 1986 (Amendment Regulations 2012). Animal ethics approval reference PPL 70/8710 (3rd May 2016). Reporting of the study outcomes complies with the ARRIVE (Animal Research: Reporting of In Vivo Experiments) guidelines [Citation13].
2.2. Animals and experimental designs
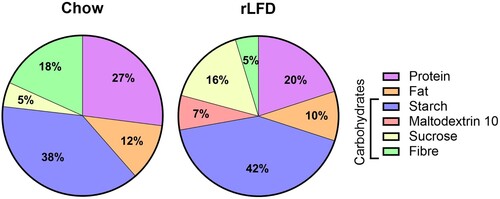
Ten 10-week-old male wild-type C57BL/6J were sourced from the Disease Modelling Unit (DMU) at the University of East Anglia. Mice were maintained in individually ventilated cages (n = 5 per cage) within a controlled environment (21 ± 2°C; 12-h light–dark cycle; light from 07:00 h) for the duration of the experiments. After feeding a standard chow diet (RM3; Special Diet Services, Essex, UK) for two weeks, mice were assigned to either the RM3 diet or to a 10 kCal% low-fat diet (rLFD; Research Diet Inc., New Brunswick, USA) for another 8-weeks (; Supplementary Table S1). This is in line with previous studies [Citation9], allowing sufficient time for the modulation of the gut microbiome and bile acid metabolism. Following this, mice were sedated with 4% isoflurane (IsoFlo®, Abbott, ND) in a mixture of nitrous oxide (70%) and oxygen (30%) and blood samples were collected by cardiac puncture into SST microtubes (Sarstedt, Leicester, UK) followed by trans-cardiac perfusion of ice-cold 0.9% NaCl solution containing heparin (10 units/ml; Sigma-Aldrich, Dorset, UK). Serum samples were isolated by centrifugation at 2,000 × g for 10 min. Organs were rapidly removed, rinsed with ice-cold NaCl (150 mmol/L), snap-frozen and stored at −80°C until further analysis.
Figure 1. Composition of chow and rLFD.
2.3. Microbial 16S rRNA extraction and amplicon sequencing
Microbial DNA was isolated from approximately 50 mg of colon content using a FastDNA SPIN Kit for Soil (MP Biomedicals). Samples were quantified using a nanodrop (ND-1000 spectrophotometer) and quality assessment was performed by agarose gel electrophoresis to detect DNA integrity, purity, fragment size and concentration. 16S rRNA amplicon sequencing of the V3-V4 hypervariable region was performed with an Illumina MiSeq platform. Sequence analysis was performed by Uparse software (Uparse v7.0.1001), using all the effective tags. Sequences with ≥97% similarity were assigned to the same operational taxonomic units (OTUs). A representative sequence for each OTU was screened for further annotation. For each representative sequence, Mothur software was performed against the SSUrRNA database of SILVA Database 138. OTUs abundance information was normalised using a standard of sequence number corresponding to the sample with the least sequences. Alpha-diversity was assessed using Chao1, Simpson, observed species and Shannon H diversity index whilst beta diversity was assessed using Bray–Curtis. Statistical significance was determined by Wilcoxon rank-sum test (Mann–Whitney-U) or analysis of similarities (ANOSIM).
2.4. 1H NMR metabolomics
20 mg of colonic faecal material was added to 1 mL of saline phosphate buffer (1.9 mM Na2HPO4, 8.1 mM NaH2PO4, 150 mM NaCl, and 1 mM TSP (sodium 3-(trimethylsilyl)-propionate-d4)) in D2O (deuterium oxide), followed by centrifugation (18,000 g, 1 min). Supernatants were removed, filtered through 0.2 μM membrane filters, and stored at −20°C until required.
High-resolution 1H NMR spectra were recorded on a 600 MHz Bruker Avance spectrometer fitted with a 5 mm TCI cryoprobe and a 60-slot autosampler (Bruker, Rheinstetten, Germany). Sample temperature was controlled at 300 K. Each spectrum consisted of 128 scans of 32,768 complex data points with a spectral width of 14 ppm (acquisition time 1.95 s). The noesypr1d pre-saturation sequence was used to suppress the residual water signal with low-power selective irradiation at the water frequency during the recycle delay (D1 = 2 s) and mixing time (D8 = 0.15 s). A 90° pulse length of 8.8 μs was set for all samples. Spectra were transformed with a 0.3 Hz line broadening and zero filling, manually phased, baseline corrected, and referenced by setting the TSP methyl signal to 0 ppm. Metabolites were identified using the Human Metabolome Database (http://www.hmdb.ca/) and by use of the 2D-NMR methods, COSY, HSQC, and HMBC [Citation14] and quantified using the software Chenomx® NMR Suite 8.6TM.
2.5. Bile acid metabolism
Colon content and brain samples (50 mg) were homogenised in 1 ml of 70% v/v methanol containing 25 µl of 40 µg/ml d4-DCA (Sigma-Aldrich, USA; Cat# 614130) for 30 s at 6,000 rpm on a Precellys homogeniser (Bertin Technologies, UK). The slurry was then centrifuged at 3,000 rpm at 4°C and the supernatant was transferred to a new tube with the addition of 25 µl of 40 µg/ml d4-CDCA (Sigma-Aldrich, USA; Cat# C-147). This was evaporated by centrifugal evaporation at 50°C for 70 min to almost dryness using a SpeedVacTM concentrator and then made to 1 ml volume with 5% v/v methanol and the addition of 25 µl of 40 µg/ml d4-CA (Sigma-Aldrich, USA# Cat: 614149). The reconstituted sample was passed through a hydrophilic-lipophilic balance clean-up cartridge (Waters Oasis Prime HLB, 1cc, 30 mg), washed with 1 ml of 5% methanol and eluted in 500 µl methanol and addition of 25 µl of 40 µg/ml d4-GCA (Sigma-Aldrich, USA; Cat# 330277P) and d4-LCA (Sigma-Aldrich, USA; Cat# 589349). Samples were analysed using an Agilent 1260 binary HPLC coupled to an AB Sciex 4000 QTrap triple quadrupole mass spectrometer. HPLC was carried out using a binary gradient of solvent A (Water + 5 mM Ammonium Acetate + 0.012% Formic acid) and solvent B (Methanol + 5 mM Ammonium Acetate + 0.012% Formic acid) at a constant flow rate of 600 µl/min. Separation was achieved using a Supelco Ascentis Express C18 150 × 4.6, 2.7 µm column maintained at 40°C. The mass spectrometer was operated in electrospray negative mode with a capillary voltage of −4500 V at 550°C. Instrument-specific gas flow rates were 25 ml/min curtain gas, GS1: 40 ml/min and GS2: 50 ml/min. Mass fragmentation was monitored in MRM mode. Quantification was applied using Analyst 1.6.2 software to integrate detected peak areas relative to the deuterated internal standards.
2.6. RNA isolation and qRT-PCR
RNA isolation, cDNA synthesis and qRT-PCR were carried out as previously described [Citation15]. Briefly, total RNA was isolated from both the cortex and hippocampus using the Qiazol reagent (Qiagen, UK). The hippocampus was investigated as it plays pivotal roles in learning and memory and is affected by a variety of neurological and psychiatric disorders [Citation16]. The cortex was also analysed as it is involved in numerous higher brain processes, including memory, thinking, learning, reasoning, the senses, and emotions [Citation17]. Two μg of total RNA was treated with DNase I (Invitrogen, UK) and used for cDNA synthesis using Invitrogen™ Oligo (dT) primers and M-MMLV reverse transcriptase. Quantitative real-time PCR (qRT-PCR) reactions were performed using SYBR green detection technology on the Applied Biosystems Viia-7 Real-Time PCR system (Life Technologies). Results are expressed as relative fold change in rLFD in comparison to the standard chow diet, which has been scaled to the average across all samples per target gene and normalised to the reference genes, beta-2-microglobulin (B2m), TATA-box binding protein (Tbp) and glyceraldehyde-3-phosphate dehydrogenase (Gapdh) and presented as log2 fold change. The primer sequences are given in Supplementary Table S2.
2.7. Statistical analysis
Statistical analysis was carried out using GraphPad Prism version 9.5.1 (GraphPad Software, CA, USA) software packages. All values are presented as means ± standard error of the means (SEM) unless otherwise stated. All data was checked for normal distribution using the Shapiro–Wilk test. The significant differences in alpha diversity and abundances of each taxonomic unit were detected using Mann–Whitney-U. Statistical analysis of metabolomics data was carried out using Metaboanalyst 5.0. Data was normalised by sum, scaled by autoscaling and square root transformed. Principal Component Analysis (PCA) was employed to illustrate the clustering of different metabolites across groups. Univariate Analysis was carried out by Wilcoxon rank-sum tests. Changes in BA concentrations and gene expression were detected using Mann–Whitney-U or unpaired t-test. All correlation analyses were performed using Spearman rank.
3. Results
3.1. rLFD-fed mice display marked shifts in intestinal microbiota and metabolism
The impact of a rLFD on microbial composition was investigated by 16S rRNA sequencing. Alpha diversity was significantly reduced in rLFD-fed mice in comparison to standard chow, including Chao1 (p = 0.01), Shannon index (p = 0.003) and the number of observed species (p = 0.01) (A). The PCA component analysis displayed a clear separation between chow and rLFD microbiota composition (B), which was confirmed by a significant ANOSIM (p = 0.009). At the phylum level, rLFD-fed mice showed a significant increase in Deferribacterota and Desulfobacterota (Supplementary Table S3). At the genus level, linear discrimination analysis (LDA) effect size (LEfSe) revealed significant differences in 35 genera between rLFD and standard chow diet (C). 17 genera were significantly increased in rLFD, including Lachnospiraceae UCG 010, Eubacterium brachy group, XBB1006, Oscillospira, Lactococcus, Peptococcus, Tuzzerella, Ligilactobacillus, Rikenellaceae RC9 gut group, Mucispirillum, Intestinimonas, Colidextribacter, GCA 900066575, Lachnoclostridium, Turicibacter, Bilophila and Faecalibaculum. Conversely, 18 genera were significantly decreased, including Roseburia, Lachnospiraceae, NK4A136 group, Lachnospiraceae UCG 001, A2, Eubacterium xylanophilum group, Anaeroplasma, ASF356, Lachnospiraceae FCS020 group, Prevotellaceae UCG 001, Muribaculum, Anaerotruncus, Acetatifactor, Tyzzerella, HT002, Eubacterium siraeum group, UCG 005, Family XIII UCG 001.
Figure 2. rLFD significantly modulates the gut microbiome diversity and composition. (A) Alpha diversity using Chao1, Simpson’s index, and the number of observed species was decreased in a rLFD compared to chow (p < 0.05). Shannon index was decreased near significance (p = 0.06). (B) Beta diversity measured through ANOSIM showed significant separation between the two groups. (C) Linear discrimination analysis (LDA) effect size (LEfSe) of significant differences (FDR adjusted p < 0.05) in genera between rLFD and standard chow diet. (D) abundance of gut microbiota genera with bile salt hydrolase capability modulated by rLFD. (E) abundance of gut microbiota family Rumminococcaceae and genera Lachnoclostridium, with 7α-dehydroxylation capability. * = p < 0.05, ** = p < 0.01.
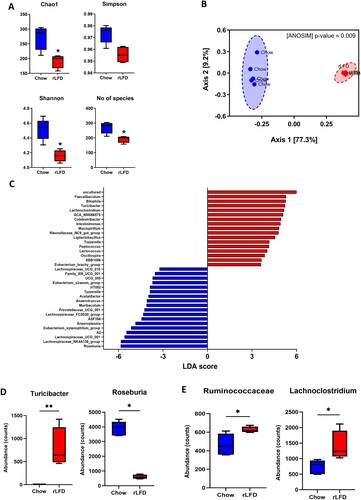
These shifts in microbiome profile included changes in bacterial entities involved in BA metabolism (D, E), including a significant shift in bacterial genera expressing both BSH capability (Roseburia and Turicibacter genera) and increases in enzymes involved in 7α-dehydroxylation (Ruminococcaceae family and Lachnoclostridium genera) in rLFD.
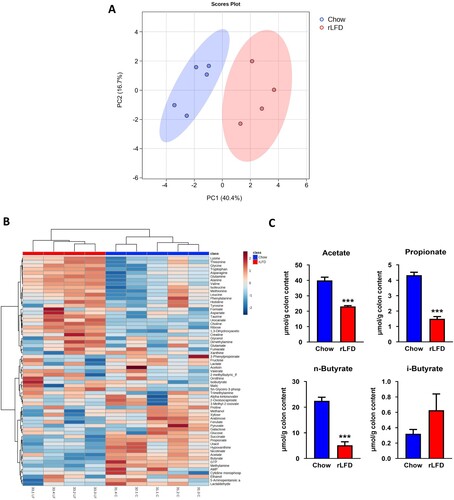
1H-NMR metabolomic profiling was conducted to gain insight into possible shifts in the production of bioactive metabolites. The PCA showed clear separations of the two diets, suggesting a shift in metabolic response to the rLFD (A). Full NMR concentrations are given in Supplementary Table S4. This was confirmed by heatmap analysis showing relative changes in abundance of 63 metabolites in both standard chow and rLFD (B). This shift included reductions in short-chain fatty acids (SCFAs) (acetate, propionate and n-butyrate, p < 0.001) and an increase in i-butyrate (p = 0.41) (C).
Figure 3. rLFD altered the metabolomic profile. (A) Partial least squares-discriminant analysis (PLS-DA) showed separation between rLFD and chow diet, indicative of a metabolic shift in response. (B) Heatmap depicting changes in each metabolite in chow and rLFD diet. (C) rLFD significantly modulates short-chain fatty acid concentrations, including a decrease in acetate, propionate, n-butyrate and an increase in i-butyrate. *** = p < 0.001.
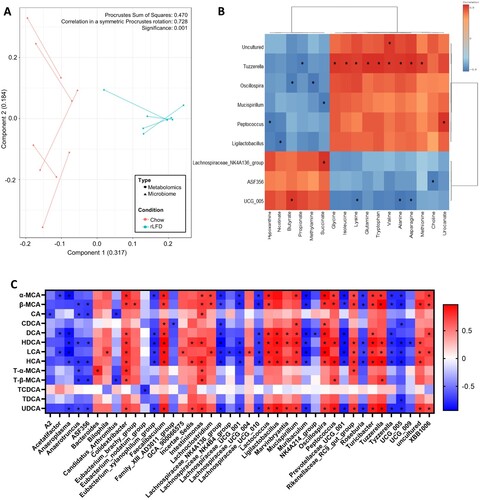
To clarify the relationship between the gut microbiome and the metabolome in the chow and rLFD, Procrustes analyses were conducted to evaluate the congruence of the two datasets. The analysis demonstrated that plots of both the metabolome and microbiome were separated by dietary intake, with a similarity between the metabolome and microbiome plots, suggesting an association between the two (p = 0.001, A). This was confirmed by a Spearman rank analysis, which correlated metabolites and microbiota genera that were significantly shifted in a rLFD in comparison to chow (FDR adjusted p < 0.05). This demonstrated a significant correlation between 17 metabolites with 9 of the gut microbiome genera (B). BA concentrations also significantly correlated with 40 gut microbiome genera, suggesting a strong relationship between the two (C).
Figure 4. The gut microbiome and the metabolome profile of chow and rLFD mice are significantly related. (A) Procrustes plot comparing the relationship between the microbiome and the metabolome profiles. Longer lines indicate more within-subject dissimilarity. (B) Spearman rank correlation showing the interaction between microbiota genus and metabolome that are significantly modulated by the rLFD. (C) Heatmap displaying Spearman rank correlation between bile acids in the colon and gut microbiome genera. * = p < 0.05. Red = positive correlation. Blue = negative correlation.
3.2. rLFD-fed mice display dysregulated bile acid metabolism
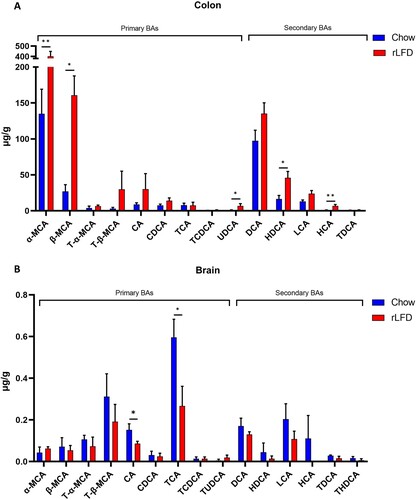
BA profiles were quantified from both colon and brain samples. BA profiles were significantly modulated in both the colon and the brain under rLFD challenge. Total colonic BA concentration significantly increased (Supplementary Table S5), predominantly from increases in alpha-muricholic acid (α-MCA), beta-muricholic acid (β-MCA) and ursodeoxycholic Acid (UDCA), hyodeoxycholic acid (HDCA) and hyocholic acid (HCA) (p < 0.05) (A). Concentrations of tauro-alpha-muricholic acid (T-α-MCA), tauro-β-muricholic acid (T-β-MCA), deoxycholic acid (DCA) and lithocholic acid (LCA) were also increased. In the brain, BA profiles were also significantly modulated, with significant decreases in cholic acid (CA) and taurocholic acid (TCA) (p < 0.05) (B). The chenodeoxycholic acid (CDCA):CA ratio was also calculated in both the colon (p = 0.80) and the brain (p = 0.68) and showed no significant difference, suggesting there was no shift in BA synthesis via the primary or alternative pathway (Supplementary Table S5). For detailed concentrations of BA in the colon and brain, see Supplementary Table S5.
Figure 5. Bile acid profiles in both the colon and brain are modulated by a rLFD. Bar plots represent the concentration of bile acids (µg/g) in the colon (A) and the brain (B). The blue bars represent the standard chow diet (n = 5), the red bars represent the rLFD diet (n = 5). Error bars = SEM. * = p < 0.05, ** = p < 0.01.
3.3. rLFD significantly modulates gene expression in the brain
Given the extent of BA modulation within the brain in response to rLFD, we investigated the extent to which these changes influence neuronal gene expression/function. qRT-PCR suggested significant modulation of five genes in the hippocampus (p < 0.05). Three genes were upregulated, Mitogen-Activated Protein Kinase 8 (Mapk8), DNA Damage Inducible Transcript 3 (Ddit3) and nuclear factor κ-light-chain-enhancer of activated B cells (NFκB1), whilst two genes were downregulated (Nitric Oxide Synthase 2 (Nos2) and Tyrosine 3-Monooxygenase/Tryptophan 5-Monooxygenase Activation Protein Theta (Ywhaq)) in the mice fed a rLFD in comparison to a chow diet (A). In the cortex, two genes were upregulated (Activity Regulated Cytoskeleton Associated Protein (Arc) and Ddit3), whilst peptidylprolyl isomerase A (Ppia) was downregulated (p < 0.05) (B). For a full list of changes in gene expression in the cortex and hippocampus, see Supplementary Table S6 and S7 respectively.
Figure 6. rLFD significantly modulates gene expression in the hippocampus and cortex. Significant log2 fold changes in mRNA expression in a rLFD (n = 5) in comparison to a chow (n = 5) diet in the hippocampus (A) and the cortex (B) (p < 0.05). (C) Heatmap displaying Spearman rank correlation between genes significantly modulated by rLFD and bile acids in the brain. * = p < 0.05. (D) TCA concentration in the brain is significantly modulated by rLFD and is correlated with NF-κB1 signalling in the hippocampus. Blue = chow diet. Red = rLFD. Shaded region displays 95% confidence interval.
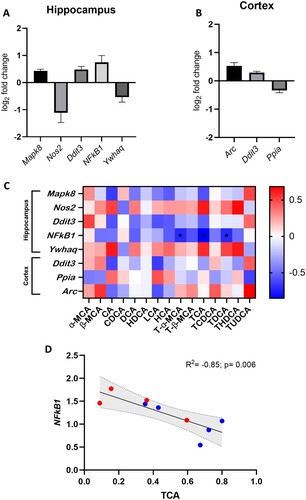
To identify whether the significant changes in gene expression were associated with BA concentrations in the brain, a Spearman rank correlation analysis was performed (C). Results showed a significant negative correlation between T-α-MCA (p = 0.037, R2 = −0.72), TCA (p = 0.006, R2 = −0.85) and TDCA (p = 0.034, R2 = −0.72) and hippocampal NFκB1 gene expression. As the rLFD significantly modulated both TCA concentration and NFκB1 expression in the brain, this association was of particular interest (D).
4. Discussion
As the consumption of refined foods increases in western society, it is important we elucidate its effect on brain health. Diet represents one of the largest factors influencing intestinal microbiota activity, and therefore can modify the microbiota-gut-brain axis and affect many aspects of human health. These include metabolic disorders, cardiovascular health and neurological function [Citation6]. The current study is to our knowledge the first to highlight the effects of a refined diet on BA profiles within the microbiota-gut-brain axis, including quantifying BA profiles in the brain; an area which is infrequently explored. Here, we demonstrated the feeding of a high sugar and fibre-poor rLFD to mice for eight weeks significantly shifted the gut microbiome profile, subsequently modulating BA composition in both the colon and the brain. These events, in part, upregulated NFκB1 gene expression in the hippocampus, a key mediator of CNS inflammatory response [Citation18], which is associated with a significant decrease in three taurine-conjugated BAs (TDCA, TCA and T-α-MCA).
The consumption of a rLFD for eight weeks was found to modulate gut microbiota composition, significantly reducing microbial diversity. Previous studies investigating low-fibre intake have found similar decreases in microbial diversity, which can even be transferred between generations [Citation19]. The rLFD also modulated 35 bacterial genera, decreasing SCFA-producing bacteria such as Roseburia, Eubacterium and several genera belonging to the Lachnospiraceae family, aligning with reductions in peripheral SCFA concentrations. Similar changes have previously been reported by Pontifex and colleagues, highlighting the poor fermentation of insoluble fibres in the rLFD by the gut microbiota [Citation20]. SCFAs provide a key energy source for colonocytes, promote the expansion of commensal microbiota, restrict the development of pathogenic bacteria and lessen local and systemic inflammation [Citation21], processes that are likely reduced under rLFD consumption.
Since BA metabolism is modulated by the gut microbiota, the shift in gut microbiome composition likely in part contributes to the dysregulation of BA synthesis in the rLFD. This relationship was highlighted by a significant correlation between several colonic BAs and gut microbiota genera, including a shift in bacterial genera expressing BSH (Roseburia and Turicibacter) and 7α-dehydroxylation enzymes (increases in Ruminococcaceae and Lachnoclostridium) in rLFD. These modulations likely underpin the increased concentration of colonic secondary BAs in the rLFD. Low-fibre intake shifts gut microbial metabolism towards the utilisation of less favourable substrates, particularly dietary and endogenously supplied proteins, which may be detrimental to the host and increase BA production [Citation22]. Of the 35 bacterial genera modulated by the rLFD, 34 were Gram-positive bacteria. Although bile acid tolerance is overall strain specific, Gram-positive bacteria are typically more sensitive to bile acids than Gram-negative bacteria [Citation23]. As such, these bacteria would likely be more responsive to increases in the bile acid concentrations.
In the colon, BA concentrations of α-MCA, β-MCA, HDCA and UDCA were significantly increased. These BAs are antagonists of the nuclear farnesoid receptor (FXR) [Citation24–26]. Ileal FXR activation induces expression of the fibroblast growth factor 19 (FGF19; FGF15 in mice), which represses BA synthesis by inhibiting the rate-limiting enzyme CYP7A1 [Citation27]. As such, increases in these antagonists likely inhibit this signalling in a rLFD and contribute to the increase in peripheral BA concentrations. FGF19 can also cross the BBB [Citation28]. Fibroblast growth factor receptor (FGFR) 4, the target for FGF15/19, has been detected in the brain and reduces orexigenic AGRP/NPY neuron activity in the hypothalamic arcuate nucleus [Citation29, Citation30]. This process improves peripheral glucose homeostasis. Therefore, a reduction in ileal FXR signalling from rLFD may reduce FGF15 in the brain and worsen peripheral glucose homeostasis.
Despite our results suggesting dysregulation of BA levels in the colon and the brain in rLFD, the two locations show definitive differences. For example, UDCA was below our limit of detection, suggesting it is either not present in the brain or exists in small quantities. However, UDCA was found in the colon. These differences may arise due to the varying capabilities of BAs to cross the BBB or changes in local synthesis. Indeed, whilst some studies have demonstrated the influx of BAs across the BBB and identified BA transporters in the brain, it is unclear the extent to which de novo synthesis contributes to the pool. The genes encoding cytochrome P450 enzymes required for the alternative BA synthesis pathway (CYP8B1, CYP27A1 and CYP7B1) are expressed in the brain [Citation31]. However, since CYP7A1 is not found in the brain, BAs such as CA likely enter from the periphery. Furthermore, the presence of secondary BAs in the brain strongly suggests a role of the gut microbiota and transport to the CNS from the periphery. In terms of dietary-related modulation, our results show lower total BA in the brain of rLFD which may indicate disrupted BA transport from the periphery or a reduction in de novo synthesis compared with a chow diet.
Modulated BA concentrations in the brain suggest BA dysregulation occurs in rLFD. Brain BA dysmetabolism has been postulated as a factor for the pathogenesis of neurodegenerative diseases such as Alzheimer’s disease (AD) and Parkinson's disease (PD) [Citation10, Citation32]. In particular, our results show significant decreases in CA and TCA, suggesting these BAs may be most modulated by a rLFD. TCA has previously been found to be decreased in the brain of AD patients and both CA and TCA concentrations are decreased in the brain of 12-month APP/PS1 mice [Citation11]. However, since behavioural outcome measures were not performed in this study, we cannot determine whether BA dysregulation from the rLFD affects cognition. CA is also an antagonist for N-methyl-D-aspartate (NMDA) receptor and γ-aminobutyric acid (GABA) type A (GABAA) receptor. NMDA receptors play a role in synaptic communication by generating a Ca2+ influx and initiating calmodulin to activate CaMKII, MAPK, CREB, and PI3K pathways [Citation33]. GABAA receptor activation triggers chloride ions release following neuron hyperpolarisation and neurotransmission inhibition [Citation34]. These processes are likely modulated by a reduction in CA in a rLFD. Nevertheless, these results suggest BA dysmetabolism may also influence BA homeostasis and signalling in the brain.
Results from the qRT-PCR analysis showed an upregulation of pro-apoptotic genes in the rLFD through the cytochrome c mediated pathway (Mapk8) in the hippocampus and through the enhanced expression of autophagy genes (Ddit3 and Mapk8) in the cortex and hippocampus; a process highly detrimental to neurons [Citation35]. Ddit3 can also upregulate the Txnip gene, which in turn upregulates neuroinflammatory genes and promotes the formation of the NLR family pyrin domain containing 3 (NLRP3) inflammasome, leading to neuroinflammation. These changes have previously been linked to the worsening pathology observed in AD [Citation35]. In the cortex, Arc gene expression was upregulated in the rLFD compared to the chow diet. Typically, ARC plays a role in the maintenance phase of long-term potentiation and spatial memory consolidation. However, chronic activation of the immune system alters ARC activity, which has been suggested as a mechanism of cognitive dysfunction associated with neuroinflammatory conditions [Citation36]. The rLFD also significantly downregulated Ppia, Nos2 and Ywhaq. Inside cells, PPIA is suggested to play a beneficial role, promoting de novo protein folding and protecting against oxidative stress. However, when deficient, Ppia has been linked to neurodegenerative features similar to frontotemporal dementia, marked TDP-43 pathology and late-onset motor dysfunction [Citation37]. Nos2 produces inducible NOS (iNOS), which can play a critical role in neuroinflammation by producing nitric oxide (NO), an important signalling and redox factor in the brain. Although NO is associated with tissue damage, it can also promote cell survival. In a mouse model of AD, a Nos2 deletion was linked to multiple neuropathologies including increased neuronal degradation and caspase-3 activation [Citation38]. Finally, Ywhaq encodes the 14-3-3-θ protein which binds major histocompatibility complex (MHC) class II molecules and is implicated in various neurodegenerative diseases [Citation39]. While the exact impact of Ywhaq on brain health is still unclear, there is evidence to suggest that it may play an important role in protecting against oxidative stress [Citation40] and regulating mood and behaviour [Citation41]. Taken together, these results suggest a rLFD reduces the expression of several neuroprotective proteins in the hippocampus and cortex.
Only NF-κB1 gene expression was found to both be significantly modulated in a rLFD and correlated to BA concentrations in the brain. NF-κB1 was inversely correlated with three taurine-conjugated BAs (T-α-MCA, TCA and TDCA). Of these BAs, TCA was also significantly modulated by a rLFD in the brain, suggesting the diet may decrease neuronal TCA concentrations which increases NF-κB1 signalling. NFκB1 is a well-known regulator of inflammation, stress, and immune responses as well as cell survival. In glia, NF-κB regulates inflammatory processes that exacerbate diseases such as autoimmune encephalomyelitis, ischemia, and Alzheimer's disease [Citation42]. Therefore, an increase in NF-κB1 expression in rLFD likely highlights an increase in neuroinflammation, which is associated with a decrease in taurine-conjugated BAs. Taurine-conjugated BAs are known to play a neuroprotective role in the brain. In vitro evidence shows that TDCA can inhibit NF-κB1 activation in response to IL-1β [Citation43]. Taurine itself can also suppress inflammatory damage by acting on NF-κB expression [Citation44]. In some neurological disorders where inflammation plays a key role, taurine transport across the BBB is impaired, leading to reductions within the CNS [Citation10, Citation45]. Therefore, our results suggest a refined diet can significantly reduce TCA concentrations in the brain which likely reduces the inhibition of NF-κB1 activation and induces a neuroinflammatory response. However, as this is based on association data, further studies examining the link between TCA and neuroinflammation would be required. Particularly as the current understanding of specific BAs roles within the brain is limited.
One major limitation arising from this study is the differences in BA profiles and metabolism among species, making translating these results from animal models to human data challenging. For example, in humans, CA and CDCA represent the major primary BAs, whereas mice primarily produce MCAs from CDCA. UDCA is also considered a primary BA in mice, whilst it is a microbial-derived secondary BA in humans. These differences may result in discrepancies observed in experimental versus clinical studies. Furthermore, our study did not perform cognitive measures on the mice, limiting our ability to infer how the modulation of BA concentrations and gene expression in the brain might influence cognitive changes in a rLFD. This study also investigated bile acid changes using only male mice. As bile acid synthesis and composition is sexually dimorphic, further studies investigating these results in females will be required. Recent research has also revealed the capacity of the microbiome to produce new microbially conjugated BAs (MCBAs) that are conjugated with phenylalanine, leucine, and tyrosine on a cholic acid backbone [Citation46]. Although the biological function of these new MCBAs remains unclear, future research may focus on uncovering their relationship with a refined diet.
Overall, our results suggest a novel link between a refined diet and detrimental neuronal processes, likely in part through modulation of the microbiota-gut-brain axis and BA dysmetabolism. These results highlight the interconnected nature of dietary carbohydrates, gut microbiome composition and bile acids on brain health and function. BA dysregulation is becoming increasingly important in numerous neuropathological states, yet little is understood about its roles in the brain. Future research should focus on uncovering the origin and transport of BAs in the brain to improve our understanding of communication within the microbiota-gut-brain axis and identify potential therapeutic targets.
Connell et al_Supplementary information rev1.docx
Download MS Word (62.4 KB)Connell et al_Supplementary information rev1_anonymous.docx
Download MS Word (61.5 KB)Disclosure statement
No potential conflict of interest was reported by the author(s).
Data availability statement
The data that support the findings of this study are available on request from the corresponding author.
Additional information
Funding
Notes on contributors
Emily Connell
Emily Connell BSc, is a post-graduate research student at Norwich Medical School at the University of East Anglia.
Britt Blokker
Britt Blokker PhD, is a researcher at Norwich Medical School at the University of East Anglia.
Lee Kellingray
Lee Kellingra PhD, is a research scientist at Quadram Institute Bioscience.
Gwénaëlle Le Gall
Gwénaëlle Le Gall PhD, is a Lecturer in Nutritional Biochemistry at Norwich Medical School, University of East Anglia
Mark Philo
Mark Philo PhD, is a researcher at the Quadram Institute Biosciences.
Matthew G. Pontifex
Matthew G. Pontifex PhD, is a Lecturer in Health Sciences (Dietetics), at the School of Health Sciences, University of East Anglia.
Arjan Narbad
Arjan Narbad PhD, is a Professor and Translational Microbiome group leader at the Quadram Institute Bioscience.
Michael Müller
Michael Müller PhD, is a Professor at Norwich Medical School, University of East Anglia.
David Vauzour
David Vauzour PhD, is an Associate Professor in Molecular Nutrition at Norwich Medical School, University of East Anglia.
References
- Shi H, Ge X, Ma X, Zheng M, Cui X, Pan W, et al. A fiber-deprived diet causes cognitive impairment and hippocampal microglia-mediated synaptic loss through the gut microbiota and metabolites. Microbiome. 2021;9(1):223. doi:10.1186/s40168-021-01172-0.
- Gomes JAS, Silva JF, Marçal AP, Silva GC, Gomes GF, de Oliveira ACP, et al. High-refined carbohydrate diet consumption induces neuroinflammation and anxiety-like behavior in mice. J Nutr Biochem. 2020;77:108317. doi:10.1016/j.jnutbio.2019.108317.
- Gomes JAS, Oliveira MC, Gobira PH, Silva GC, Marçal AP, Gomes GF, et al. A high-refined carbohydrate diet facilitates compulsive-like behavior in mice through the nitric oxide pathway. Nitric Oxide. 2018;80:61–9. doi:10.1016/j.niox.2018.08.008.
- Loughrey DG, Lavecchia S, Brennan S, Lawlor BA, Kelly ME. The impact of the Mediterranean diet on the cognitive functioning of healthy older adults: a systematic review and meta-analysis. Adv Nutr. 2017;8(4):571–86. doi:10.3945/an.117.015495.
- Morrison KE, Jašarević E, Howard CD, Bale TL. It’s the fiber, not the fat: significant effects of dietary challenge on the gut microbiome. Microbiome. 2020;8(1):15. doi:10.1186/s40168-020-0791-6.
- Connell E, Le Gall G, Pontifex MG, Sami S, Cryan JF, Clarke G, et al. Microbial-derived metabolites as a risk factor of age-related cognitive decline and dementia. Mol Neurodegeneration. 2022;17(1):43. doi:10.1186/s13024-022-00548-6.
- Monteiro-Cardoso VF, Corlianò M, Singaraja RR. Bile acids: a communication channel in the gut-brain axis. Neuromol Med. 2021;23(1):99–117. doi:10.1007/s12017-020-08625-z.
- Ridlon JM, Kang DJ, Hylemon PB, Bajaj JS. Bile acids and the Gut microbiome. Curr Opin Gastroenterol. 2014;30(3):332–8. doi:10.1097/MOG.0000000000000057.
- Zheng X, Huang F, Zhao A, Lei S, Zhang Y, Xie G, et al. Bile acid is a significant host factor shaping the gut microbiome of diet-induced obese mice. BMC Biol. 2017;15(1):120. https://doi.org/10.1186/s12915-017-0462-7.
- Baloni P, Funk CC, Yan J, Yurkovich JT, Kueider-Paisley A, Nho K, et al. Metabolic network analysis reveals altered bile acid synthesis and metabolism in Alzheimer’s disease. Cell Rep Med. 2020;1(8):100138. doi:10.1016/j.xcrm.2020.100138.
- Pan X, Elliott CT, McGuinness B, Passmore P, Kehoe PG, Hölscher C, et al. Metabolomic profiling of bile acids in clinical and experimental samples of Alzheimer’s disease. Metabolites. 2017;7(2):28. doi:10.3390/metabo7020028.
- MahmoudianDehkordi S, Arnold M, Nho K, Ahmad S, Jia W, Xie G, et al. Altered bile acid profile associates with cognitive impairment in Alzheimer’s disease – an emerging role for gut microbiome. Alzheimers Dement. 2019;15(1):76–92. doi:10.1016/j.jalz.2018.07.217.
- du Sert NP, Hurst V, Ahluwalia A, Alam S, Avey MT, Baker M, et al. The ARRIVE guidelines 2.0: updated guidelines for reporting animal research. PLoS Biol. 2020;18(7):e3000410. doi:10.1371/journal.pbio.3000410.
- Le Gall G, Noor SO, Ridgway K, Scovell L, Jamieson C, Johnson IT, et al. Metabolomics of fecal extracts detects altered metabolic activity of gut microbiota in ulcerative colitis and irritable bowel syndrome. J Proteome Res. 2011;10(9):4208–18. doi:10.1021/pr2003598.
- Vauzour D, Rodriguez-Ramiro I, Rushbrook S, Ipharraguerre IR, Bevan D, Davies S, et al. n-3 fatty acids combined with flavan-3-ols prevent steatosis and liver injury in a murine model of NAFLD. Biochim Biophys Acta Mol Basis Dis. 2018;1864(1):69–78. doi:10.1016/j.bbadis.2017.10.002.
- Anand KS, Dhikav V. Hippocampus in health and disease: an overview. Ann Indian Acad Neurol. 2012;15(4):239–46. doi:10.4103/0972-2327.104323.
- Jawabri KH, Sharma S. Physiology, cerebral cortex functions. In: Jawabri KH, Sharma S, editors. Statpearls. Treasure Island, FL: StatPearls Publishing; 2023.
- Rolova T, Puli L, Magga J, Dhungana H, Kanninen K, Wojciehowski S, et al. Complex regulation of acute and chronic neuroinflammatory responses in mouse models deficient for nuclear factor kappa B p50 subunit. Neurobiol Dis. 2014;64:16–29. doi:10.1016/j.nbd.2013.12.003.
- Sonnenburg ED, Smits SA, Tikhonov M, Higginbottom SK, Wingreen NS, Sonnenburg JL. Diet-induced extinctions in the gut microbiota compound over generations. Nature. 2016;529(7585):212–5. doi:10.1038/nature16504.
- Pontifex MG, Mushtaq A, Le Gall G, Rodriguez-Ramiro I, Blokker BA, Hoogteijling MEM, et al. Differential influence of soluble dietary fibres on intestinal and hepatic carbohydrate response. Nutrients. 2021;13(12):4278. doi:10.3390/nu13124278.
- den Besten G, van Eunen K, Groen AK, Venema K, Reijngoud D-J, Bakker BM. The role of short-chain fatty acids in the interplay between diet, gut microbiota, and host energy metabolism. J Lipid Res. 2013;54(9):2325–40. doi:10.1194/jlr.R036012.
- Zeng H, Umar S, Rust B, Lazarova D, Bordonaro M. Secondary bile acids and short chain fatty acids in the colon: a focus on colonic microbiome, cell proliferation, inflammation, and cancer. Int J Mol Sci. 2019;20(5):1214. doi:10.3390/ijms20051214.
- Min YW, Rezaie A, Pimentel M. Bile acid and gut microbiota in irritable bowel syndrome. J Neurogastroenterol Motil. 2022;28(4):549–61. doi:10.5056/jnm22129.
- Kuang J, Wang J, Li Y, Li M, Zhao M, Ge K, et al. Hyodeoxycholic acid alleviates non-alcoholic fatty liver disease through modulating the gut-liver axis. Cell Metab. 2023;35(10):1752–66.e8. doi:10.1016/j.cmet.2023.07.011.
- Mueller M, Thorell A, Claudel T, Jha P, Koefeler H, Lackner C, et al. Ursodeoxycholic acid exerts farnesoid X receptor-antagonistic effects on bile acid and lipid metabolism in morbid obesity. J Hepatol. 2015;62(6):1398–404. doi:10.1016/j.jhep.2014.12.034.
- Sayin SI, Wahlström A, Felin J, Jäntti S, Marschall H-U, Bamberg K, et al. Gut microbiota regulates bile acid metabolism by reducing the levels of tauro-beta-muricholic acid, a naturally occurring FXR antagonist. Cell Metab. 2013;17(2):225–35. doi:10.1016/j.cmet.2013.01.003.
- Lee FY, Lee H, Hubbert ML, Edwards PA, Zhang Y. FXR, a multipurpose nuclear receptor. Trends Biochem Sci. 2006;31(10):572–80. doi:10.1016/j.tibs.2006.08.002.
- Hsuchou H, Pan W, Kastin AJ. Fibroblast growth factor 19 entry into brain. Fluids Barriers CNS. 2013;10(1):32. doi:10.1186/2045-8118-10-32.
- Marcelin G, Jo Y-H, Li X, Schwartz GJ, Zhang Y, Dun NJ, et al. Central action of FGF19 reduces hypothalamic AGRP/NPY neuron activity and improves glucose metabolism. Mol Metab. 2014;3(1):19–28. doi:10.1016/j.molmet.2013.10.002.
- Miyake A, Itoh N. Rat fibroblast growth factor receptor-4 mRNA in the brain is preferentially expressed in cholinergic neurons in the medial habenular nucleus. Neurosci Lett. 1996;203(2):101–4. doi:10.1016/0304-3940(95)12272-9.
- Nishimura M, Yaguti H, Yoshitsugu H, Naito S, Satoh T. Tissue distribution of mRNA expression of human cytochrome P450 isoforms assessed by high-sensitivity real-time reverse transcription PCR. Yakugaku Zasshi. 2003;123(5):369–75. doi:10.1248/yakushi.123.369.
- Graham SF, Rey NL, Yilmaz A, Kumar P, Madaj Z, Maddens M, et al. Biochemical profiling of the brain and blood metabolome in a mouse model of prodromal Parkinson’s disease reveals distinct metabolic profiles. J Proteome Res. 2018;17(7):2460–9. doi:10.1021/acs.jproteome.8b00224.
- Montes de Oca B. Flux-Independent NMDAR signaling: molecular mediators, cellular functions, and complexities. Int J Mol Sci. 2018;19:3800. doi:10.3390/ijms19123800.
- Çiçek SS. Structure-dependent activity of natural GABA(A) receptor modulators. Molecules. 2018;23(7):1512. doi:10.3390/molecules23071512.
- Ajoolabady A, Lindholm D, Ren J, Pratico D. ER stress and UPR in Alzheimer’s disease: mechanisms, pathogenesis, treatments. Cell Death Dis. 2022;13(8):1–15. doi:10.1038/s41419-022-05153-5.
- Rosi S. Neuroinflammation and the plasticity-related immediate-early gene Arc. Brain Behav Immun. 2011;25(Suppl 1):S39–S49. doi:10.1016/j.bbi.2011.02.003.
- Pasetto L, Grassano M, Pozzi S, Luotti S, Sammali E, Migazzi A, et al. Defective cyclophilin A induces TDP-43 proteinopathy: implications for amyotrophic lateral sclerosis and frontotemporal dementia. Brain. 2021;144(12):3710–26. doi:10.1093/brain/awab333.
- Colton CA, Vitek MP, Wink DA, Xu Q, Cantillana V, Previti ML, et al. NO synthase 2 (NOS2) deletion promotes multiple pathologies in a mouse model of Alzheimer’s disease. Proc Natl Acad Sci. 2006;103(34):12867–72. doi:10.1073/pnas.0601075103.
- Jia B, Wu Y, Zhou Y. 14-3-3 and aggresome formation: implications in neurodegenerative diseases. Prion. 2014;8(2):173–7. doi:10.4161/pri.28123.
- Pennington KL, Chan TY, Torres MP, Andersen JL. The dynamic and stress-adaptive signaling hub of 14-3-3: emerging mechanisms of regulation and context-dependent protein–protein interactions. Oncogene. 2018;37(42):5587–604. doi:10.1038/s41388-018-0348-3.
- Demars F, Kebir O, Marzo A, Iftimovici A, Schramm C, Krebs M-O, Chaumette B. Dysregulation of peripheral expression of the YWHA genes during conversion to psychosis. Sci Rep. 2020;10(1):9863. doi:10.1038/s41598-020-66901-1.
- Kaltschmidt B, Kaltschmidt C. NF-kappaB in the nervous system. Cold Spring Harb Perspect Biol. 2009;1(3):a001271. doi:10.1101/cshperspect.a001271.
- Ghaderpour A, Jeong J-Y, Kim Y-H, Zou Y, Park K-S, Hong E-J, et al. Taurodeoxycholate, a GPCR19 agonist, ameliorates atopic dermatitis in Balb/c mice. Eur J Immunol. 2023: e2250048. https://doi.org/10.1002/eji.202250048.
- Agca CA, Tuzcu M, Hayirli A, Sahin K. Taurine ameliorates neuropathy via regulating NF-κB and Nrf2/HO-1 signaling cascades in diabetic rats. Food Chem Toxicol. 2014;71:116–21. doi:10.1016/j.fct.2014.05.023.
- Csernansky JG, Bardgett ME, Sheline YI, Morris JC, Olney JW. CSF excitatory amino acids and severity of illness in Alzheimer’s disease. Neurology. 1996;46(6):1715–20. doi:10.1212/WNL.46.6.1715.
- Quinn RA, Melnik AV, Vrbanac A, Fu T, Patras KA, Christy MP, et al. Global chemical effects of the microbiome include new bile-acid conjugations. Nature. 2020;579(7797):123–9. doi:10.1038/s41586-020-2047-9.