
 ?Mathematical formulae have been encoded as MathML and are displayed in this HTML version using MathJax in order to improve their display. Uncheck the box to turn MathJax off. This feature requires Javascript. Click on a formula to zoom.
ABSTRACT
Rigid aircraft pavements are generally comprised of unreinforced concrete slabs constructed on a bound or granular sub-base layer, over the natural or constructed subgrade or fill. Important to any rigid aircraft pavement design and construction are the joints between the concrete slabs. The joints control shrinkage cracks during curing, allow for thermal expansion and contraction during temperature cycles, they isolate concrete slabs from structural penetrations and importantly, provide load transfer between adjacent slabs. Load transfer is commonly modelled using finite element methods; however, any new model should be validated against observed physical events. Recently, full-scale testing was performed at the Federal Aviation Authority National Airport Pavement Testing Facility as part of Construction Cycle 8 (CC8), which investigated load transfer characteristics for a range of joint types. The results from CC8 tests provide up-to-date stress and strain values to validate any new finite element model. This paper presents the development of a finite element model to predict load transfer of a doweled construction joint, and its validation against CC8 test results. The model showed good agreement with CC8 test results, and now that it is validated, will be used to investigate innovative joint solutions for rigid aircraft pavements.
Introduction
Rigid aircraft pavements are generally comprised of unreinforced concrete slabs constructed on a bound or granular sub-base layer, over the natural or constructed subgrade or fill (AAA Citation2017). Important to any rigid aircraft pavement design and construction are the joints between the concrete slabs. The joints control shrinkage cracks during curing, allow for thermal expansion and contraction during daily and seasonal temperature cycles, they isolate concrete slabs from structural penetrations and importantly, they provide load transfer between adjacent slabs (Jamieson and White Citation2023).
Load transfer is the ability of a joint or crack in a concrete pavement to transfer load from one slab to the next when trafficked. Load transfer relies on joint stiffness, which contains three physical contributors: stiffness from point devices, such as dowels, stiffness from aggregate interlock, and apparent stiffness caused by elastic solid base effects (Byrum Citation2011b). In current rigid aircraft pavement design programs, it is assumed that 25% of a load will be transferred to an adjacent slab, thus reducing edge stresses and overall pavement thickness requirements (Ahlvin Citation1991, FAA Citation2021).
To model load transfer, previous researchers have favoured finite element (FE) methods (Jamieson and White Citation2023). FE methods are used to solve mechanics problems by discretising the problem domain into small elements, known as finite elements, and then solving for a system of algebraic equations to determine physical properties such as displacements, stresses and strains (Liu and Quek Citation2003). Initially, bespoke programs specifically for the load transfer problem were developed (Hammons and Ioannides Citation1997), however, models using general-purpose FE programs, such as ABAQUS CAE 2023 (Dassault Systemes Citation2023a) are now more common. However, any new model should be validated against observed physical events to ensure results are within the required tolerance and accuracy (Babuska and Oden Citation2004).
In 2018, full-scale testing of rigid aircraft pavement joints was conducted at the Federal Aviation Authority (FAA) National Airport Pavement Testing Facility (NAPTF), as part of Construction Cycle 8 (CC8) (Ahmed et al. Citation2021). Twenty slabs were constructed with a range of joint types and then loaded with a dual (D)-gear and 3D-gear to determine pavement response with a focus on load transfer values. The results from this testing provide up-to-date strain and stress data to validate any new FE model of rigid aircraft pavements. This paper discusses the development and presents a validation of a 3-dimensional FE model to replicate a doweled construction joint from the CC8 testing regime. Validation of the model will enable further research to investigate innovative joint solutions for rigid aircraft pavements, which can be used to inform future development in practical rigid pavement thickness determination for airports.
Background
Rigid aircraft pavements
Rigid aircraft pavements are typically comprised of an unreinforced 40 mm (maximum aggregate size) Portland cement concrete base over a granular or bound sub-base, constructed on a natural, improved or imported subgrade (AAA Citation2017). The pavement is divided into slabs of square or almost-square ranging from 4 m to 8 m in length, to account for paver width and contraction joints. Unlike flexible pavements which spread the load in each constructed layer to protect the subgrade, rigid pavements respond to load by dissipating the stress within the concrete slab (AAA Citation2017).
Initial design criteria for rigid aircraft pavements were developed around WWII and were based on Westergaard centre-slab loading theory (Huang Citation1993), which used the modulus of subgrade reaction, or k-value, to characterise the support to the concrete slab offered by the subgrade material using a Winkler foundation. However, early verification tests in 1943 determined that edge loading was more severe, evidenced by expansion joints without load transfer devices demonstrating early failures in test pavement sections (Ahlvin Citation1991). Consequently, design criteria included a provision for either load transfer devices or thickening of slab edges by 25%. It was assumed that properly designed joints would provide a 25% load transfer to the adjacent slab (Ahlvin Citation1991), thus reducing the edge stress, and the load transfer assumption could be included in design methods. The 25% load transfer value still remains in current pavement design systems, which have developed beyond Westergaard theory to now include layered elastic and FE methods, such as those used in the common aircraft pavement thickness design tool FAARFIELD (FAA Citation2021).
Joints and joint systems
Joints are necessary on rigid pavements to account for paver width during construction, control shrinkage cracks during concrete curing, allow for thermal expansion and contraction, to isolate slabs from structural penetrations and pavement sections, and importantly, to provide load transfer between adjacent slabs (Jamieson and White Citation2023). Broadly, rigid aircraft pavement joints fall into three categories; construction joints, contraction joints and special purpose joints, with the location of the joint defining what joint category is required (FAA Citation2021). Each of the joint types is differentiated by smooth (formed) or fractured (aggregate) faces; dowels, or absence of dowels; and thickened or non-thickened edges as described in .
Table 1. Joint types.
Different authorities will use different joint types for similar applications. For example, United Kingdom (UK) practice is to use butt construction joints for the edge of paving lanes (MOD Citation2011), where United States (US) and Australian practice is to use dowelled construction joints (FAA Citation2021, Jamieson and White Citation2021). Keyed joints are also used by UK, but have been phased out of Australian and US practice due to a history of premature cracking (Ahlvin Citation1991). The differences in joint type are likely due to each authority balancing construction complexity with load transfer requirements and joint distress potential.
Load transfer
Load transfer is the ability for a joint or crack in a concrete pavement to transfer load from one slab to the next when trafficked. Load transfer relies on joint stiffness, which contains three physical contributors in and Equation 1: stiffness from point devices, such as dowels, stiffness from aggregate interlock, and apparent stiffness caused by elastic solid base effects (Byrum Citation2011b).
(1)
(1) where: kj = total measured line stiffness along the slab joint (kN/mm/mm); kd = stiffness from point devices (dowels) (kN/mm/mm); kAgg = stiffness contribution for slab crack face aggregate interlock (kN/mm/mm); kbase = apparent joint stiffness contribution caused by elastic solid base effects (kN/mm/mm).
Figure 1. Joint stiffness contributors.
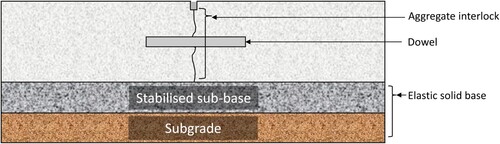
The dowels provide joint stiffness predominately through vertical shear, with moment resistance provided by the dowels being negligible (Byrum Citation2011a). Dowel dimension specifications are based on providing a sufficient length and diameter to mitigate bearing stresses, as well as sufficient embedment length to maximise load transfer (ACPA Citation2010). Early research in the 1950s showed that there was no structural benefit to use shapes other than round dowels (Ahlvin Citation1991); however, the practice has evolved and now multiple structural shapes are used (TCS Citation2016), although these alternate-shaped dowels are generally absent on aircraft pavements.
Aggregate interlock provides stiffness to the joint through the shear interaction of the irregular-shaped crack that is induced at contraction joints after early-life sawing. Crack shape typically follows the aggregate-mortar interface zone as this is generally weaker than the coarse aggregate. In concrete mixtures that have softer coarse aggregates, a smoother surface is expected as the crack can penetrate through the aggregate (Jensen Citation2002). For aircraft pavements, this is not likely the case, because high-quality source rock is generally required. A direct measurement to determine aggregate interlock contribution is the crack width (Pradena and Houben Citation2018), as a larger crack will mean less interaction between two slabs, and therefore less shear interaction.
Sub-base support provides apparent stiffness to the joint through elastic solid base effects, but in reality, is not joint stiffness itself, as joint stiffness is generally defined by the interaction of the concrete slab elements only (Byrum Citation2011b). However, the sub-base type has been found to significantly affect joint behaviour when considering a bound or unbound base (Byrum Citation2011a), with load transfer efficiency increasing for the bound case (Colley and Humphrey Citation1967).
Load transfer characterisation
Load transfer is commonly characterised via deflection (Equation 2), stress (Equation 3), or free-edge stress (Equation 4). For deflection and stress, the term load transfer efficiency (LTE) is used and defined as the percentage of the unloaded slab deflection (or stress) over the loaded slab deflection (or stress). The LTE of a joint, specifically for deflection, can be relatively easily measured in the field using a falling weight deflectometer (White Citation2018, Gkyrtis et al. Citation2021), with joints that have no load transfer recording 0%, and perfectly performing joints recording 100%. The third load transfer value used is the percentage of free-edge stress transferred (LT) and can be considered as how much stress has been transferred to an unloaded slab, relative to the loaded slab when under a free-edge loading condition. This is the value typically used for design practices, and can range from 0% up to 50% (Byrum Citation2011a).
(2)
(2)
(3)
(3)
(4)
(4) where, LTEδ = Deflection load transfer efficiency (%); LTEσ = Stress load transfer efficiency (%); LT = Percent of free-edge stress transferred (%); δL = Deflection of loaded side of the joint (mm); δU = Deflection of unloaded side of the joint (mm); σL = Bending stress in the loaded slab (MPa); σU = Bending stress in the unloaded slab (MPa); ϵL = Bending strain in the loaded slab edge at the joint; ϵF = Bending strain in the free-edge loading condition for the loaded slab edge at the joint.
As discussed earlier, it is usually assumed in pavement design methods that a well-constructed joint will transfer at least 25% of the edge stress to the adjacent slab, and this value could be included in the design process. However, through a review of multiple studies, Byrum (Citation2011b) demonstrated that the 25% value was not a constant value for in-field performance. Rather, it is a design allowance to account for the stochastic nature of LT. Joints will naturally open and close due to ambient temperature, and slabs will curl due to temperature differentials, each having an effect on LT. Load magnitude, base foundation and type were also demonstrated to have an effect on LT (Byrum Citation2011b). Although multiple studies have demonstrated that LT can exceed 25%, Hutchinson (Citation1966) described the difference between the maximum stress at the edge and centre-slab loading is only about 25%; consequently, any device that exceeds 25% LT will make the centre-slab loading condition critical. That is, designing load transfer devices that provide greater than 25% LT may not improve structural design efficiency because the centre-slab loading condition will take precedence for the resultant thickness. This is also reflected in the latest versions of FAARFIELD, which calculate the greater of 75% of the edge stress, or the internal stress (Brill and Kawa Citation2017).
NAPTF CC8 testing
Because of the importance of load transfer, full-scale testing of rigid aircraft pavement joints was conducted at the NAPTF, as part of CC8 in 2018 (Ahmed et al. Citation2021). Twenty 4.6 m by 4.6 m and 305 mm thick slabs were constructed with un-dowelled contraction joints, doweled contraction joints, doweled construction joints and sinusoidal keyed joints. Doweled construction joints were used at the northern longitudinal joints, and sinusoidal keyed joints were used at the southern longitudinal construction joints. The main objectives of the test were to compare the performance of a sinusoidal keyed joint to doweled construction joints and to compare the performance of doweled versus un-doweled contraction joints (Ahmed et al. Citation2021). Included in the testing were initial ramp-up tests that assessed pavement response at increasing wheel loads ranging from 22,679 kg (50,000 lbs) to 31,751 kg (70,000 lbs) for both D-gear and 3D-gear configurations. The ramp-up tests informed what wheel loads would be used for the rest of the test regime.
Instrumentation used in the test section included strain gauges, eddy current sensors and thermocouple trees, to measure strain response, vertical movements and temperature gradients in the slabs, respectively. Strain gauges for bottom slab strain measurements were placed approximately 25 mm above the bottom of slabs, and approximately 80 mm on either side of the joints being tested (Tomlinson et al. Citation2018). Additionally, a heavy-weight deflectometer was used to measure relative deflections across the joints, in order to determine LTEδ, and joint stiffness (kj) using a method developed by Byrum (Citation2011b). Failure of a test group was defined as the point at which the average LTEδ was first at or below 60% (Cary et al. Citation2020).
A third objective of the experiment was to determine the LT value and compare that to the 25% that is used in contemporary pavement thickness design. Because LT is difficult to measure, due to requiring a loaded strain from a slab in the free-edge condition, the stress-based LTσ was used as an approximation. LTσ can be calculated without a free-edge slab using Equation 5, assuming that approximations for free-edge deflection and free-edge stress hold true, as described in Equation 6 and Equation 7, respectively. Byrum (Citation2011a) explained that these two approximations are generally valid when using a Winkler foundation, and assuming that the slab remains in direct contact with the Winkler foundation support. That is usually the case for relatively low bearing strength subgrades, flat slabs and small aircraft loads.
(5)
(5) where, EL = modulus of loaded slab (MPa); EU = modulus of unloaded slab (MPa); ϵL = edge strain in the loaded slab, measured from strain gauges; ϵU = edge strain in the unloaded slab, measured from strain gauges.
(6)
(6)
(7)
(7) where, δF = deflection of loaded slab in free-edge condition (mm); σF = stress of loaded slab in free-edge condition (MPa).
The CC8 testing concluded that sinusoidal keyed construction joints demonstrated performance comparable to doweled construction joints, that the LTEδ of un-dowelled contraction joints is highly temperature dependant, and that the stress-based LTσ for doweled contraction joints, doweled construction joints, and sinusoidal keyed joints, all exceeded 30%, which is larger than the 25% design assumption. Important to this study, is the testing provides up-to-date strain, stress and deflection data, that could be used to calibrate or validate an FE model for load transfer.
Finite element methods
FE methods are used to solve mechanics problems by discretising the problem domain into small elements, known as finite elements, and then solving for a system of algebraic equations to determine physical properties such as displacements, stresses and strains (Liu and Quek Citation2003). FE methods have been used extensively in rigid pavement analysis to study load transfer since the 1970s (Hammons and Ioannides Citation1997). The first programs were heavily based on Westergaard’s theory by assuming a 2-dimensional medium-thick plate resting on a Winkler foundation, with load transfer modelled as a spring constant. Later programs have used 3-dimensional brick elements to model both foundation layers and concrete slabs, and either beam elements or spring constants for load transfer. The shift to analysis with 3-dimensional brick elements reflects the rapid advancements in computing technology which has made FE analysis the method of choice for rigid pavement research.
Initially, bespoke programs specifically for the load transfer problem were developed, such as ILLI-SLAB, EverFE and FEAFAA (Hammons and Ioannides Citation1997, Davids et al. Citation1998, FAA Citation2016); however, most recent analysis tends to favour the use of general-purpose FE programs such as ADINA, ANSYS, Strand7 FEA and ABAQUS (Sii Citation2015, Zokaei et al. Citation2017, Kim et al. Citation2018, Maaty et al. Citation2018). The use of general-purpose FE programs allows the researcher to develop their own model based on the specifics of their research problem. Consequently, when analysing innovative solutions for joints, the use of a general-purpose FE program is appropriate, however, it is important that any FE model is validated against reliable physical data (Babuska and Oden Citation2004), such as the CC8 test results.
Model development
The objective of the FE model is to simulate the CC8 pavement construction and initial ramp-up loading regime. Once validated, the model will be used for future research to develop innovative joint solutions. The FE model was developed in the general-purpose FE program ABAQUS CAE 2023 (Jamieson and White Citation2024). Key outputs from the model include maximum stress and strain at the bottom of the slabs and maximum deflection at the top of the slabs for calculating LT and LTE. Stresses within the concrete slabs and steel dowels were also checked to determine the potential for material fracture or yield. Additionally, stresses and deflections in the free-edge condition were compared to stresses and deflections in the connected slabs to determine if the free-edge assumptions from Equation 6 and Equation 7 are valid.
Model description
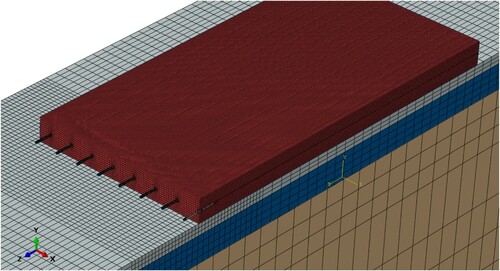
The model comprises a 3 m deep subgrade to represent an infinite depth, under a 356 mm unbound sub-base, under a 152 mm bound sub-base, and under two 305 mm concrete slabs connected by 25 mm diameter steel dowels at 305 mm spacing. This layout represents the instrumented northern longitudinal joints used in the CC8 testing, designated as N2-8, N5-11 and N3-9 (Cary et al. Citation2020). Because the model is symmetric along the X-axis, only half the model was needed, and symmetrical boundary conditions were applied. This reduced the slab size in the X-direction from 4.6 m to 2.3 m. To ensure appropriate calculation of the strain in the free-edge condition, the model was run in two conditions, one with the unloaded slab connected () and another without the unloaded slab ().
Figure 2. Full model showing the plane of symmetry and coordinate system.
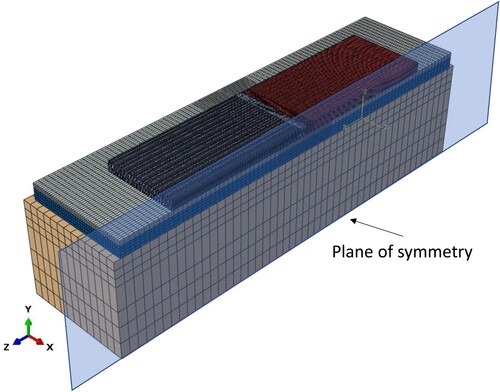
Figure 3. Free-edge condition.
Material modelling
Materials were modelled as brick elements with properties defined in the FAA Airport Pavement Design and Evaluation Advisory Circular AC 150-5320-6G (FAA Citation2021) as shown in , with the exception of concrete, which used an average back-calculated modulus from CC8 testing (Tomlinson et al. Citation2018). All materials were assumed to be elastic and isotropic, with no plastic deformation expected to occur during the simulation.
Table 2. Material properties.
Modelling of interfaces
The interface properties between each model instance are shown in . To accurately represent the no-slip condition of sub-base layers, a rough friction value was used, with no separation allowed between the surfaces. Current rigid pavement design programs assume a frictionless surface between slab and sub-base, and construction specification typically includes a debonding layer between the slab and sub-base to prevent the two materials interlocking (Jamieson and White Citation2021). However, it has been demonstrated that a partial bond will still exist (Tarr et al. Citation1999). Consequently, an almost frictionless Coulomb friction coefficient of 0.05 was applied, and separation was allowed to prevent the sub-base and concrete behaving as a bonded surface. A Coulomb friction coefficient of 0.6 was used between the slabs to represent an interaction between two formed concrete faces (PCI Citation2010). Dowel-concrete interaction had two friction coefficients, one to represent the dowel being cast into the concrete and therefore bonded, the other to represent increased slip due to the application of a debonding treatment. These values were based on previous work completed by Shoukry et al. (Citation2003), who characterised friction coefficients of steel dowel bars in uncoated and coated states through pull-out tests.
Table 3. Interface properties.
Meshing the model
Concrete slabs, steel dowels and sub-layers were all meshed using eight-node linear brick elements with reduced integration and hourglass control (C3D8R). Reduced integration elements were used to minimise the effect of shear locking when subject to bending loads (Dassault Systemes Citation2023b). Sweep methods using the medial axis were used to mesh both the concrete slabs and steel dowels to ensure an even distribution of elements around circular features.
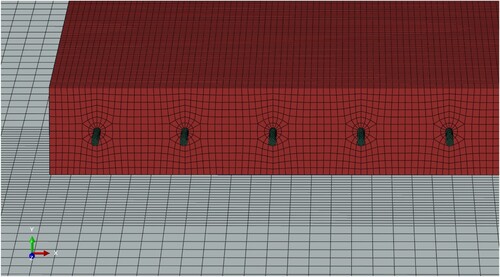
Because the stresses experienced around the dowels, at the slab-slab interface, and under the aircraft wheel loads are the highest, these areas were meshed more finely as shown in . Previous convergence studies for a similar model under road traffic determined that mesh size of 40 mm obtained a suitable relative error (Lopez et al. Citation2020). To ensure the accuracy of this model, an approximate global mesh size of 22 mm was applied to concrete slabs, and 12 mm for the dowels, which was demonstrated by an earlier mesh convergence study to provide acceptable accuracy (Jamieson and White Citation2024). Smaller mesh sizes will lead to more accurate results but can increase computational times significantly. Consequently, for areas of less interest such as sub-layers, and areas away from the joint, a coarser mesh was employed.
Figure 4. The meshing of the model (Jamieson and White Citation2024).
Boundary conditions
To simulate the infinite depth of the subgrade, a fixed support was applied to the bottom surface of the subgrade layer. Roller supports were applied to each sublayer vertical face to represent the continuity of the material in the X-Z plane. As discussed earlier, boundary conditions were applied for a plane of symmetry along the X-axis, to significantly reduce computational effort. The concrete slabs were allowed to move in both X and Z directions to simulate natural expansion and contraction during daily temperature cycles, however, the far edges were constrained in translation in the Y-axis to represent a partial constraint provided by adjacent doweled construction joints. Previous research demonstrated that because the boundary edges are a sufficient distance from the load, the computed stresses between models with unconstrained boundaries and constrained boundaries are relatively small (Brill Citation1998).
Aircraft loads
Because the original Westergaard principles and current design assumptions are based on static loading, and static loadings are more critical than dynamic loading (Ahlvin Citation1991), only static loadings were considered for this model. Wheel loads were modelled as a rectangular pressure load with a tyre pressure of 1.517 MPa, simulating the nominal pressure of the NAPTF test vehicle. The size of the rectangular load was calculated using the Portland Cement Association technique with an area of 0.8721L by 0.6L where L is calculated using Equation 8 (Brill Citation1998). The rectangular pressure load provides a reasonable approximation to the elliptical load used to develop earlier FAA design charts (FAA Citation2021), and has the benefit of being easily applied to the native mesh of the concrete element.
(8)
(8) where, L = Equivalent elliptical tire length (m); AC = Tire contact area (m2), calculated by wheel load divided by tyre pressure.
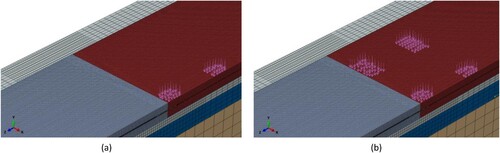
Wheel loads were applied to the edge of one slab to maximise the concrete stress, as shown in . Loads were applied in 2267 kg (5000 lb) increments from 22,679 kg (50,000 lbs) to 31,751 kg (70,000 lbs) to for both D- and 3D-gear configurations in the transverse direction to match the CC8 ramp-up testing.
Figure 5. Wheel loads for (a) D-gear and (b) 3D-gear, across the plane of symmetry.
Results
Typical model output is shown in , with a deformation scale of 100 applied to highlight areas of highest strain and deformation. Values for calculation of LT, LTσ and LTEσ were identified as the elements at the bottom of the slabs with the highest tensile stress (and corresponding strain) along the X-direction, aligning with design assumptions of rigid pavements, with results presented in . For D-gears, these elements were directly below the wheel load closest to the joint. For 3D-gears, the elements selected were directly below the central wheel load closest to the joint. In both cases, the position aligned with the plane of symmetry, minimising any effects from slab edge boundary conditions perpendicular to the joint. Of note in is the increased tensile strain, and therefore stress, at multiple elements in the vicinity of the dowel-concrete interface at the joint face, which exceeded the tensile strength of typical airport concrete (4.8 MPa) (White and Johnson Citation2021, White and Jamieson Citation2024).
Figure 6. Typical results showing elements used for load transfer calculations.
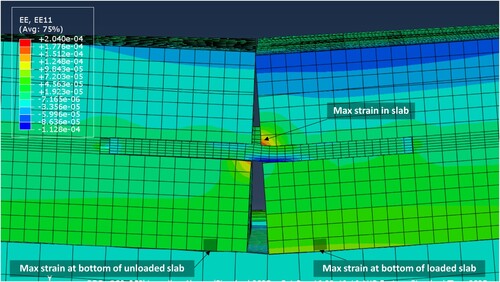
Table 4. Model results for maximum X-direction tensile stress and corresponding strain at bottom of slab.
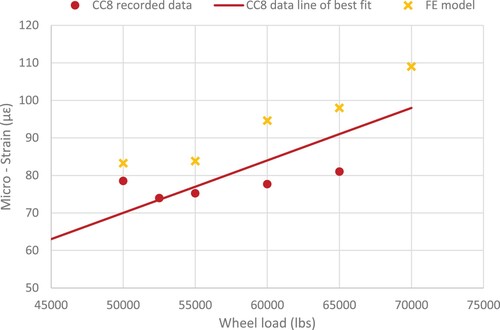
shows the maximum recorded tensile strain for the CC8 D-gear configuration ramp-up testing and the zero-intercept line of best fit, against results recorded from the FE model. The FE results for this chart specifically used strains from elements 25 mm above the slab-to-sub-base interface to replicate the position of the embedded strain gauges used in the CC8 test slabs. No physical CC8 results were available for 3D-gear loads, preventing their comparison to the model value.
Figure 7. CC8 maximum strain against FE model maximum strain.
The model calculated LTσ and LTEσ values are compared to the values measured for the three longitudinal doweled-construction joints from CC8 (N2-8, N5-11 and N3-9) in . Both D- and 3D-gear configurations are included. Furthermore, shows the comparison between FE model results for LT, calculated from the free-edge and two-slab model (Equation 4), and LTσ calculated using only the two-slab model (Equation 5). These comparisons form the basis of the 3-dimensional FE model validation.
Figure 8. Stress-based LTσ for D-gear loading.
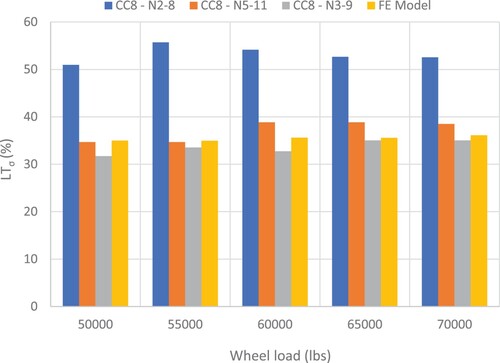
Figure 9. LTEσ for D-gear loading.
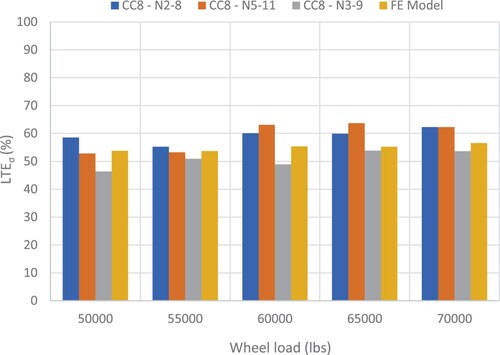
Figure 10. Stress-based LTσ for 3D-gear loading.
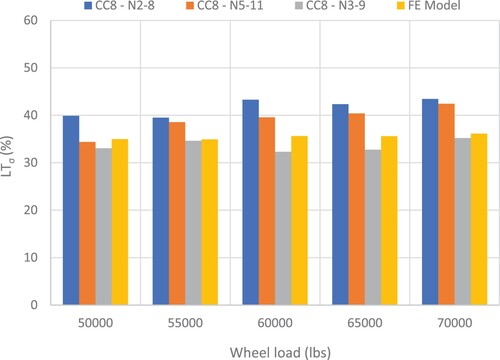
Figure 11. LTEσ for 3D-gear loading.
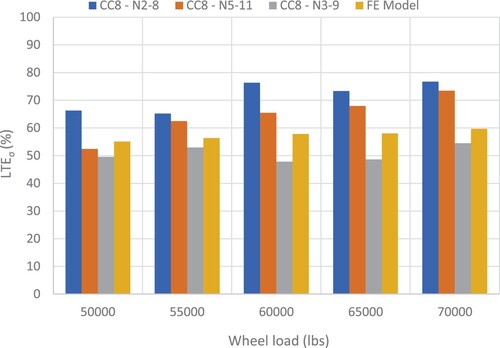
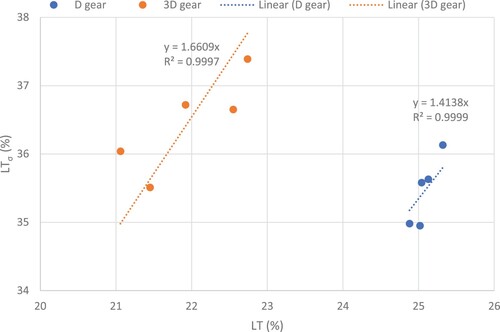
Figure 12. Comparison of LT to stress-based LTσ for D- and 3D-gear loadings from FE model.
Discussion
Results for the best-fit line for micro-strain from D-gear loadings against FE model results show a good agreement in trend direction (). However, for all load increments, the FE model over-predicted the micro-strain by a range of 8.9%–18.9%, with a mean off 11.9%. The difference is likely due to the position of the strain gauge in the CC8 test slabs and the simplification of the FE model for material characterisation and load distribution.
FE model results for LTσ against both gear configurations were in strong agreement with results from CC8 testing ( and ). For D-gears, CC8 results ranged from 31.7% to 55.7% depending on load and joint, with FE model results ranging from 35.0% to 36.1%. For 3D-gears, CC8 results ranged from 32.3% to 43.5%, with FE model results ranging from 35.5% to 37.9%. Evident is the insensitivity of LTσ to load magnitude. However, there was a slight increase in LTσ for 3D-gears compared to D-gears, implying that wheel configuration may affect load transfer ability. Further research is required to determine the significance of wheel configuration on load transfer values. CC8 joint N2-8 had a relatively high LTσ compared to all other joints, which is evidence of the stochastic and variable nature of load transfer per joint.
Like LTσ, results for LTEσ showed strong agreement between the CC8 testing and the FE model ( and ). The FE model results were relatively consistent within the range of 53.8%–56.6% for D-gears at all load magnitudes. This was within the range of CC8 testing of 46.4%–62.3%. Similarly, the FE model 3D-gear results were also within the range of CC8 test results.
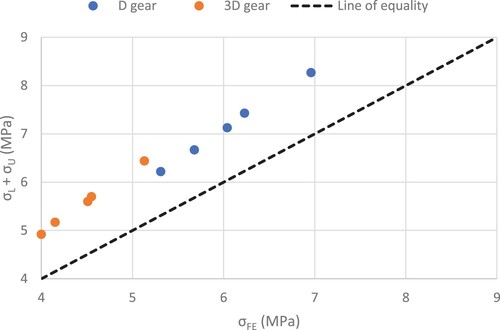
shows a large disparity between the first-principles calculated LT, using Equation 4, and the approximated LTσ, calculated from Equation 5. As discussed earlier, LTσ is equivalent to LT when assuming the summation of the unloaded slab stress or deflection and loaded slab stress or deflection equals the stress or deflection of the slab in the free-edge condition. Consequently, to check this assumption, the free-edge deflection and stress were plotted against the loaded and unloaded slab deflection and stress as shown in and . Values for deflection were recorded for nodes at the top of the slabs that experienced the largest vertical deflection along the joint edge. As with the results for stress and strain, the position of these nodes aligned with the plane of symmetry. If the assumption was valid, all data points should fall on the line of equality. In contrast, the loaded and unloaded slab deflection was found to be on average 66% greater than the free-edge deflection, and the loaded and unloaded slab stress was found to be on average 20% greater than free-edge stress values. This indicates that LTσ is not a good approximation for LT without an appropriate transform function. As shown in , the relationship between LT and LTσ is also related to gear configuration, with LTσ being approximately 41% and 66% higher than LT for D-gears and 3D-gears, respectively, assuming the relationships have a zero-intercept. Of interest, is that although CC8 testing found that the 25% LT design allowance was exceeded, when using free-edge calculations, the 25% design allowance was only achieved for D-gears. Further research is recommended to determine what other variables influence this relationship, and if the relationship is consistent amongst a variety of joint types.
Figure 13. Free-edge deflection versus loaded and unloaded deflection.
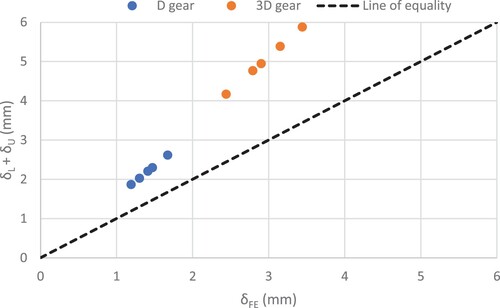
Figure 14. Free-edge stress versus unloaded and loaded stress.
Finally, the FE model indicated that the concrete around the dowels nearest the applied loads experienced tensile stress greater than the tensile strength of typical airport concrete. This phenomenon was previously reported in FE modelling by Mackiewicz (Citation2015) and laboratory testing by Zuzulova et al. (Citation2020). This anomaly may be caused by excessive tangential restraint of the dowel pulling on the concrete. Previous research determined that these high tensile stresses at the concrete-dowel interface are proportional to the magnitude of the concrete-dowel friction coefficient (Saxena et al. Citation2009). Because the stress exceeds the tensile capacity of the concrete, there is the potential for microcracking, which may be a secondary cause of dowel looseness. Further research is required to better understand this observation.
Summary and conclusions
A load transfer FE model was developed in ABAQUS CAE 2023 to replicate construction and ramp-up loading pavement response from CC8 testing at the NAPTF. Results showed that the FE model over-predicted strains by 11.9%, however, the results followed the expected trends and were generally consistent. Furthermore, the values for LTσ and LTEσ from the FE model showed good agreement with results from CC8 testing. Consequently, it was concluded that the developed model is sound and can be used for further aircraft pavement joint research including analysis of innovative joint solutions, which can be included in future rigid pavement thickness design methods. The modelling also found a disparity between the equivalence of LTσ and LT, due to the assumptions for free edge stress and free edge deflection not being satisfied. It is recommended that the relationship between these two values be further investigated for a range of joints and conditions.
Disclosure statement
No potential conflict of interest was reported by the authors.
References
- AAA, 2017. Airport practice note 12 - airfield pavement essentials. Australia: Australian Airports Association.
- ACPA, 2010. R&T update concrete pavement research and technology - #10.01. American Concrete Pavement Association. ed. Skokie, IL: ACPA.
- Ahlvin, R.G., 1991. Origins of developments for structral design of pavements, technical report GI-91-26. Washington, DC: US Army Corps of Engineers.
- Ahmed, M., et al., 2021. Evaluation of concrete pavement joint performance at the FAA National Airport Pavement Test Facility. 12th International Conference on Concrete Pavements. Virtual Conference.
- Babuska, I. and Oden, J.T., 2004. Verification and validation in computational engineering and science: basic concepts. Computer Methods in Applied Mechanics and Engineering, 193, 4057–4066.
- Brill, D.R., 1998. Development of advanced computational models for airport pavement design. Washington, DC: Federal Aviation Administration.
- Brill, D.R. and Kawa, I., 2017. Advances in FAA pavement thickness design software: FAARFIELD 1.41. International Conference on Highway Pavements and Airfield Technology. Philadelphia, PA.
- Byrum, C.R., 2011a. Report IPRF-01-G-002-05-2 joint load transfer in concrete airfield pavements: appendix B: literature review summary. Rosemont: Innovative Pavement Research Foundation.
- Byrum, C.R., 2011b. Report IPRF-01-G-002-05-2 joint load transfer in concrete airfield pavements: final report. Rosemont: Innovative Pavement Research Foundation.
- Cary, C., Ahmed, M., and Yin, H., 2020. 005 NAPTF Support Deliverable 4.9.2.5: CC8 Phase 3 Joint Comparison Traffic Test Report. United States: General Dynamics Information Technology.
- Colley, B.E. and Humphrey, H.A., 1967. Aggregate interlock at joints in concrete pavements. Highway Research Record, 189, 1–18.
- Dassault Systemes, 2023a. Abaqus CAE 2023 [software].
- Dassault Systemes, 2023b. ABAQUS SIMULIA User Assistance online manual.
- Davids, W.G., Turkiyyah, G., and Mahoney, J.P, 1998. EverFE: rigid pavement three-dimensional finite element analysis tool. Transportation Research Record, 1629 (1), 41–49.
- FAA, 2016. FEAFAA 2.11 (Finite Element Analysis - FAA) [software]. Washington, DC: Federal Aviation Administration.
- FAA, 2021. AC 150/5320-6G - airport pavement design and evaluation. Washington, DC: Federal Aviation Administration.
- Gkyrtis, K., et al., 2021. Structural performance assessment of airfield concrete pavements based on field and laboratory data. Infrastructures, 6, 173.
- Hammons, M.I. and Ioannides, A.M., 1997. Advanced pavement design: finite element modeling for rigid pavement joints. report 1: background investigation. Washington, DC: U.S. Department of Transportation Federal Aviation Administration.
- Huang, Y.H., 1993. Pavement analysis and design. New Jersey: Prentice-Hall.
- Hutchinson, R.L., 1966. Miscellaneous paper No. 5-7. basis for rigid pavement design for military airfields. Cinicnnati: US Army Corps of Engineers.
- Jamieson, S. and White, G., 2021. Defining Australian rigid aircraft pavement design and detailing practice. ASCE International Airfield and Highway Pavements Conference 2021. Virtual Conference.
- Jamieson, S. and White, G., 2023. Review of rigid aircraft pavement joint types, effectiveness, distress, Maintenance and Analysis. International Airfield & Highway Pavment Conference. Austin, Texas, USA.
- Jamieson, S. and White, G., 2024. Developing a thoeritical Model for Load Transfer of Common Joints in Rigid Airport Pavements. 13th International Conference on Concrete Pavements. Minneapolis, USA. Article-in-press.
- Jensen, E.A., 2002. Investigation of cracking process and aggregate interlock properties of JPCP cracks. Thesis (Doctor of Philosphy (Civil Engineering)). Univeristy of Michigan.
- Kim, K., et al., 2018. Effect of dowel bar arrangements on performance of jointed plain concrete pavement (JPCP). International Journal of Concrete Structures and Materials, 12, 39.
- Liu, G.R. and Quek, S.S., 2003. The finite element method: a practical course. Oxford, UK: Butterworth-Heinemann.
- Lopez, F.M.H., et al., 2020. 3D-FE of jointed plain concrete pavement over continuum elastic foundation to obtain the edge stress. Revista de la Construccion, 19 (1), 5–18.
- Maaty, A., et al., 2018. Characteristics of jointed rigid airfield pavement using different material parameters and modelling techniques. Sustainable Civil Infrastructures, 66–84.
- Mackiewicz, P., 2015. Finite-Element analysis of stress concentration around dowel bars in jointed plain concrete pavement. Journal of Transportation Engineering, 141 (6), 06015001-1–06015001-8.
- MOD, UK, 2011. Design & maintenance guide 27 - a guide to airfield pavement design and evaluation. United Kingdom: Construction Support Team, Defence Estates, Ministry of Defence.
- PCI, 2010. PCI Design Handbook - 7th Edition. Precast and Prestressed Concrete. Chicago: Precast/Prestressed Concrete Institute.
- Pradena, M. and Houben, L., 2018. Load transfer - crack width relation of non-dowelled jointed plain concrete short slabs. The Baltic Journal of Road and Bridge Engineering, 13 (1), 40–45.
- Saxena, P., et al., 2009. Laboratory and finite element evaluation of joint lockup. Transportation Research Record, 2095, 34–42.
- Shoukry, S.N., et al., 2003. Effect of bonding force on stresses in concrete slabs. Morgantown, WV: West Virginia Department of Transportation, and Mid Atlantic Universities Transportation Center.
- Sii, H.B., 2015. Three-dimensional finite element analysis of concrete pavement on weak foundation. Thesis (PhD). Griffith University.
- Tarr, S.M., et al., 1999. Bond interaction between concrete pavement and lean concrete base. Transportation Research Record, 1668, 9–16.
- TCS, 2016. Technical report 34: concrete industrial ground floors - fourth edition. Surrey, UK: The Concrete Society.
- Tomlinson, C., et al., 2018. Construction cycle 8 (CC8) Construction Report. Atlantic City, United States.
- White, G., 2018. Use of falling weight deflectometer for airport pavements. 5th GeoChina International Conference. HangZhou, China.
- White, G. and Jamieson, S, 2024. Analysis of the practical impact of mixing pavement thickness design methods: Study on rigid aircraft pavement concrete strength in Australia. Journal of Transportation Engineering Part B: Pavements, 150 (2), 04024007-1–04024007-11.
- White, G. and Johnson, M., 2021. Investigating alternates to flexural beams for airport concrete strength compliance. 12th International Conference on Concrete Pavements. Virtual Conference.
- Zokaei, M., Fakhri, M., and Rahiminezhad, S., 2017. A parametric study of jointed plain concrete pavement using finite element modeling. Modern Applied Science, 11, 75.
- Zuzulova, A., Grosek, J., and Janku, M., 2020. Experimental laboratory testing on behavior of dowels in concrete pavements. Materials, 13 (10), 2343.