
 ?Mathematical formulae have been encoded as MathML and are displayed in this HTML version using MathJax in order to improve their display. Uncheck the box to turn MathJax off. This feature requires Javascript. Click on a formula to zoom.
Abstract
The ability of a lubricant to reduce friction and increase machine efficiency is one of its main functions. However, a standardized test to measure the ability of a lubricant to reduce friction does not exist. In this work we take a common tribometer and design a test sequence to allow the friction reduction of any lubricant to be measured and rated, quickly and accurately. The kinematic viscosity values at 40 and 100 °C for the lubricant, along with the density, are used to calculate appropriate entrainment speeds to maintain a constant test severity for each lubricant. A set sliding distance is determined experimentally to ensure that the metal surfaces are run in and that a stable tribofilm is formed at both temperatures. The lubricants are then rated in terms of their ability to maintain low friction in the boundary, mixed, and full film regimes. The proposed method has been designed ensuring good repeatability, across a range of common lubricants (engine oils, transmission fluids, hydraulic fluids, gear oils). This new method simplifies friction measurement and rating of lubricants using Stribeck curves, supporting the development and qualification of new lubricants.
Introduction
The rating of lubricants using physical and mechanical tests is important to ensure performance in the field. Currently, lubricant performance is evaluated using standardized tests for viscometrics (Citation1–3), load carrying capacity/scuffing (Citation4–6), wear (Citation7, Citation8), and micropitting (Citation9). Although one of the main functions of a lubricant is to reduce friction between opposing metal parts, a standardized method of rating a lubricant in this metric does not currently exist. Such a method would be useful for lubricant formulators, their managers, and possibly even end users, as a simple metric on which to compare oils in terms of their ability to reduce friction. Most lubricants are compared by their ability to reduce friction across the entire lubrication regime using “Stribeck” curves (Citation10), where friction is plotted against entrainment speed. Such plots are extremely useful to those who are experienced in their analysis and manipulation but can appear more complicated to those less informed on tribology, especially when comparing lubricants with differing viscosities. The method proposed here uses a rating system, where the rating is determined by analyzing the performance of the lubricant in the nominal boundary, mixed, and elastohydrodynamic (EHD) regimes. A rating number can then be applied, simplifying comparisons between lubricants.
It is surprising that a standardized method to rate lubricants in terms of their friction reduction is not commonly used or reported. Standardized methods for evaluating the friction of lubricants include the four-ball method (Citation11) and the pin-on-disk method (Citation12), neither of which is commonly used in lubricant research and development. Stribeck curves are currently used extensively to compare the friction reduction due to lubrication effects visually (e.g., 13–15). These studies use differing equipment, metal test samples and test conditions, making comparisons across studies difficult and inaccurate. No studies could be found where a rating system is used based on friction reduction by a lubricant, but a “friction index” was used by Taylor and Spikes (Citation16) to analyze the friction increase due to a ZnDDP oil compared to a reference base oil blend. This method used the summation of friction coefficient values across a speed range.
In the design of the new test method some important points must be addressed. The first is the selection of a relevant run-in step. During most lubricant tests a run-in step is used, followed by an evaluation step. The run-in step is used at the beginning of a mechanical test method to perform two functions; the first is to remove any large asperities on the contacting surface, effectively reducing the surface roughness. The asperities are removed through plastic deformation and wear. Second, the run-in is used to allow time for any surface-active additives to adsorb onto the surface or decompose, forming tribofilms. When lubricants with different viscosities are evaluated in the same test method the severity of this run-in will also change (at a constant speed, temperature, and contact pressure). This will result in a run-in step where the contacting surfaces will experience a differing contact severity, resulting in different surface roughness changes and chemical additive reaction rates. In the method proposed here a constant contact severity is achieved by setting a constant lubricant film thickness for the test. This is done in practice by determining the viscosity of the oil being tested and adjusting the entrainment speeds of the test specimens, to maintain a constant film thickness. The time of the step is also adjusted for a constant sliding distance, giving all the lubricants equal contact cycles in which to run in the surfaces and form a tribofilm.
There have been many studies that have also used a constant film thickness during the run-in of the contacting surfaces. This technique is used, for example, in fatigue testing, where the film thickness is set to control the failure of a surface with either spalling (λ > 3), micropitting (λ < 3), or more recently white etching cracks (λ < 3). These studies use lubricants of the same or similar viscosity, and it is common to use tailored lubricants with a much lower viscosity base oil to decrease the film thickness and decrease the time of the test (Citation17).
The second important consideration is the formation of repeatable tribofilms. During the combination of metal–metal rubbing and a temperature of 100 °C, most oils containing chemical additives will form a tribofilm (Citation18). These tribofilms can vary in their morphology, thickness, and strength. Lubricants containing ZnDDP and overbased detergents generally form tribofilms that are considered “rough,” with approximately 120 nm average thickness (Citation19). Lubricants containing ashless (Zn-free) type antiwear additives form tribofilms that are considered “smooth” and thinner, at around ∼20 nm in thickness (Citation20). Antiwear additives are used here as examples as they are the most dominant in the control of the nature of a tribofilm, but it is also known that other additives can influence the tribofilm. For example, friction modifier type additives are known to “smooth” the ZnDDP tribofilm (Citation16, Citation21). EP agents are known to be slightly corrosive to steel surfaces and can promote corrosive–adhesive wear in tests operating in the boundary and mixed regimes. Thus, this run-in step should take into account the likely action of common lubricants, and allow time for the tribofilm to form and stabilize. The selection of a broad range of lubricants will ensure that this experiment can account for the most likely action of common chemical additives.
This test method was designed by evaluating the lubricants at two temperatures: 40 and 100 °C. This is the most practical, as lubricant viscosity values at these two temperatures are available in most lubricant laboratories. The proposed test method will have four steps:
Run-in at 40 °C.
Stribeck curve at 40 °C.
Run-in at 100 °C.
Stribeck curve at 100 °C.
The film thickness and sliding distance at each run-in step must be determined. This will be a trade-off between the severity and the duration of the test method. If the test is too severe it could lead to a very fast run-in process on the surfaces and rapid tribofilm formation but could also lead to high wear of the surfaces. The test would then be variable, as differing lubricants would have different wear rates and wear mechanisms, changing the contact pressure throughout the test. If the test is too mild, little wear would be expected but the run-in processes and the rate of tribofilm formation will be slow, leading to a longer test duration. Therefore, the following conditions are required for the run-in steps:
Ensure the tribofilm is stable.
Friction (Stribeck curves) are stable and repeatable.
Low wear on the metal surfaces.
The entire duration of the test must also be reasonable, ideally allowing the evaluation of two or three oils in a day. This is similar to other tribology tests currently in use on bench top instruments.
Test equipment
A mini-traction machine (MTM) (Citation22) is employed in this study and is shown schematically in . A ball is loaded and rotated against the flat surface of a rotating disk, with both bodies being driven independently. The ball shaft is angled to produce nominally zero spin in the contact. A load cell is attached to the ball shaft bearing housing to provide a measurement of friction force. The disk is immersed in lubricant held at a controlled temperature. The MTM is a fully computer-controlled device, and it is possible to vary the load, the temperature, and the rotational speed of both ball and disk while monitoring friction over a programmed test sequence. This type of ball-on-disk tribometer configuration has been in use for several decades. There are currently multiple commercial manufacturers of equipment that can provide the test conditions utilized in this article.
Figure 1. Mini traction machine schematic.
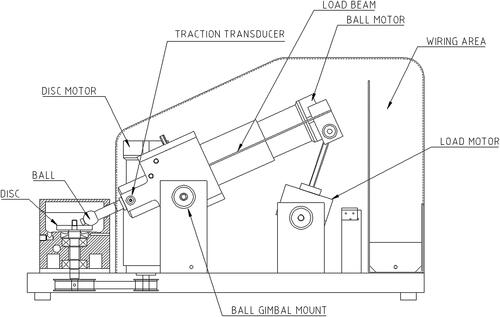
A 3/4-inch ball (19.05 mm diameter) is loaded against a 46-mm outer diameter disk. Both are manufactured from AISI 52100 and through hardened. The balls are designated ISO 3290 grade 10, with a nominal roughness of below 0.02 µm Ra. The measured roughness was found to be between 0.0067 to 0.0096 µm Ra for the balls, by analyzing a random sample of 10 from a production batch. The disks are manufactured from a bar, being turned, hardened, ground, and polished, to achieve a mirror finish on the contacting surface. The surface roughness of the disks was found to be between 0.0054 and 0.0069 µm Ra, measured on 10 random parts from a production batch.
In this work we define the lambda ratio as
[1]
[1]
where the composite surface roughness is given by EquationEq. [2]
[2]
[2] ,
[2]
[2]
and σ1 and σ2 are the average Ra roughness of the ball and disk, respectively. The σ* used in the development of this method was 0.0195 μm.
Principles of test method
As this test method aims to achieve test severity parity across the common lubricant viscosity grades, a defined film thickness must be set for the run-in steps. This is achieved by adjusting the test specimen entrainment speed. To calculate the required entrainment speeds, a rearranged Dowson and Hamrock (Citation23) film thickness equation is used. The Dowson and Hamrock equation for minimum film thickness of non-conformal contacts is given in EquationEq. [3][3]
[3] :
[3]
[3]
where hmin is the minimum film thickness, R′ the reduced radius of curvature in the direction of rolling, U the entrainment speed, η0 the lubricant dynamic viscosity at atmospheric pressure, E’ the reduced Young’s modulus, and k the ellipticity parameter, 1.0339 (for a point contact).
The hmin equation is used as it defines the thinnest part of the lubricant film separating the two surfaces, which controls the running-in processes and the tribofilm formation.
Here we rearrange for speed (U), giving EquationEq. [4][4]
[4] :
[4]
[4]
To simplify EquationEq. [4][4]
[4] , a material parameter (M) for the experiment is calculated using EquationEq. [5]
[5]
[5] :
[5]
[5]
where R′ = 0.0047625 (m), E′ = 2.23 x 10¹¹ (Pa), and W = 37 N. M is then found to be 132.4 for our experimental setup.
Both ball and disk have an elastic modulus of 2.07 1011 N/m2 and a Poisson’s ratio of 0.293. The reduced elastic modulus (E′) is calculated from EquationEq. [6]
[6]
[6] ,
[6]
[6]
The reduced radius (R′) is calculated using the radius of the ball and EquationEq. [7][7]
[7] ,
[7]
[7]
where
is the radius of the ball (9.525 mm).
Finally, entrainment speed is calculated using EquationEq. [8][8]
[8] , combining EquationEq. [4]
[4]
[4] with the material parameter (EquationEq. [5]
[5]
[5] ):
[8]
[8]
By defining a film thickness (hmin) for the run-in step, the required speed can be calculated with knowledge of the viscosity (η0) and pressure viscosity coefficient (α). The pressure viscosity coefficient is not measured frequently, so for this study we estimate the value using the So and Klaus equation (24), given in EquationEq. [9][9]
[9] .
[9]
[9]
where
is the pressure–viscosity coefficient (
10−8 m2/N),
is the kinematic viscosity at the temperature of interest (cSt), b is the ASTM slope of the lubricant divided by 0.2, and
is density (g/cm3).
The variable b has historically been determined by plotting two measured viscosity values on the viscosity temperature ASTM chart and then measuring the gradient [25]. Here we use the following equation to calculate b:
[10]
[10]
where KV100 and KV40 are the kinematic viscosity of the lubricant at 40 and 100 °C, respectively. Thus, with knowledge of only the kinematic viscosities at 40 and 100 °C along with the oil density, the required speeds and step durations can be calculated.
A slide/roll ratio (SRR) must be selected for the test method. This is normally expressed as a percentage. Users of sliding rolling tribometers will select the most appropriate ratio to emulate the conditions of a particular component of interest. In general, tribology test methods for emulating bearings, gear teeth, and cams will use SRRs of 2, 20, and 50%, respectively. In this method an SRR of 50% is chosen to introduce a high ratio of sliding into the contact, thereby accelerating the run-in procedure and any chemical reactivity and so reducing the time of the test.
An applied load of 37 N is used between the ball and the disk. This gives a maximum Hertzian contact pressure of ∼1 GPa. In each test 35 ml of lubricant is used.
Test method development
Lubricant selection
Fifteen lubricants have been selected for inclusion in this study. These lubricants are the most popular viscosity grades and formulation styles currently used in the industry, including those used in engine oils, transmissions, differentials, and industrial applications (hydraulic and industrial gear boxes). The oils were selected to include a range of formulation styles:
mineral and synthetic base oils;
monograde and multigrade fluids;
those with and without friction modifiers;
those with and without ZnDDP.
shows the details of the oils used in this study, with a brief description, their measured kinematic viscosities at 40 and 100 °C, and their density at 20 °C.
Table 1. Details of the lubricants used in this study, including a short description and their physical properties.
Determine run-in step at 40 °C
A relevant film thickness should be chosen that ensures little wear on the surfaces but still allows any tribofilm to form and stabilize in a reasonable time.
In order to maintain a constant film thickness, oils of different viscosities will have different run-in speeds. Therefore, the sliding distance rather than sliding time must be the same for different oils during the run-in step. This sliding distance must be chosen to allow sufficient time for the surfaces to run in and for any tribofilm to form. A test was conducted in which the instrument alternates between the run-in and Stribeck steps. The Stribeck curves can then be used to determine when the measured friction values have stabilized. Run-in steps were 30 m in sliding distance and Stribeck curves were taken between entrainment speeds of 0.005 and 1 m/s, at an applied load of 37 N, temperature of 40 °C, and 50% SRR. Testing at higher speeds during the Stribeck curve was unnecessary as all the oils used in this study would be expected to operate in the EHD regime below 1 m/s. The entrainment speeds were calculated to achieve a film thickness of 39 nm during the run-in step. This film thickness dictates that the run-in step operates in the mixed lubrication regime (λ 2). A lower film thickness of 22 nm was used in early experiments and was found to produce high wear on the ball and disk surface. These speeds, along with the calculated pressure viscosity coefficients, are shown in .
Table 2. The calculated pressure viscosity coefficients for the lubricants along with the test conditions to achieve a film thickness of 39 nm and a sliding distance of 30 m.
Example results recorded for the oil MTMD007 are shown in . The Stribeck curves move to higher friction values as the sliding distance increases from 30 to 150 m, before stabilizing. This test was repeated for all 15 oils. To simplify the analysis the Stribeck curves were integrated using the trapezium rule, to calculate the area under the curve between speeds of 0.005 and 0.1 m/s. These results showing the variation of the Stribeck curves with sliding distance are shown for all oils in .
Figure 2. Example Stribeck curves at 30-m intervals for MTMD007.
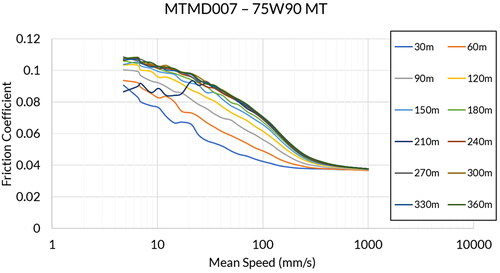
Figure 3. Integrals of the Stribeck curves plotted against sliding distance for all 15 oils at 40 °C.
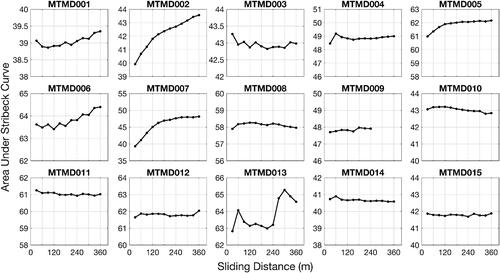
Some oils show a Stribeck curve that increases in friction in the early stages of sliding, before stabilizing (MTMD002, 4, 5, 7, 8). Oils MTMD003, 9, 10, 11, 12, 14, and 15 show relatively stable Stribeck curves, while oils MTMD001, 6, 10, 12, and 13 show the Stribeck curves moving from a stable value at higher sliding distances. From these plots the sliding distance needed to ensure stable Stribeck curves can be estimated. The upper and lower limits of sliding distance for each oil have been estimated from the plots and are shown in .
Table 3. The estimated upper and lower bounds for the Stribeck curves to stabilize in sliding distance at 40 °C.
The suitable sliding distance needed to form a stable Stribeck curve at 40 °C with a film thickness of 39 nm was determined to be 180 m. This is a compromise of allowing sufficient sliding distance (and therefore test time) for the surfaces to run in and a stable tribofilm to form, while also being a reasonable duration to enable a short test time. The 180 m is also below the distance at which some oils showed the friction values deviating later in the test—which is presumably due to some more significant wear processes, and should therefore be avoided to ensure test repeatability.
Determine run-in step at 100 °C
The test conditions (film thickness and sliding distance) should be determined for the run-in step at 100 °C. These will again be a compromise between the duration of the step and the stability of the Stribeck curves. As most oils will form a tribofilm at this temperature, an optical “mapper” system is used to directly view the formation of the tribofilm (Citation26) and judge when it has stabilized. This “mapper” system uses optical interferometry to measure tribofilm formation on the ball surface during the test ().
Figure 4. Schematic diagram showing the operation of the mapper system. (A) The ball is rubbed against the metal disk. (B) Motion is halted and the ball is loaded against the coated glass disk for observation of the tribofilm.
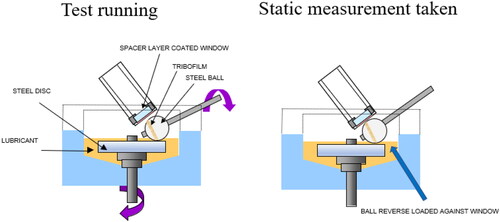
Periodically during the run-in step the motion of the ball and disk is halted. The ball is then loaded against a glass disk. The optical path is shown in .
Figure 5. Optical path of light used to measure tribofilm thickness using optical interferometry.
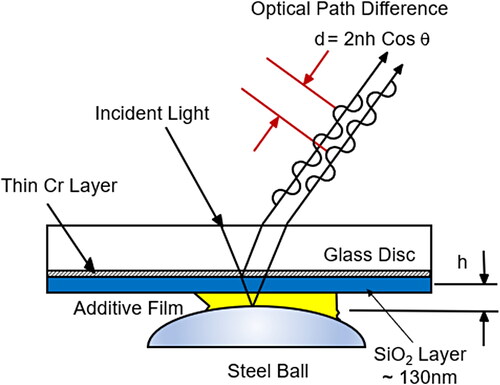
Figure 6. Tribofilm formation at 100 °C.
The glass disk is coated with a chromium and silica layer. The contacting surface (between the steel ball and the coated glass disk) is illuminated with a white light source. A proportion of the light is reflected from the chromium layer on the glass disk, and the remaining proportion is reflected from the steel ball. The reflected light then recombines to form an interference image, that is focused onto the sensor of a 3-CCD prism-based R-G-B (red, green, blue) area scan camera. The tribofilm thickness can then be determined by using the RGB values of each pixel and comparing to a calibrated lookup table of tribofilm thickness versus color intensity. A central circular area on the wear track of the ball is selected and analyzed for each image. The tribofilm thickness values quoted are the average thickness values determined from the pixels in this area.
A film thickness of 19.5 nm has been selected for the run-in step at 100 °C. This corresponds to a nominal λ = 1. This boundary contact is preferable for fast tribofilm formation and simulates the type of contact experienced in many mechanical machines. A film thickness of 11 nm was used in early experiments and found to produce wear on the ball and disk surface. The amended film thickness of 19.5 nm was found to produce little wear in early experiments.
The run-in (Step 1) and Stribeck (Step 2) steps at 40 °C are used before the experimental procedure at 100 °C, without changing the specimens or the oil. shows the conditions used at 40 °C for the run-in steps, along with the speeds used to achieve a film thickness of 19.5 nm at 100 °C and the time for 60 m of sliding.
Table 4. Test conditions used for the run-in step at 40 °C, along with the speeds and sliding distance used in the 100 °C step to observe the formation of the tribofilms.
The test procedure follows the order outlined here:
Step 1: 40 °C run-in.
Film thickness (hmin) = 39 nm (corresponding to a nominal λ = 2).
50% SRR, 37 N load.
Sliding distance = 180 m.
Step 2: 40 °C Stribeck curve.
0.005–1 m/s (descending speed).
50% SRR, 37 N load.
Step 3: 100 °C run-in.
Film thickness (hmin) = 19.5 nm (corresponding to a nominal λ = 1).
50% SRR, 37 N load.
Mapper images every 60 m of sliding distance for a total of 720 m.
Step 4: 100 °C Stribeck curve (720 m).
0.005–3.2 m/s (descending speed).
50% SRR, 37 N load.
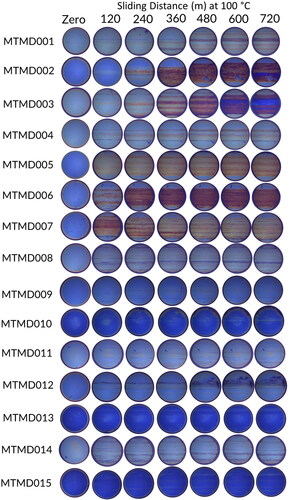
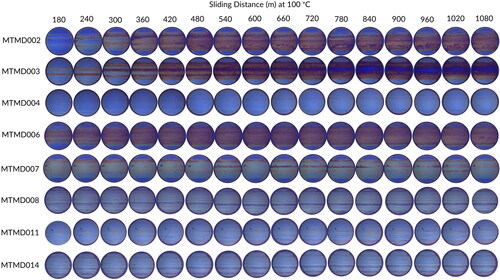
The mapper images from the 100 °C run-in steps are shown in (with every other image omitted).
Figure 7. Measured tribofilm thickness values at 100 °C.
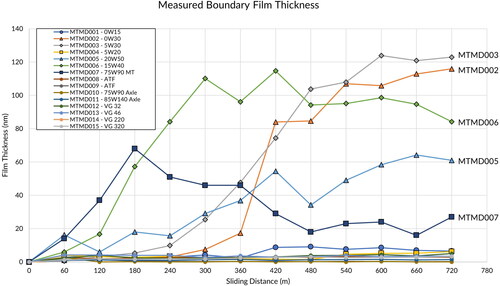
These images show the variation of the thickness and morphology of the tribofilms formed by the different lubricants. MTMD005 has a tribofilm that is relatively homogeneous, whereas MTMD001 and MTMD003 would be considered rougher. The tribofilms appear to have stabilized by 720 m for all the lubricants. The corresponding average film thickness values are given in and the Stribeck curves taken after 720 m of sliding are shown in .
Figure 8. Stribeck curves at 100 °C for all 15 oils after a run-in step at h = 19.5 nm and 720 m of sliding.
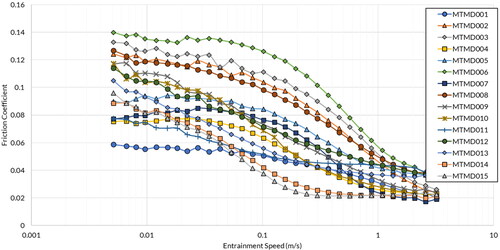
Figure 9. Mapper images of a subset of oils on extended test (to 1080 m of sliding).
To ensure that the tribofilms are stable within this time, a subset of the oils was evaluated using an extended test. The extension was a total sliding distance of 1080 m at 100 °C, with the 40 °C steps remaining unchanged. Stribeck curves are taken at 720 and 1080 m at 100 °C for comparison. The extended test method is detailed here:
Step 1: 40 °C run-in.
Film thickness (h) = 39 nm (corresponding to a nominal λ = 2).
50% SRR, 37 N load.
Sliding distance = 180 m.
Step 2: 40 °C Stribeck curve.
Step 3: 100 °C run-in.
Film thickness (h) = 19.5 nm (corresponding to a nominal λ = 1).
50% SRR, 37 N load.
Mapper images every 60 m of sliding distance for 720 m.
Step 4: 100 °C Stribeck curve (720 m).
Step 5: 100 °C run-in.
Film thickness (h) = 19.5 nm (corresponding to a nominal λ = 1).
50% SRR, 37 N load.
Mapper images every 60 m of sliding distance for 360 m.
Step 6: 100 °C Stribeck curve (1080 m).
The mapper images for the tests are shown in , with the corresponding measured boundary film thickness values shown in .
Figure 10. Measured film thickness over an extended sliding distance for a subset of the oils.
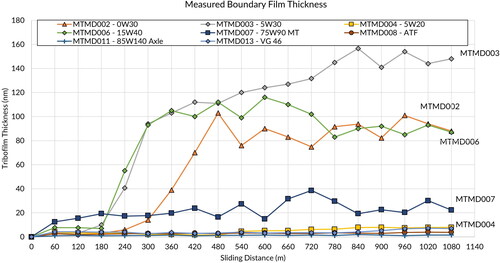
Figure 11. Stribeck curves at 720 m and 1080 m of sliding at 100 °C.
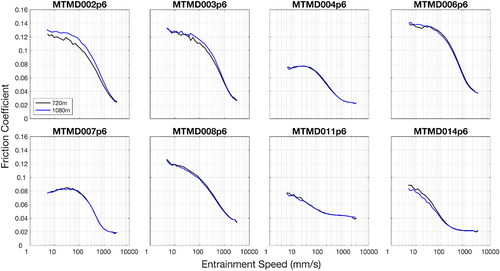
It can be seen that most oils form a tribofilm that is stabilized within the 1080-m sliding distance of the test. The visual appearance of the tribofilm changes very little above about 720 m for most oils. The Stribeck curve measurements taken at 720 m and 1080 m sliding distance are shown in .
Figure 12. Stribeck curves at 100 °C at, 720, 1080, 1440, and 1800 m of sliding, with corresponding mapper images.
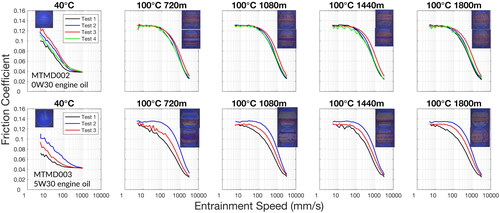
There is very little difference between the measured friction at 720 and 1080 m of sliding for most oils, indicating that most tribofilms will form and be stable by 720 m. Some variation is seen for the oils MTMD002 and MTMD003, which is investigated further in the following.
Tribofilm variability
Lubricants MTMD002 and MTMD003 exhibit greater variability in terms of the friction measured during the Stribeck curves. On closer inspection it appears the tribofilm for both these oils is in a state of flux and does not stabilize within the 1080 m of sliding. Further testing was carried out on these two lubricants, by simply extending the sliding distance to a total of 1800 m. Stribeck curves and mapper images are recorded at 720, 1080, 1440, and 1800 m of sliding. The results for each experiment are shown in .
Figure 13. Stribeck curves at 40 °C for all 15 oils. Where repeat tests have been conducted, these are shown.
It appears that the cause of the frictional variation for these two oils may be the variable nature of the tribofilm being formed. The tribofilm does not stabilize but is continuously removed and is reforming, leading to changes in the boundary film thickness and the measured friction. Extending the sliding distance further is unlikely to result in any improvement to the repeatability. There is also test-to-test variation in the nature of the tribofilm and the measured Stribeck curves. This is especially prominent for lubricant MTMD003. This variation in tribofilm formation and thickness has been observed in previous studies (Citation19).
It was noted that oils MTMD002 and MTMD003 had the thickest tribofilms. It is possible that the enforced lambda ratio of 1 could be hindering the further growth of the film. A brief experiment was conducted for these two oils where the lambda ratio was gradually increased through the run-in stage at 100 °C. The test used a lambda ratio of 1 for 720 m, 1.5 for 360 m, and 2 for 360 m, for a total of 1440 m of sliding at 100 °C. No noticeable improvement was observed in the stability of the tribofilm for oil MTMD002 and MTMD003, so this path of development was not pursued.
Final test method
The final test method is proposed as follows:
Run-in step: 40 °C, h = 39 nm, sliding distance = 180 m, 50% SRR.
Stribeck step: 50% SRR, 0.005–1 m/s.
Run-in step: 100 °C, h = 19.5 nm, sliding distance = 720 m, 50% SRR.
Stribeck step: 50% SRR, entire speed range (0.005–3.2 m/s).
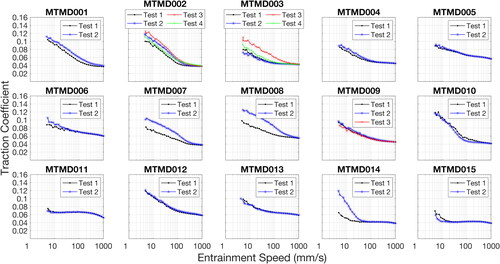
This was deemed to have produced little wear on the steel surfaces, while still allowing a stable tribofilm to be formed and the measured friction forces to have stabilized. The test method has been used to evaluate each of the 15 lubricants. The Stribeck curves at 40 and 100 °C for each lubricant are shown in and , respectively, with at least one repeat test per oil, following the full procedure.
Figure 14. Stribeck curves at 100 °C for all 15 oils. Where repeat tests have been conducted, these are shown.
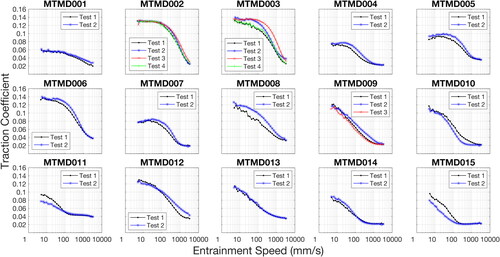
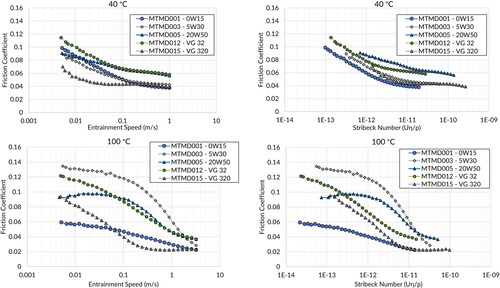
Figure 15. Conversion of the friction/speed results to friction/Stribeck number plot.
Oil rating
The oils must now be rated in terms of their ability to reduce friction in the nominal boundary, mixed, and EHD regimes. This is done by first normalizing the friction/speed curves for viscosity, producing modified Stribeck curves, where the measured friction is plotted against a “Stribeck number” (Citation10). This is given by viscosity (Pa.s) speed (m/s)/contact pressure (Pa). This conversion from speed to Stribeck number is shown in at 40 and 100 °C for a selection of oils. This modification is done so that the friction curves are plotted with approximately equivalent EHD film thickness.
Figure 16. Calculated EHD film thickness at 100 °C, plotted against Stribeck number (Uη/p) for a selection of oils.
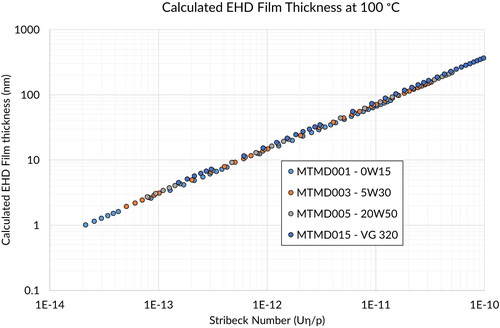
The calculated film thickness for a selection of oils is shown related to the Stribeck number in .
Figure 17. Figures showing the integrals for all oils. This is used to determine the most appropriate limits to be used in the rating system.
At 100 °C a Stribeck number of 1 10−13 corresponds to a film thickness of ∼3 nm, 1
10−12 to a film thickness of ∼14 nm, and 1
10−11 to a film thickness of ∼70 nm. This conversion allows the performance of the lubricants to be compared at a certain theoretical EHD film thickness. The selection of oils shown in does not form a singular curve, as can be observed when doing a similar conversion with base oils of differing viscosity (Citation27) or in bio-tribology experiments (Citation28). This is not surprising, as the changing roughness of the surfaces through run-in or tribofilm formation will affect the lambda ratio and hence the position of lubrication regime transition. The tribofilm formed by the oils containing ZnDDP moves the curve to the right, so higher speeds are required to move from the mixed to the EHD regime (Citation19). This effect is more pronounced for oil MTMD003, where the mixed regime dominates up to Stribeck numbers of 3.2
10−11 (corresponding to a theoretical film thickness of ∼160 nm). When the film thickness is below 14 nm and we expect the boundary lubrication regime to prevail, oils MTMD012 and MTMD015 have a friction coefficient that is still varying with speed, indicative of the mixed lubrication regime. There are two possibilities for this effect. One is that the types of tribofilm formed by these oils have an effect opposite to those of the ZnDDP oils, in which the surfaces are made smoother, extending the mixed regime to lower speeds. Alternatively, a speed dependence of friction in known to exist in the boundary regime (Citation29). Therefore, the contact may still be operating in the boundary regime, but the reduction of friction with speed may be due to the actual nature of the boundary film.
The curves are then split into sections corresponding to the theoretical lubrication regimes. The limits of each section are given in .
Table 5. Stribeck curve limits for boundary, mixed, and EHD regimes
EquationEquations [11][11]
[11] and Equation[12]
[12]
[12] are used to estimate the area under the Stribeck curve at 40 °C, with EquationEqs. [13]
[13]
[13] to Equation[15]
[15]
[15] being used for the Stribeck curves at 100 °C:
[11]
[11]
[12]
[12]
[13]
[13]
[14]
[14]
[15]
[15]
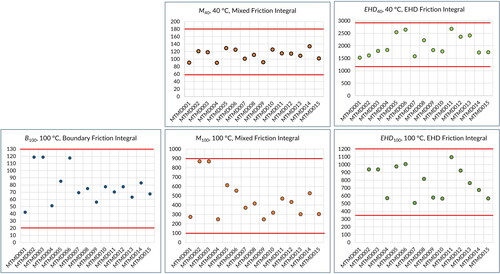
where M40 and EHD40 represent the calculated area under the Stribeck curves for the oils in the mixed and EHD regime, respectively. at 40 °C. B100, M100, and EHD100 are the same for the boundary, mixed, and EHD regimes at 100 °C. The integral is calculated using the trapezium rule (using all included points, with linearly interpolated values at the limits). The raw friction/speed data were improved prior to calculating the area. Linear interpolation was used to improve the number of points available and to standardize the speed values across multiple datasets. The purpose of the interpolation was to both add more points and standardize the x values of data points across multiple curves (as the x values were slightly different between datasets). The average calculated areas for all the oils are shown in .
Figure 18. Rating of the 15 oils in the mixed and EHD regime at 40 °C.
These plots were used to select appropriate limits that can be used in the rating equations. As the oils tested here have a wide range of performance, it is likely that other lubricants will have performance withing this range. The limits are shown in red horizontal lines in and are given in .
Table 6. Integral limits used for calculating the lubricant ratings
These limits are then used in the rating equations:
[16]
[16]
[17]
[17]
[18]
[18]
[19]
[19]
[20]
[20]
where
is the rating in the mixed regime at 40 °C,
is the rating in the EHD regime at 40 °C,
is the rating in the boundary regime at 100 °C,
is the rating in the mixed regime at 100 °C, and
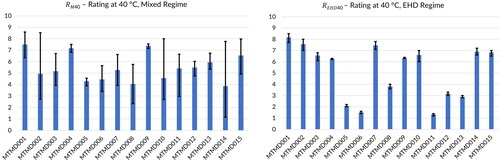
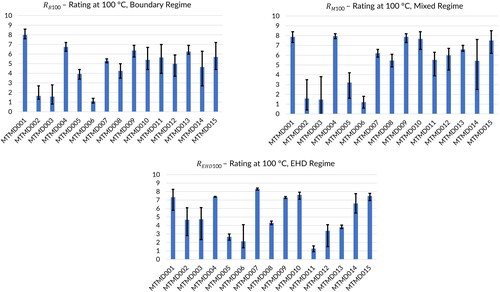
is the rating in the EHD regime at 100 °C. The rating equations produce a value between 0 and 10, where higher values indicate lower friction and better expected machine efficiency in use. The rating of the oils in the mixed and EHD regime at 40 °C are given in . The rating of the oils in the boundary, mixed, and EHD regime at 100 °C are given in . The rating values include the results from at least two different instruments and operators. The position of the bar shows the average rating, whilst the error bars show the range of the results.
Figure 19. Rating of the 15 oils in the boundary, mixed, and EHD regime at 100 °C.
Discussion
A test method has been developed to rate lubricants in terms of their ability to reduce friction. This method has been developed experimentally, with concern for the surface running in, tribofilm formation, and varying viscosity of lubricants. Here we discuss some limitations and possible modifications to the test method.
Rating
The normalizing of the Stribeck curves by using the lubricants viscosity is done to give an indication of measured friction against an approximate EHL film thickness and therefore lubrication regime. This technique is used to give an indication of the friction of the contact across the different lubrication regimes, which is subsequently used for calculating the lubricant’s rating. This method does not consider the thickness and roughness of the tribofilm on the steel surfaces, which will affect the position of the curve. One way to improve this measure would be to use the boundary film thickness and roughness values generated during the test to re-adjust the position of the friction curve (Citation19, Citation27). This would then give a true value of friction over the lubrication regime. It should also be acknowledged that in machines in the field, any tribofilm formed (and its associated change in friction) will have the effect of moving the machine component to different lubrication regimes. Thus, this method of normalizing the Stribeck curve appears valid, and can be related to boundary film effects occurring in machine components.
In practice these ratings can be used to help engineers select the best performing lubricants for their tribological system. For example, if a machine component is known to operate with a film thickness of 50 nm, operating in the nominal mixed regime on a polished surface, the RM100 could be used as a measure to help select the lubricant that is likely to maintain low friction in this component.
Shear rate
The shear rate experienced by the oil in the contact during testing varies due to the varying speeds needed to achieve a set film thickness. Low-viscosity oils will experience the highest shear rates. MTMD001 will experience a shear rate of 1.6 107 s−1, while oil MTMD015 (the most viscous) will experience a shear rate of 1.7
106 s−1. Permanent shear thinning (Citation29) can be expected at these shear rates, but as the contact point is very small and the oil volume relatively large, this effect is not expected to significantly alter the test results.
Method limit
This test method is limited by the speed range achievable on the test instrument. It may not be possible to achieve friction measurements in the EHD region at 100° C (Stribeck numbers of 4 10−11) for the lowest viscosity oils. The highest entrainment speed achievable the MTM instrument is currently 3.2 m/s (with an SRR of 50%), giving a practical limit of this test requiring a viscosity of 3.125
10−3 Pa.s to produce at least one measured point in the EHD region at 100 °C.
Metal surfaces
This test method has been developed using the common bearing steel AISI 52100. As lubricant additives are known to have a performance that is dependent on the steel surface metallurgy (Citation31), this method could be expanded to include other steels and materials. It is expected that the same or a very similar method could be used with different steels. This should be considered an advanced use of this method, or for further method development.
Highly polished surfaces are favored in this method development, as they give the least scatter of friction and wear measurements. The variation of the roughness is also better for highly polished surfaces, reducing test-to-test variation. In real engineered surfaces such as gears, the roughness is considerably higher (0.1–0.5 µm Ra) than for the surfaces used here (0.01 µm Ra). Any run-in processes of the rougher surfaces will include a reduction in the roughness, which can be affected by the chemical additives—the “topographical run-in.” This topographical run-in can be followed by a “tribofilm run-in,” where the tribofilm is formed on the steel surface. This article was mainly concerned with the tribofilm run-in, negating the topographical run-in with the use of very smooth surfaces.
Inlet shear heating
The variation of the speed during the run-in stage may lead to a variation in the expected inlet shear heating, as the sliding contact used can be expected to increase the temperature of the lubricant at the inlet. This would then decrease the film thickness slightly. The flash temperature can be estimated with knowledge of the materials properties, speeds, pressures, and friction coefficient (Citation32). The flash temperatures for a selection of oils during the run-in steps have been estimated and found to be ∼5 °C for MTMD001, ∼4 °C for MTMD004, and ∼1 °C for MTMD015. Currently, it would be difficult to correct for the generated flash temperature without also estimating the friction coefficient in the contact.
Summary
A new lubricant test and rating method has been proposed that rates the ability of lubricants to reduce friction in the main lubrication regimes. This test has been developed with a selection of common lubricants and a commercial sliding/rolling tribometer. This method uses a defined film thickness for run-in steps, to achieve test severity parity, independent of viscosity. Normalized Stribeck curves are used as the main measure, by rating lubricants in terms of their relative ability to reduce friction in the main lubrication regimes. This rating can be controlled through lubricant additive formulation. It is expected that the ratings can be used to simplify the comparison of performance between lubricants and can be used to correlate rig performance to field performance.
Acknowledgements
All authors contributed to the study conception and design. Material preparation, data collection, and analysis were performed by Marc Ingram and Izzy Roots. The first draft of the article was written by Marc Ingram and all authors commented on previous versions of the article. All authors read and approved the final article. The authors declare that no funds, grants, or other support were received during the preparation of this article. The authors report there are no competing interests to declare.
References
- ASTM D445-19a (2019), “Standard Test Method for Kinematic Viscosity of Transparent and Opaque Liquids (and Calculation of Dynamic Viscosity),” ASTM International: West Conshohocken, PA.
- ASTM D4683-20 (2020), “Standard Test Method for Measuring Viscosity of New and Used Engine Oils at High Shear Rate and High Temperature by Tapered Bearing Simulator Viscometer at 150 °C,” ASTM International: West Conshohocken, PA.
- ASTM D4741-20 (2020), “Standard Test Method for Measuring Viscosity at High Temperature and High Shear Rate by Tapered-Plug Viscometer,” ASTM International: West Conshohocken, PA.
- ASTM D2783-19 (2019), “Standard Test Method for Measurement of Extreme-Pressure Properties of Lubricating Fluids (Four-Ball Method),” ASTM International: West Conshohocken, PA.
- ASTM D2782-17 (2017), “Standard Test Method for Measurement of Extreme-Pressure Properties of Lubricating Fluids (Timken Method),” ASTM International: West Conshohocken, PA.
- ASTM D5182-19 (2019), “Standard Test Method for Evaluating the Scuffing Load Capacity of Oils (FZG Visual Method),” ASTM International: West Conshohocken, PA.
- ASTM D2266-01(2015), “Standard Test Method for Wear Preventive Characteristics of Lubricating Grease (Four-Ball Method),” ASTM International: West Conshohocken, PA.
- DIN 51819-1:2016-12 (2016), “Testing of Lubricants—Mechanical-Dynamic Testing in the Roller Bearing Test Apparatus FE8—Part 1: General Working Principles,” Beuth Publishing DIN: Germany.
- ISO/TS 6336-22:2018, “Calculation of Load Capacity of Spur and Helical Gears. Part 22: Calculation of Micropitting Load Capacity,” Geneva, Switzerland (2018).
- Stribeck, R. (1901), “Kugellager für beliebige Belastungen, “Zeitschrift des Vereines deutscher Ingenieure, 45(3), pp 73–79 (pt I) & 45(4), pp 118–125 (pt II).
- ASTM D5183-05(2016), “Standard Test Method for Determination of the Coefficient of Friction of Lubricants Using the Four-Ball Wear Test Machine,” ASTM International: West Conshohocken, PA.
- ASTM G99-17 (2017), “Standard Test Method for Wear Testing With a Pin-on-Disk Apparatus,” ASTM International: West Conshohocken, PA.
- Costello, M. T. (2005), “Effects of Basestock and Additive Chemistry on Traction Testing,” Tribology Letters, 18, pp 91–97. doi:10.1007/s11249-004-1761-z
- Luiz, J. F., and Spikes, H. (2020), “Tribofilm Formation, Friction and Wear-Reducing Properties of Some Phosphorus-Containing Antiwear Additives,” Tribology Letters, 68, p 75. doi:10.1007/s11249-020-01315-8
- Fan, J., Müller, M., Stöhr, T., and Spikes, H. A. (2007), “Reduction of Friction by Functionalised Viscosity Index Improvers,” Tribology Letters, 28, pp 287–298. doi:10.1007/s11249-007-9272-3
- Taylor, L. J., and Spikes, H. A. (2003), “Friction-Enhancing Properties of ZDDP Antiwear Additive: Part I—Friction and Morphology of ZDDP Reaction Films,” Tribology Transactions, 46(3), pp 303–309. doi:http://doi.org/10.1080/10402000308982630
- Rycerz, P., and Kadiric, A. (2019), “The Influence of Slide–Roll Ratio on the Extent of Micropitting Damage in Rolling–Sliding Contacts Pertinent to Gear Applications,” Tribology Letters, 67, p 63. doi:10.1007/s11249-019-1174-7
- Fujita, H., Glovnea, R. P., and Spikes, H. A. (2005), “Study of Zinc Dialkydithiophosphate Antiwear Film Formation and Removal Processes, Part I: Experimental,” Tribology Transactions, 48(4), pp 558–566. doi:http://doi.org/10.1080/05698190500385211
- Dawczyk, J., Morgan, N., Russo, J., and Spikes, H. (2019), “Film Thickness and Friction of ZDDP Tribofilms,” Tribology Letters, 67, p 34. doi:10.1007/s11249-019-1148-9
- Luiz, J. F., and Spikes, H. (2020), “Tribofilm Formation, Friction and Wear-Reducing Properties of Some Phosphorus-Containing Antiwear Additives,” Tribology Letters, 68, p 75. doi:10.1007/s11249-020-01315-8
- Guevremont, J. M., Garelick, K., Loper, J., Lagona, J., Sheets, R., Hux, K., and Devlin, M. T. (2010), “Influence of Friction Modifiers on Boundary Film Formation Properties,” In Proceedings of the 65th STLE Annual Meeting and Exhibition, Las Vegas, NV, USA.
- MTM Instrument, http://www.pcs-instruments.com/product/mtm (accessed 25 April 2022).
- Hamrock, B., and Dowson, D. (1981), Ball Bearing Lubrication, the Elastohydrodynamics of Elliptical Contacts, John Wiley & Sons: New York. ISBN 13: 9780471035534.
- So, B. Y. C., and Klaus, E. E. (1980), “Viscosity–Pressure Correlation of Liquids,” ASLE Transactions, 23(4), pp 409–421. doi:10.1080/05698198008982986
- ASTM D341-20e1 (2020), “Standard Practice for Viscosity-Temperature Equations and Charts for Liquid Petroleum or Hydrocarbon Products,” ASTM International: West Conshohocken, PA.
- Spikes, H. A., and Cann, P. M. (2001), “The Development and Application of the Spacer Layer Imaging Method for Measuring Lubricant Film Thickness,” Proceedings Institute of Mechanical Engineers Part J: Journal of Engineering Tribology, 215(3), pp 261–277. doi:10.1243/1350650011543529
- Vengudusamy, B., Enekes, C., and Spallek, R. (2020), “EHD Friction Properties of ISO VG 320 Gear Oils With Smooth and Rough Surfaces,” Friction, 8, pp 164–181. doi:10.1007/s40544-019-0267-5
- Myant, C., Spikes, H. A., and Stokes, J. R. (2010), “Influence of Load and Elastic Properties on the Rolling and Sliding Friction of Lubricated Compliant Contacts,” Tribology International, 43, pp 55–63. doi:10.1016/j.triboint.2009.04.034
- Campen, S., Green, J., Lamb, G., Atkinson, D., and Spikes, H. (2012), “On the Increase in Boundary Friction with Sliding Speed,” Tribology Letters, 48, pp 237–248. doi:10.1007/s11249-012-0019-4
- Holtzinger, J., Green, J., Lamb, G., Atkinson, D., and Spikes, H. (2012), “New Method of Measuring Permanent Viscosity Loss of Polymer-Containing Lubricants,” Tribology Transactions, 55(5), pp 631–639. doi:10.1080/10402004.2012.688931
- Pagkalis, K., Spikes, H., Jelita Rydel, J. Ingram, M., and Kadiric, A. (2021), “The Influence of Steel Composition on the Formation and Effectiveness of Anti-wear Films in Tribological Contacts,” Tribology Letters, 69, p 75. doi:10.1007/s11249-021-01438-6
- Blok, H. (1937), “Theoretical Study of Temperature Rise at Surfaces of Actual Contact Under Oiliness Lubricating Conditions, General Discussions on Lubrication,” Institute of Mechanical Engineers, 2, pp 222–235.