
ABSTRACT
Steinman A, Abdimalik M, Ogdahl ME, Oudsema M. 2016. Understanding planktonic vs. benthic algal response to manipulation of nutrients and light in a eutrophic lake. Lake Reserve Manage. 32:402–409.
We examined the environmental factors influencing the growth of benthic and planktonic algae in Lake Macatawa, a hypereutrophic lake located in west Michigan. Turbidity may limit planktonic growth in the main body of the lake, despite high P concentrations, whereas shallow water depths in the littoral regions of the lake may allow benthic algal growth. We experimentally amended nutrients to benthic algae using nutrient diffusing substrates near the sediment surface and to phytoplankton using nitrogen (N) and phosphorus (P) spikes into 10 L carboys suspended from a PVC-constructed frame near the water surface to test how nutrient and light regimes influence these potentially competing autotrophic communities. Benthic algae were co-limited by N and P, whereas phytoplankton were P-limited. The N-only treatments resulted in negative algal growth. In addition, microcystin concentration (phytoplankton only) also responded positively to P additions and negatively to N-only treatments. We speculate that much of the P in this lake is bound to sediment and not bioavailable, so despite the high total P concentrations, the algae are P-limited at certain times of the year. Irradiance levels did not seem to be photosynthetically limiting during this study. Our results have management implications: (1) use of TP as an indicator of P limitation may be flawed without concomitant measurement of bioavailable P; and (2) control of external P loading is critical to directly limit phytoplankton abundance but also can result in indirect control of benthic algae if internal P loading from the sediment is a key source of P to this community.
Understanding which resource(s) limits organismal growth and productivity helps managers attain or maintain the desired state of an ecosystem. For algae, the limiting resource usually involves nutrients or light, although space can be limiting, especially in intertidal systems (Lubchenco and Menge Citation1978). The role of light and nutrients is particularly applicable in lentic ecosystems, where photosynthetic organisms compete for these resources across both horizontal and vertical gradients.
The horizontal gradient in lakes extends from the near-shore littoral zone to the open-water pelagic zone. There is increasing recognition that the shallower, near-shore region can account for a substantial, if not dominant, amount of primary production in lakes (Vadeboncoeur et al. Citation2002). Within this zone, benthic algae, planktonic algae, and both submergent and emergent macrophytes compete for nutrients and light (Sand-Jensen and Borum Citation1991, Havens et al. Citation2001, Vadeboncoeur and Steinman Citation2002). Autotrophs located close to the water surface, or that emerge above it, have a competitive advantage for light, which may allow dominance if nutrients in the water column are sufficient to meet metabolic demands. By contrast, those organisms growing at the benthic layer have a competitive advantage at sequestering nutrients diffusing from the sediment (Hansson Citation1990, Lu et al. Citation2016) but may struggle to obtain sufficient light. This competitive interaction along the vertical gradient has resulted in lakes becoming a primary example for regime shifts: the macrophyte/epiphyton-dominated, clear-water phase vs. the phytoplankton-dominated turbid phase (Scheffer and van Nes Citation2007). The outcome of these competing phases has profound management implications because it will influence resource quantity and quality for consumers (Vadeboncoeur et al. Citation2003, Vander Zanden et al. Citation2011) as well as aesthetic and hedonic value (Dodds et al. Citation2008).
Observational studies and associated models have clearly and elegantly shown that eutrophication results in a shift away from benthic primary productivity toward phytoplankton dominance (Vadeboncoeur et al. Citation2003, Genkai-Kato et al. Citation2012), although the influence of nutrients is modulated by lake morphometry (Vadeboncoeur et al. Citation2008). Despite the management implications associated with regime shifts in lakes, relatively few studies have experimentally addressed simultaneous competition between phytoplankton and benthic algae (cf. Havens et al. Citation1996, Blumenshine et al. Citation1997, Romo et al. Citation2007). This lack of research is surprising given the different roles these autotrophic communities play in terms of nutrient dynamics (Blumenshine et al. Citation1997, Havens et al. Citation2001), trophic level interactions (Harrault et al. Citation2014), and lake management concerns (Genkai-Kato et al. Citation2012). Several studies in the arctic region have shown that benthic algae tend to be nutrient replete, presumably because of access to sediment nutrients, whereas nutrient-limited planktonic algae respond positively to nutrient amendments (Bonilla et al. Citation2005, Lougheed et al. Citation2015). As aquatic ecosystems continue to be stressed by excess nutrients, experimental studies can be helpful in understanding the factors and mechanisms underpinning benthic–pelagic interactions.
Lake Macatawa is a hypereutrophic lake located in a highly agricultural watershed in west Michigan. It is characterized by high total phosphorus (TP) concentrations, high sediment loads and associated turbidity, periodic nuisance algal blooms, and hypoxia (Holden Citation2014). Littoral macrophyte growth is sparse, presumably because high turbidity limits transmission of light. We conducted an in situ experiment, utilizing nutrient diffusing substrates (NDS) to simulate nutrient amendments at the near-bottom (low light) and suspended carboys to simulate nutrients amendments (high light) in the near-surface. This experimental design allowed us to simultaneously examine the influence of nutrients and light on algal abundance and potential toxicity. We hypothesized that (1) phytoplankton response would be greater than periphyton response, given the limited light penetration in the lake, and (2) general algal response would be greater to nitrogen (N) addition than phosphorus (P) addition, regardless of habitat, given the historically high P concentrations in the lake.
Materials and methods
Study site
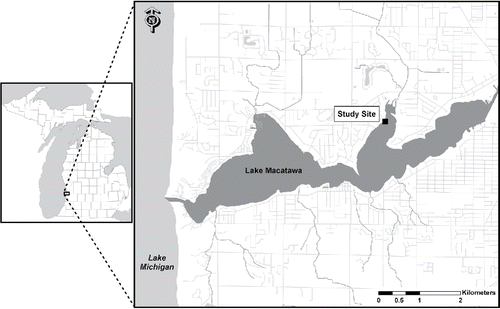
Lake Macatawa is a drowned river mouth lake (a lake formed at riverine/lacustrine interface along the lower stretches of tributary rivers due to the subsequent rise in the Great Lakes to present-day levels, creating an embayed estuary) located along the southeastern shoreline of Lake Michigan near the city of Holland, Michigan. This 7.2 km2 lake has a mean depth of 3.65 m and a maximum depth of 12.2 m. Average hydraulic retention time is 77 days (USEPA Citation1975). The lake and its watershed encompass ∼464 km2. Land use/land cover in the watershed, based on 2009 data, was 46% agriculture, 33% urban, 14% forest, 5% open, 0.7% water, and 0.5% wetland, although the lake shoreline is almost entirely developed (MACC Citation2012). Our experimental site was located along the north shore of Lake Macatawa in Pine Bay ().
Figure 1. Study site location. Inset: location of Lake Macatawa, MI. Blow up: Lake Macatawa showing connection to Lake Michigan and location of study site in Pine Bay.
Experimental set-up
NDSs were used to assess nutrient effects on benthic algae (Tank et al. Citation2006). Polycon cups were filled with nutrient-amended agar and capped with pre-ashed (550C) and weighed fritted glass disks (2.8 cm diameter). There were 4 treatments, each with 7 replicates: N, P, N+P, and a control (no nutrient treatment). The N treatment consisted of 0.5M NH4Cl, the P treatment was 0.5M KH2PO4, and the N+P treatment combined both 0.5M NH4Cl and 0.5M KH2PO4.
The NDS were randomly attached to 4 L-bars (Tank et al. Citation2006) secured to a square PVC frame (). The PVC frame had adjustable collars allowing us to manipulate the height of each L-bar to ensure all were ∼0.6 m below the water surface and exposed to equivalent light levels. The PVC assembly was anchored to the lake bottom, and the NDS were monitored periodically for periphyton growth. The incubation period was 24 June to 9 July 2015 and was terminated at the point when periphyton growth appeared susceptible to sloughing. Upon retrieval, NDS disks were carefully removed, sealed in a dark container, and placed on ice until return to the lab for processing.
Figure 2. Algal response to nutrient treatments. Top: Phytoplankton growth at the end of incubation, in order from left to right (n = 3 per treatment): control; +P; +N; and + N+P. Bottom: NDS showing periphyton growth at the end of incubation.
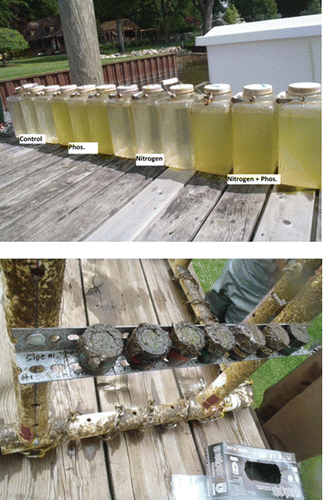
Twelve 10 L carboys filled with unfiltered surface water collected near the incubation location were used to assess nutrient effects on phytoplankton (). The carboys were placed in a stratified, random arrangement with 3 carboys on each side of a square PVC frame. The PVC frame was staked to the lake bottom using reinforcement bars, and the carboys were suspended from the frame in the water column. Carboys were amended with 4 nutrient treatments, each replicated 3 times: N as NaNO3 (1.5× ambient concentration); P as KH2PO4 (10× ambient concentration), N+P (at the same concentration as +N alone and +P alone), and control. We used different N species to more realistically represent the likely N species in each habitat; oxidized conditions in the water column result in greater nitrate (NO3) levels, whereas reducing conditions in the sediment result in greater ammonium (NH4) concentrations. Lougheed et al. (Citation2015) used a similar approach.
Carboys were subsampled (250 mL) prior to nutrient additions for chlorophyll a (Chl-a) and microcystin concentration. Immediately following nutrient additions, carboys were mixed by inverting 30 times and subsampled again for soluble reactive phosphorus (SRP) and NO3 to determine initial concentrations. Nutrients were subsampled by filtering 20 mL of water (0.45 µm cartridge filters) into 20 mL scintillation vials and frozen until analysis. The carboys were incubated for 7 days (24 June to 1 July 2015), shorter than the period for NDS because we wanted to avoid possible containment artifacts, such as nutrient limitation. Upon retrieval on day 7, the carboys were again inverted 30 times and subsampled for algal and nutrient parameters, as described earlier.
At the start and end of each incubation, as well as each week, general water quality conditions (dissolved oxygen [DO], temperature, pH, specific conductance, turbidity, total dissolved solids, redox potential, Chl-a, and cyanobacteria [phycocyanin pigment]) were measured with a YSI 6600 sonde. A vertical irradiance profile was measured with a LiCor meter at near surface, 0.1 m, and 0.5 m depths.
Laboratory methods
Periphyton ash-free dry mass (AFDM) and Chl-a were determined according to methods in Steinman et al. (Citation2006), with the following modifications for Chl-a: glass disks were soaked in 15 mL of buffered acetone overnight in the dark, filtered (GFF filters) in the dark, and frozen until analysis (<28 d); extraction included tissue grinding with buffered acetone and overnight extraction. Both periphyton and phytoplankton Chl-a were measured on a Shimadzu UV-1601 spectrophotometer and corrected for phaeophytin (APHA Citation1992).
Microcystin was measured in filtered phytoplankton (GFF) using the enzyme-linked immunosorbent assay (ELISA) test kit (Fastner et al. Citation1998, Carmichael and An Citation1999, Dyble et al. Citation2008, Envirologix Citation2010). Nutrients were measured on a SEAL AQ2 discrete automated analyzer (USEPA Citation1983).
Statistical analysis
The effect of nutrients on benthic and planktonic Chl-a was tested separately using a 2-factor analysis of variance (ANOVA; Tank and Dodds Citation2003). We used Fisher's least significant difference (LSD) method to examine pairwise contrasts if the overall ANOVA model was statistically significant. N or P limitation was recognized if only one of them elicited a positive response and the N × P interaction term was not significant. The algal community was considered co-limited by N and P if only the interaction term was statistically significant. N and P co-limitation occurred if each nutrient resulted in Chl-a increases relative to controls, but the responses of Chl-a to positive N and P were not different from each other. Secondary limitation was indicated if N or P alone significantly increased Chl-a, both N and P added together caused an even greater increase in Chl-a, and the interaction term for the ANOVA was significant. All statistical analyses were performed using the statistical computer program R (R Development Core Team Citation2008).
Results and discussion
Daytime limnological conditions were relatively stable at the site over the experimental period. Midday water temperatures ranged from 22.3 to 23.8C, DO from 10.2 to 11.6 mg/L, pH from 8.4 to 8.6, specific conductivity from 561 to 567 µS/cm, and total dissolved solids from 0.36 to 0.37 g/L.
Turbidity was higher at the near-surface carboy depth than at the near-bottom NDS depth at the start of the incubations (10.5 vs. 7.3 NTUs, respectively), but near-bottom turbidity more than doubled to 16 NTUs by the end of week 1 and then declined to 9.2 NTUs by the end of week 2. Consistent with turbidity, irradiance was higher at the surface (1951 µmol/m2/s) than at the NDS depth (208 µmol/m2/s) at the end of the incubations (irradiance was not measured at the start), resulting in a light extinction coefficient of 4.45. These relatively high irradiance levels at the near-sediment surface are sufficient to saturate or nearly saturate photosynthetic rates in benthic periphyton (Boston and Hill Citation1991), so it seems unlikely light was limiting during our study. By contrast, ambient nutrient concentrations at the start of the experiments in Pine Bay were below detection for SRP (5 µg/L), 56 µg/L for TP, and 2.28 mg/L for NO3. For eutrophic and hypereutrophic systems such as Lake Macatawa (lakewide average TP in 2015 was 114 µg/L), where irradiance levels, not nutrients, are often the limiting resource, planktonic algae have a competitive advantage over benthic algae. Despite TP concentrations that have typically exceeded 100 µg/L in the surface waters of Lake Macatawa (Holden Citation2014), the below-detection SRP concentrations at the time of our study suggest that nutrients, not light, may be limiting algal growth in Lake Macatawa. In this case, if bioavailable P is being released from the sediment into the water column, as has been shown in other eutrophic, drowned river mouth lakes in this region (Steinman et al. Citation2004, Citation2009), benthic algae may have a competitive advantage over phytoplankton due to first access to the diffusing P from the sediment (cf. Sand-Jensen and Borum Citation1991).
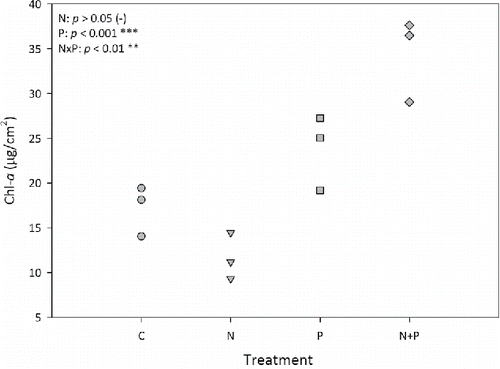
After a 15-day deployment, mean Chl-a concentration on the NDS was significantly greater in the P treatment than the control (P < 0.001; F = 647.0, df = 1), whereas mean Chl-a from the N treatment declined relative to controls, although the difference was not statistically significant (). The N×P interaction was statistically significant (P < 0.01; F = 14.47; df = 1), indicating that P was the primary limiting nutrient but that N had a secondary effect (albeit negative in this case).
Figure 3. Periphyton Chl-a concentrations from the NDS at the end of the experimental incubation. Negative sign after the N treatment P-value indicates a (nonsignificant) decline relative to the control.
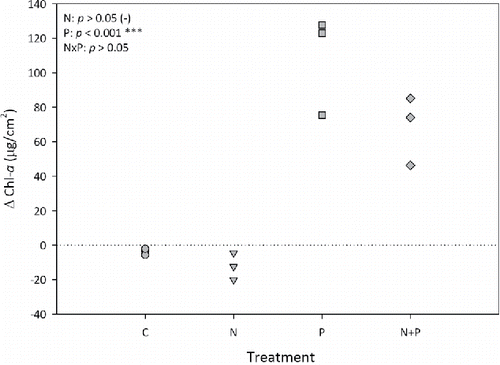
After a 7-day incubation, mean SRP in the carboys declined from an initial concentration (post-spike) of 120 µg/L to below detection (<5 µg/L). Initial mean NO3 concentration declined ∼4-fold, from 3.52 to 0.90 mg/L. Despite the decline in NO3 concentration, there was a net decrease in mean phytoplankton Chl-a in the N treatment relative to the control (). By contrast, mean Chl-a concentrations significantly increased in the P treatment (P < 0.001; F = 85.99; df = 1), but the N×P interaction was not statistically significant (), suggesting that P was the sole limiting nutrient. The overall Chl response pattern in periphyton and phytoplankton Chl-a was similar, with the exception of the N+P treatment eliciting a stronger response with the periphyton than the phytoplankton ().
Figure 4. Change (final minus initial) in phytoplankton Chl-a concentrations over the experimental incubation period. Negative sign after the N treatment P-value indicates a (nonsignificant) decline relative to the control.
The Redfield N:P ratio of 6.6 (molar) is often invoked as an index to assess phytoplankton nutrient limitation (Redfield Citation1958), with ratios >6.6 suggesting P limitation. Given that phytoplankton taxa have different optimal N:P ratios (Hecky and Kilham Citation1988, Klausmeier et al. Citation2008), however, it is debatable if any one ratio has universal applicability. In addition, there is uncertainty as to which N and P species should be included in the ratio. Kolzau et al. (Citation2014) recommended ratios of dissolved inorganic nitrogen to TP (DIN:TP), consistent with the findings of Morris and Lewis (Citation1988) and Bergström (Citation2010). We did not measure NH4 in our study, so our DIN is based solely on NO3 concentrations, making our numerator conservative. Even so, the NO3 concentrations were so high that the DIN:TP ratio was 86, strongly suggesting P limitation for phytoplankton in our study. Our experimental results were consistent with P limitation based on a clear and positive response of phytoplankton Chl-a to P and a small but not statistically significant negative response to N relative to controls. Given the high sediment loads in this largely agricultural watershed (Holden Citation2014), much of the P is likely adsorbed to sediment particles and not readily available to algae. Hence, a reliance solely on TP concentration to assess P limitation in Lake Macatawa could result in erroneous conclusions.
An inhibitory effect of added N on algal growth (relative to controls) has been observed in other systems, albeit mostly with benthic algae (Francoeur Citation2001, Tank and Dodds Citation2003, Ribot et al. Citation2015). Possible mechanisms responsible for this seemingly counterintuitive result include preferential grazing, nitrate toxicity, and changes in taxonomic composition manifested by lower Chl levels (Ribot et al. Citation2015). Differential grazing is certainly plausible because we did not filter the incubation water; zooplankton was not measured, so we cannot confirm or refute this possibility. It is unlikely that our NO3 addition (from 2.3 to 3.5 mg/L) was sufficient to induce toxic effects on the phytoplankton (cf. Donald et al. Citation2011), although the influence of N on phytoplankton growth is affected by the chemical form of N being added and the presence of P thresholds (Donald et al. Citation2011).
Some researchers have found the Redfield ratio also applies to benthic algae, at least when growing under balanced growth conditions, with N:P ratios useful for distinguishing N vs. P limitation (Hillebrand and Sommer Citation1999); others have found considerable variation in periphyton ratios as a function of land use (von Schiller et al. Citation2007, O'Brien and Wehr Citation2010). Kahlert (Citation1998) concluded that C:N:P ratios reliably reflect the nutrient status of freshwater benthic algae and proposed an optimal ratio of 158:18:1. The benthic algal response in our system was similar to the phytoplankton response, with the exception of a more muted response to the N+P treatment. Given that the DIN:TP ratio in the water (86:1) was much higher than either the Redfield (6.6:1) or Kahlert (18:1) ratio, the positive response to P is not unexpected, especially because irradiance levels were not limiting. It is unclear if the lack of an N response in the periphyton was due to the use of NH4 as opposed to NO3 with the phytoplankton. We used NH4 because it is the more likely form of N to be released from the sediment under reducing conditions; future experiments may want to use only one form of N to avoid a potentially confounding factor. Algae are believed to preferentially take up NH4 over NO3 because less energy is required (Dortch Citation1990), although NO3 may be the dominant form taken up when its concentrations are high (cf. Bunch and Bernot Citation2012). The inhibitory response of Chl to NH4 may be related to toxicity (Camargo and Alonso Citation2006, Ribot et al. Citation2015) and would also account for the lower Chl levels in the N+P treatment relative to the P alone treatment.
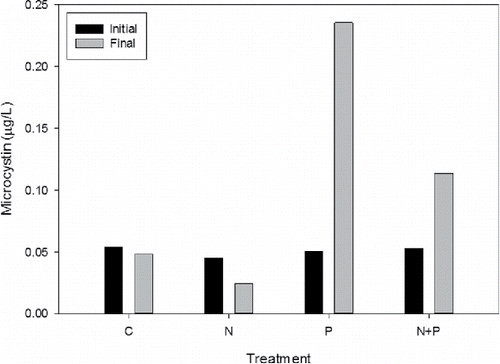
Microcystin was measured only in the phytoplankton, and concentrations were very low: <0.25 µg/L (). Over the 7-day incubation period, microcystin concentration changed little in the control treatment, declined by about half in the N treatment, and increased in both the P treatment (∼4.7-fold) and N+P treatment (2.2-fold), although absolute concentrations remained low (). Because the N+P response was lower than P alone, a possible inhibitory effect of N was again suggested, but with NO3 in this case. Monchamp et al. (Citation2014) concluded that the forms of N influence microcystin abundance and congener type largely through their effect on cyanobacterial species composition. We did not analyze taxonomic composition in this study, so we cannot ascribe differences in microcystin concentration to the presence of different cyanobacteria. An analysis from July and August 2006, however, found the 3 dominant species in the lake to be potentially cyanotoxin-forming cyanobacteria: Microcystis aeruginosa, Planktothrix agardhii, and Anabaena flos-aquae (Rediske R, Grand Valley State University, August 2006, unpubl. data). Despite the 2-fold difference in microcystin concentration between the P vs. N+P treatments in the present study, the absolute concentration difference was small and likely of little or no ecological significance; concentrations in this system remained far below the World Health Organization (WHO Citation2003) low-risk guidance for recreational exposure of 20 µg/L.
Figure 5. Microcystin concentration at the beginning (initial) and end (final) of the phytoplankton incubations.
Because our study was conducted in an embayment of Lake Macatawa, our results might not apply throughout the lake. Certainly, the transparency through the water column at our study site was unexpected, but precipitation during our study period was low (<0.6 cm), resulting in low sediment loads and relatively high transparency. In addition, Pine Creek's influence on ambient nutrient conditions was likely muted during our study period with the low precipitation. Even under average hydrologic conditions, Pine Creek accounts for only 9% of the total inflow budget to Lake Macatawa.
In conclusion, our results do not support the first hypothesis; phytoplankton response to nutrient addition was not greater than periphyton response, but the hypothesis was predicated on the assumption of light limitation, which was not present at the experimental site. Given that both autotrophic communities responded positively to P addition, the hypothesis could be supported under more turbid, light-limiting conditions. The results also do not support the second hypothesis because algal response was, if anything, reduced with N addition, not stimulated. The positive response to P was unexpected given that the lake is currently on the US impaired water list due to excess P. This designation is based on TP concentrations, however, and much of the P entering Lake Macatawa is attached to sediment. Presumably, as the bioavailable P desorbs from the sediment, it is rapidly taken up by autotrophs in the lake. These results suggest that using TP as an indicator of P limitation may be flawed without concomitant measurement of bioavailable P. Ultimately, control of external P loading is critical to directly limit phytoplankton abundance, but this management action also can result in indirect control of benthic algae if internal P loading from the sediment is a key source of P to this community. Given these results, restoration efforts in the Macatawa watershed should continue to focus on reducing P runoff into the lake.
Acknowledgments
We are grateful to Brittany Jacobs, Delilah Clement, and James Smit for assistance in the field; Brian Scull, Rick Rediske, and Jorge Luis Berrios Rivera for laboratory assistance; Kurt Thompson and Mike Hassett for assistance with figures; and the Koster family for allowing us to use their dock for experimental deployments.
Funding
This research was funded by NSF REU Site grant #1461249 (QUEST: QUantitative Environmental Science and Technology) to J. N. McNair and K. B. Strychar.
References
- [APHA] American Public Health Association. 1992. Standard methods for the examination of water and wastewater. 18th ed. Washington (DC): American Public Health Association.
- Bergström AK. 2010. The use of TN:TP and DIN:TP ratios as indicators for phytoplankton nutrient limitation in oligotrophic lakes affected by N deposition. Aquat Sci. 72:277–281.
- Blumenshine SC, Vadeboncoeur Y, Lodge DM, Cottingham KL, Knight SE. 1997. Benthic–pelagic links: responses of benthos to water-column nutrient enrichment. J N Am Benthol Soc. 16:466–479.
- Bonilla S, Villeneuve V, Vincent WF. 2005. Benthic and planktonic algal communities in a high arctic lake: pigment structure and contrasting responses to nutrient enrichment. J Phycol. 41:1120–1130.
- Boston HL, Hill WR. 1991. Photosynthesis–light relations of stream periphyton communities. Limnol Oceanogr. 36:644–656.
- Bunch ND, Bernot MJ. 2012. Nitrate and ammonium uptake by natural stream sediment microbial communities in response to nutrient enrichment. Res Microbiol. 163:137–141.
- Camargo JA, Alonso Á. 2006. Ecological and toxicological effects of inorganic nitrogen pollution in aquatic ecosystems: a global assessment. Environ Internat. 32:831–849.
- Carmichael WW, An J. 1999. Using an enzyme linked immunosorbent assay (ELISA) and a protein phosphatase inhibition assay (PPIA) for the detection of microcystins and nodularins. Nat Toxins. 7:377–385.
- Dodds WK, Bouska WW, Eitzmann JL, Pilger TJ, Pitts KL, Riley AJ, Schloesser JT, Thornbrugh DJ. 2008. Eutrophication of US freshwaters: analysis of potential economic damages. Environ Sci Technol. 43:12–19.
- Donald DB, Bogard MJ, Finlay K, Leavitt PR. 2011. Comparative effects of urea, ammonium, and nitrate on phytoplankton abundance, community composition, and toxicity in hypereutrophic freshwaters. Limnol Oceanogr. 56:2161–2175.
- Dortch Q. 1990. The interaction between ammonium and nitrate uptake in phytoplankton. Mar Ecol Prog Ser. 61:183–201.
- Dyble J, Fahnenstiel GL, Litaker RW, Millie DF, Tester PA. 2008. Microcystin concentrations and genetic diversity of Microcystis in the lower Great Lakes. Environ Toxicol. 23:507–516.
- Envirologix. 2010. QuantiPlate kit for microcystins. Available from: http://www.envirologix.com/wp-content/uploads/2015/05/EP022-Microcystin-070110.pdf
- Fastner J, Flieger I, Neumann U. 1998. Optimized extraction of microcystins from field samples—a comparison of different solvents and procedures. Water Res. 32:3177–3181.
- Francoeur SN. 2001. Meta-analysis of lotic nutrient amendment experiments: detecting and quantifying subtle responses. J N Am Benthol Soc. 20:358–368.
- Genkai-Kato M, Vadeboncoeur Y, Liboriussen L, Jeppesen E. 2012. Benthic–planktonic coupling, regime shifts, and whole-lake primary production in shallow lakes. Ecology. 93:619–631.
- Hansson LA. 1990. Quantifying the impact of periphytic algae on nutrient availability for phytoplankton. Freshwater Biol. 24:265–273.
- Harrault L, Allard B, Mériguet J, Carmignac D, Huon S, Gauzens B, Lacroix G. 2014. Bottom‐up effects of lake sediment on pelagic food‐web compartments: a mesocosm study. Freshwater Biol. 59:1695–1709.
- Havens KE, East TL, Meeker RH, Davis WP, Steinman AD. 1996. Phytoplankton and periphyton responses to in situ experimental nutrient enrichment in a shallow subtropical lake. J Plankt Res. 18:551–566.
- Havens KE, Hauxwell J, Tyler AC, Thomas S, McGlathery KJ, Cebrian J, Valiela I, Steinman AD, Hwang S-J. 2001. Complex interactions between autotrophs in shallow marine and freshwater ecosystems: implications for community responses to nutrient stress. Environ Pollut. 113:95–107.
- Hecky RE, Kilham P. 1988. Nutrient limitation of phytoplankton in freshwater and marine environments: a review of recent evidence on the effects of enrichment. Limnol Oceanogr. 33:796–822.
- Hillebrand H, Sommer U. 1999. The nutrient stoichiometry of benthic microalgal growth: Redfield proportions are optimal. Limnol Oceanogr. 44:440–446.
- Holden S. 2014. Monthly water quality assessment of Lake Macatawa and its tributaries, April-September 2012. Michigan Department of Environmental Quality, Water Resources Division. MI/DEQ/WRD-14/005.
- Kahlert M. 1998. C:N:P ratios of freshwater benthic algae. Arch Hydrobiol Spec Issue Adv Limnol. 51:105–114.
- Klausmeier CA, Litchman E, Daufresne T, Levin SA. 2008. Phytoplankton stoichiometry. Ecol Res. 23:479–485.
- Kolzau S, Wiedner C, Rücker J, Köhler J, Köhler A, Dolman AM. 2014. Seasonal patterns of nitrogen and phosphorus limitation in four German lakes and the predictability of limitation status from ambient nutrient concentrations. PloS One. 9:e96065.
- Lougheed VL, Hernandez C, Andresen CG, Miller NA, Alexander V, Prentki R. 2015. Contrasting responses of phytoplankton and benthic algae to recent nutrient enrichment in Arctic tundra ponds. Freshwater Biol. 60:2169–2186.
- Lu H, Wan J, Li J, Shao H, Wu Y. 2016. Periphytic biofilm: a buffer for phosphorus precipitation and release between sediments and water. Chemosphere. 144:2058–2064.
- Lubchenco J, Menge BA. 1978. Community development and persistence in a low rocky intertidal zone. Ecol Monogr. 48:67–94.
- [MACC] Macatawa Area Coordinating Council. 2012. Macatawa Watershed Management Plan. Available from: http://www.michigan.gov/documents/deq/wrd-nps-wmp-macatawa-1-2_425598_7.pdf
- Monchamp ME, Pick FR, Beisner BE, Maranger R. 2014. Nitrogen forms influence microcystin concentration and composition via changes in cyanobacterial community structure. PloS One. 9:e85573.
- Morris DP, Lewis WM. 1988. Phytoplankton nutrient limitation in Colorado mountain lakes. Freshwater Biol. 20:315–327.
- O'Brien PJ, Wehr JD. 2010. Periphyton biomass and ecological stoichiometry in streams within an urban to rural land-use gradient. Hydrobiologia. 657:89–105.
- R Development Core Team. 2008. R: a language and environment for statistical computing. Vienna (Austria): R Foundation for Statistical Computing. Available from: http://www.R-project.org
- Redfield AC. 1958. The biological control of chemical factors in the environment. Am. Sci. 46:205–221.
- Ribot M, von Schiller D, Sabater F, Marti E. 2015. Biofilm growth and nitrogen uptake responses to increases in nitrate and ammonium availability. Aquat Sci. 77:695–707.
- Romo S, Villena MJ, García-Murcia A. 2007. Epiphyton, phytoplankton and macrophyte ecology in a shallow lake under in situ experimental conditions. Fund Appl Limnol. 170:197–209.
- Sand-Jensen K, Borum J. 1991. Interactions among phytoplankton, periphyton, and macrophytes in temperate freshwaters and estuaries. Aquat Bot. 41:137–175.
- Scheffer M, van Nes EH. 2007. Shallow lakes theory revisited: various alternative regimes driven by climate, nutrients, depth and lake size. Hydrobiologia. 584:455–466.
- Steinman AD, Chu X, Ogdahl M. 2009. Spatial and temporal variability of internal and external phosphorus loads in an urbanizing watershed. Aquat Ecol. 43:1–18.
- Steinman AD, Lamberti GA, Leavitt PR. 2006. Biomass and pigments of benthic algae. In: Hauer FR, Lamberti GA, editors. Methods in stream ecology. 2nd ed. San Diego (CA): Academic Press. p. 357–379.
- Steinman AD, Rediske R, Reddy KR. 2004. The importance of internal phosphorus loading to Spring Lake, Michigan. J Environ Qual. 33:2040–2048.
- Tank JL, Bernot MJ, Rosi-Marshall EJ. 2006. Nitrogen limitation and uptake. In: Hauer FR, Lamberti GA, editors. Methods in stream ecology. 2nd ed. San Diego (CA): Academic Press. p. 213–238.
- Tank JL, Dodds WK. 2003. Nutrient limitation of epilithic and epixylic biofilms in ten North American streams. Freshwater Biol. 48:1031–1049.
- [USEPA] US Environmental Protection Agency. 1975. National eutrophication survey. Report on Lake Macatawa, Ottawa County, MI. Working Paper No. 200. Available from: http://nepis.epa.gov/Exe/ZyPDF.cgi/9100D0LQ.PDF?Dockey=9100D0LQ.PDF
- [USEPA] US Environmental Protection Agency. 1983. Methods for chemical analysis of water and wastes. Washington (DC).
- Vadeboncoeur Y, Jeppesen E, Vander Zanden MJ, Schierup HH, Christoffersen K, Lodge DM. 2003. From Greenland to green lakes: cultural eutrophication and the loss of benthic pathways in lakes. Limnol Oceanogr. 48:1408–1418.
- Vadeboncoeur Y, Peterson G, Vander Zanden MJ, Kalff J. 2008. Benthic algal production across lake size gradients: interactions among morphometry, nutrients, and light. Ecology. 89:2542–2552.
- Vadeboncoeur Y, Steinman AD. 2002. Periphyton function in lake ecosystems. Sci World J. 2:1449–1468.
- Vadeboncoeur Y, Vander Zanden MJ, Lodge DM. 2002. Putting the lake back together: reintegrating benthic pathways into lake food web models. BioScience. 52:44–54.
- Vander Zanden MJ, Vadeboncoeur Y. 2002. Fishes as integrators of benthic and pelagic food webs in lakes. Ecology. 83:2152–2161.
- Vander Zanden MJ, Vadeboncoeur Y, Chandra S. 2011. Fish reliance on littoral–benthic resources and the distribution of primary production in lakes. Ecosystems. 14:894–903.
- von Schiller D, Martı´ E, Riera JL, Sabater F. 2007. Effects of nutrients and light on periphyton biomass and nitrogen uptake in Mediterranean streams with contrasting land uses. Freshwater Biol. 52:891–906.
- [WHO] World Health Organization. 2003. Guidelines for safe recreational water environments. Volume 1, Coastal and fresh waters. Geneva (Switzerland): WHO. Available from: http://apps.who.int/iris/bitstream/10665/42591/1/9241545801.pdf