
Abstract
Favot EJ, Holeton C, DeSellas AM, Paterson AM. 2023. Cyanobacterial blooms in Ontario, Canada: continued increase in reports through the 21st century. Lake Reserv Manage. 39:1–20.
The Ontario Ministry of the Environment, Conservation and Parks samples algal composition in response to public reports of suspected algal blooms, which have been tracked since 1994. In a previous analysis, Winter et al. noted a significant increase in the number of reports of confirmed algal blooms dominated by cyanobacteria from 1994 to 2009. Here, we determined that this increasing trend in the yearly number of confirmed cyanobacterial bloom reports (CCBRs) has persisted in Ontario over the intervening decade, to 2019. More than half of CCBRs were from waterbodies on the Precambrian Shield, in the Georgian Bay (5E) ecoregion, known for cottaging and water-based tourism. Data from the Ontario Lake Partner Program (LPP) was used to investigate total phosphorus (TP) concentrations in waterbodies with CCBRs. Approximately 44% of the waterbodies with a CCBR (mean TP 12.99 µg/L, n = 135) had average spring TP concentrations less than 10 µg/L, compared to 64% for LPP waterbodies with no reported or confirmed cyanobacterial blooms (mean TP 9.79 µg/L, n = 918). The most common taxon of cyanobacteria dominating bloom samples in inland waterbodies was Dolichospermum, followed by Aphanizomenon in waterbodies on the Precambrian Shield, and Microcystis in the Mixedwood Plains ecozone in southern Ontario. While an increase in public awareness cannot be ruled out in contributing to the rise in CCBRs across Ontario, the high proportion of cyanobacterial blooms occurring in oligotrophic waterbodies suggests that there may be a link to climate warming, rendering conditions more favorable for these blooms to occur.
Global increases in freshwater cyanobacterial bloom frequency, intensity, and extent in response to anthropogenic activities and climate change have been recently demonstrated (Taranu et al. Citation2015, Ho et al. Citation2019, Hou et al. Citation2022), projected (Chapra et al. Citation2017) and widely discussed (Paerl and Paul Citation2012, Pick Citation2016, Cressey Citation2017, Chorus et al. Citation2021). Cyanobacterial blooms have the potential to affect human health (Pouria et al. Citation1998, Svirčev et al. Citation2019), economics (Steffensen Citation2008), and overall ecosystem function and biodiversity (Krztoń et al. Citation2019, Amorim and Moura Citation2021), making them a major threat to the quality and beneficial use of freshwater resources. On a regional scale, assessing the potential for increases in cyanobacterial bloom incidence and reporting is important to appropriately position management programs, policies, and resources to plan for and mitigate the negative consequences of future bloom events.
The causes of cyanobacterial blooms are complex and often interacting. Cultural eutrophication (or nutrient enrichment) is a major contributor to biomass and blooms of cyanobacteria in freshwater lakes (Smith and Schindler Citation2009). Phosphorus is often the limiting nutrient controlling cyanobacterial growth (Schindler et al. Citation2016), and cyanobacteria can access nutrient sources in the environment that are otherwise not readily available to eukaryotic algae. For instance, many species of bloom-forming cyanobacteria employ buoyancy regulation to access hypolimnetic phosphorus pools created by internal loading from the sediments (Cottingham et al. Citation2015). As another example, some cyanobacterial genera can perform nitrogen fixation, converting atmospheric nitrogen into biologically available forms like ammonium, meaning that these taxa, unlike eukaryotic algae, are not limited by the concentration of inorganic nitrogen in water. Environmental factors related to climate change, including elevated water temperatures (Paerl and Huisman Citation2008, Lürling et al. Citation2018), enhanced thermal stratification (Posch et al. Citation2012), and changes to hydrological cycling (e.g., lower river flows in drought conditions (Pick Citation2016), or nutrient pulses from drought/extreme precipitation cycles (Callieri et al. Citation2014), have also been invoked in bolstering cyanobacterial blooms, as have the spread of aquatic invasive species leading to food web alterations (Vanderploeg et al. Citation2001, Knoll et al. Citation2008).
The Province of Ontario in Canada contains hundreds of thousands of waterbodies that span a broad range of physiographic, climatological, and anthropogenic conditions. This diversity of lakes presents a challenge to lake managers, as comprehensive monitoring of all lakes is not feasible. The Ontario government collects information on occurrence of algal blooms (i.e., cyanobacteria and eukaryotic algae) in the province as part of complaint-based sampling. Water samples are collected as part of a coordinated provincial government protocol to respond to reported suspected incidences of algal blooms, and, in turn, public health officials can inform and manage potential risks to human health. Although the protocol is not intended as a lake monitoring program, or designed specifically to track bloom frequency over time, the dataset provides an excellent opportunity to examine spatial and temporal trends in algal blooms from hundreds of Ontario waterbodies. There are few comparable datasets worldwide (Brooks et al. Citation2016).
An analysis of this provincial algal bloom dataset in 2011 documented a significant increase in the number of government-confirmed public reports of algal and cyanobacterial blooms between 1994 and 2009 (Winter et al. Citation2011). Its findings indicated that most of the increase in the number of cyanobacterial bloom reports was accounted for from lakes on the Precambrian Shield, and that the most common taxa of cyanobacteria identified in reported blooms were Anabaena (some taxa now reclassified into Dolichospermum), Aphanizomenon, Microcystis, Gloeotrichia, and various Oscillatoriales (Winter et al. Citation2011). Winter et al. (Citation2011) also noted that algal blooms were being reported significantly later into the fall in the early 2000s than they were during the 1990s. We provide an update on the cyanobacterial bloom portion of this dataset a decade later to determine (1) whether there has been a continued increase in the number of cyanobacterial bloom reports and (2) whether patterns exist in the occurrence of cyanobacterial blooms geographically, seasonally, or with respect to their taxonomic composition and waterbody chemical characteristics. Cyanobacterial toxin data collected as a part of this program are beyond the scope of this article.
Methods
Confirmed cyanobacterial bloom reports (CCBRs)
Data on cyanobacterial bloom occurrence were compiled from the coordinated Ontario protocol designed to respond to reports of suspected nuisance or harmful algal blooms (HABs), which are often made by the public or government employees (). The protocol includes standardized methods to collect and analyze the water samples and is intended to inform local health officials of any risks to public health from exposure to cyanotoxins. Grab samples of water and floating scum (if present) were collected at the surface or to wrist depth from dense areas of growth or accumulation. The samples were examined by trained staff with taxonomic expertise at the Ontario Ministry of the Environment Conservation and Parks (MECP) using inverted microscopes at 100×–400× magnification (Utermöhl Citation1931). The taxa that were major contributors to the algal and cyanobacteria assemblage in the samples (based on biovolume) were identified to the lowest taxonomic level possible (usually genus). Quantitative measurements are not available since the analysis typically only involved a rapid scan. Biovolume was determined in a semiquantitative fashion based on professional judgment and cross-comparison among analysts.
In this study, we define a confirmed cyanobacterial bloom report (CCBR) as an excessive growth of cyanobacteria in a lake or river to a level that prompted a complaint, and in which a grab sample was subsequently found by microscopic observation to have high total biovolume of one or a few dominant or co-dominant cyanobacterial taxa. We make no distinction between toxic and nontoxic cyanobacterial blooms since paired samples were not always collected for both taxonomic identification and cyanotoxin analysis.
This study builds on findings from earlier research (Winter et al. Citation2011) that analyzed data from complaint reports received by the Ontario government from 1994 to 2009. In addition to extending the data to include reports received to 2019, this compilation includes dates and location information (including waterbody name, site description, and geographic coordinates when available), as well as taxonomic information described above. We removed replicate samples of a particular cyanobacterial bloom event (either from another location on the waterbody or taken on a later date during the same event) so that each sample included in the analysis represents a unique CCBR event. Samples collected from locations that were not considered a waterbody, including drainage ditches, artificial ponds, semi-enclosed harbors, and non-naturalized reservoirs, were removed from all analyses except those looking at the taxonomic composition and monthly timing of cyanobacterial blooms. We chose to exclude samples from these highly anthropogenically altered systems for the yearly tally of CCBRs and from total phosphorus (TP) analyses of inland lakes and rivers in order to present patterns in the number of cyanobacterial bloom reports and nutrient conditions in waterbodies that are representative of natural ecosystems and more relevant to lake and watershed managers. To examine patterns in beginning, end, and length of the seasonal CCBR period over time, Mann–Kendall trend tests were performed using R statistical software (R Core Team Citation2020) and the kendall package (McLeod Citation2011).
Figure 1. Locations of confirmed cyanobacterial blooms (CCBR) reported to the Ministry of the Environment, Conservation and Parks between 1994 and 2019 (blue dots) across the province of Ontario. Colored areas display ecoregion, and black lines represent freeways and highways (Ontario Road Network Citation2018).
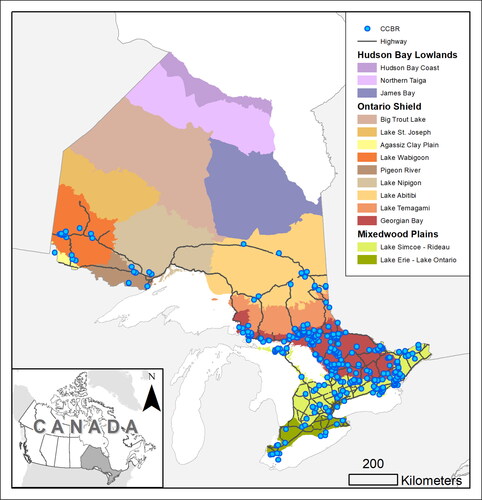
Figure 7. Number of samples each month between 1994 and 2019 in which a taxon was a dominant or co-dominant cyanobacterial bloom contributor, separated by the type of sampling location. Counts include second sampling on rare occasions when blooms persisted multiple weeks. Panels are (A) Dolichospermum (sensu lato), (B) Microcystis, and (C) Aphanizomenon, the 3 most commonly observed cyanobacteria taxa in this study. Samples may be counted in multiple columns because taxa can be co-dominant.
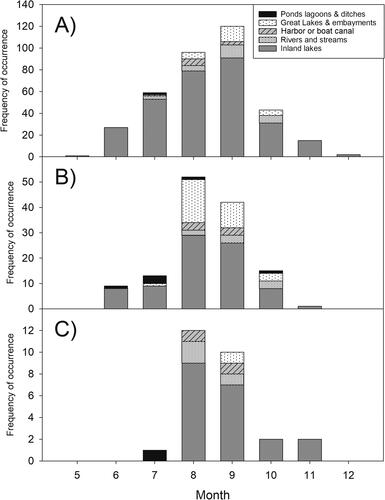
Figure 2. Variation among the ecoregions of Ontario in mean spring total phosphorus (TP) in inland lakes and rivers. Ecoregions with fewer than 10 waterbodies with Lake Partner Program water chemistry data are not shown.
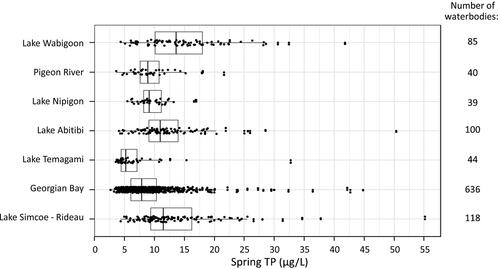
Figure 3. (A) Number of confirmed cyanobacterial blooms reported by the public to the Ontario Ministry of the Environment, Conservation and Parks and (B) number of waterbodies reporting first confirmed cyanobacterial blooms by year between 1994 and 2019. The shaded area represents the period of data that was included in Winter et al. (Citation2011). The vertical line represents the introduction of the provincial response protocol for algal blooms in 2006, which may have altered the number of confirmed cyanobacterial bloom reports, although the magnitude of the effect cannot be ascertained. Annual totals exclude reports from drainage ditches, artificial ponds, semi-enclosed harbors, and non-naturalized reservoirs.
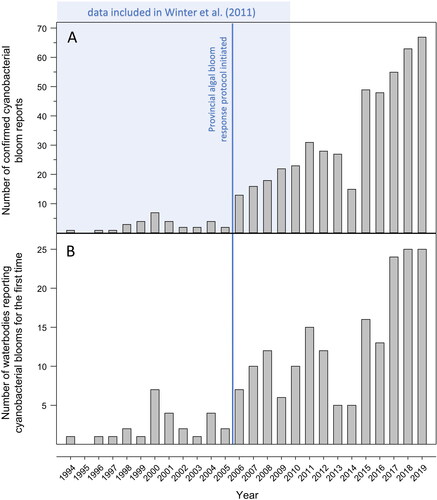
Figure 4. Comparison of mean spring total phosphorus (TP) concentrations between 2 time periods (2005–2009 and 2015–2019) observed in inland lakes and rivers from the Ontario Lake Partner Program (Ontario Ministry of the Environment, Conservation and Parks Citation2022a) that had at least 2 years of sampling in each time period. A comparison of matched pairs using a Wilcoxon signed-rank test (Wilcoxon Citation1945) indicated that spring TP concentrations decreased significantly between these 2 time periods (results shown in top left corner). A one-to-one line indicating no change between time periods is shown for reference; points below the line (n = 231) showed a decrease in average spring TP, whereas points above the line (n = 173) demonstrated an increase.
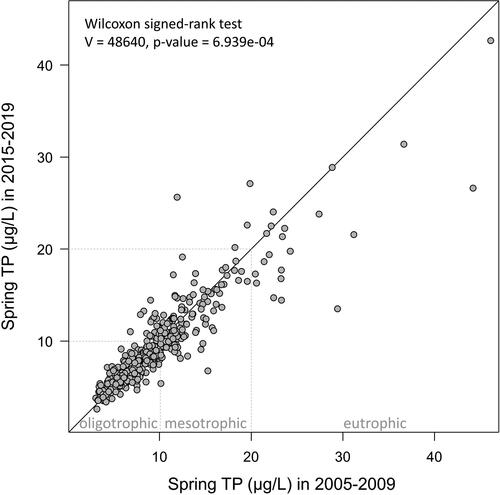
Figure 5. Comparison of mean spring total phosphorus (TP) concentrations in inland lakes and rivers that have had no confirmed cyanobacterial bloom reports (CCBRs), with those that have had 1–2 or 3 or more years with CCBRs within the Georgian Bay and Lake Simcoe–Rideau ecoregions. The numbers of waterbodies included in each category are displayed above the plots. The area within each violin plot is scaled to the number of observations (waterbodies), with black horizontal lines representing quartiles, and black dots indicating mean TP concentration for each category.
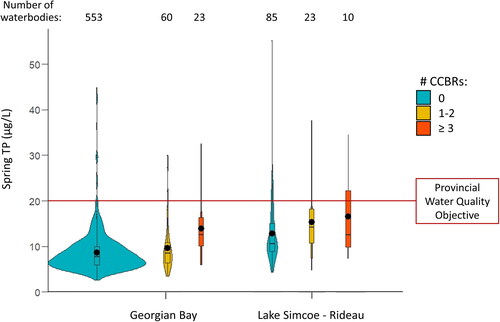
Figure 6. Yearly length of the cyanobacterial bloom reporting period to the Ministry of the Environment, Conservation and Parks between 1998 and 2019, indicated by the shaded area. White triangles indicate the first confirmed cyanobacterial bloom report in each year, while black circles indicate the last report in each year. This figure does not include confirmed cyanobacterial bloom reports in artificial ponds, lagoons and ditches, or harbors and boat canals.
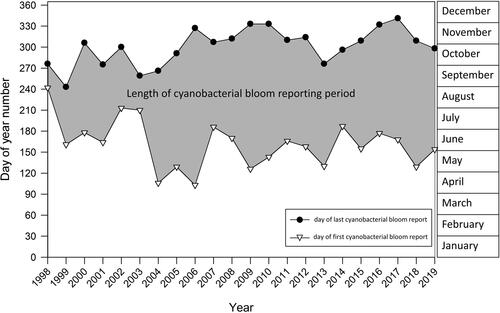
Table 1. P-values (P) and Bonferroni-adjusted P-values for multiple comparisons (Padj) examining differences in mean spring total phosphorus (TP) concentrations among inland lakes and rivers with no confirmed cyanobacterial bloom reports (CCBRs), 1–2 CCBRs, and ≥3 CCBRs in the Georgian Bay and Lake Simcoe–Rideau ecoregions. Note that waterbodies without CCBRs may have had unreported cyanobacterial blooms.
Table 2. Number of confirmed cyanobacterial blooms (CCBRs) dominated by 7 of the most common cyanobacterial genera/complexes in Ontario between 1994 and 2019, by ecozone and waterbody type.
Lake water chemistry analysis: The Lake Partner Program dataset
To understand the potential relationships between CCBRs and lake trophic status, total phosphorus (TP) data from the Lake Partner Program (LPP) were used (Ontario Ministry of the Environment, Conservation and Parks Citation2022a). The LPP is the MECP’s volunteer-based, inland lakes monitoring program that works in partnership with the Federation of Ontario Cottagers’ Associations to collect water samples from hundreds of Ontario waterbodies each year. Volunteer-collected samples are analyzed at an MECP lab that provides high-quality, precise lake chemistry data. Due to the nature of the program, the geographical distribution of waterbodies tends to include areas of Ontario that are accessible by road and are usually associated with cottage and home ownership (Millar et al. Citation2019). Field sample collection and laboratory analysis of duplicate TP samples followed MECP’s methods outlined in Clark et al. (Citation2010) and Ingram et al. (Citation2019). Concentrations of TP were determined colorimetrically, and results were precise to a standard deviation of approximately 0.11 µg/L TP for duplicate samples (Masters et al. Citation2017). Spring overturn (April or May) TP observations from the LPP, collected through the Secchi depth, were obtained for all available years from 2002 to 2019. TP measurements were limited to springtime to control effects of seasonality and maximize representation of waterbodies in the LPP, since all waterbodies monitored through the LPP are measured for spring TP (with only certain types of waterbodies having additional sampling times). In the generally oligotrophic waterbodies on the Precambrian Shield (most waterbodies in our dataset), surface water TP tends to be highest in the spring, after runoff from snowmelt and before the period of high removal by phytoplankton production (Clark et al. Citation2010).
Duplicate spring TP samples that were very dissimilar (coefficients of variation >25% between duplicate pairs) were removed from further analysis, and the means of the remaining duplicate pairs were calculated. Outliers within the TP time series of each waterbody were identified to be data points that were 1.5× above or below the calculated interquartile range. The samples identified as outliers in the time series for each waterbody were excluded from all analyses.
Long-term trends in TP in inland lakes and rivers from the LPP were examined by comparing TP differences in waterbodies with at least 2 years of sampling for spring overturn TP concentrations in both 2005–2009 and 2015–2019 time periods. Statistical significance of a difference in TP between these time periods was assessed using a Wilcoxon signed-rank test that compared the 2 paired averages (Wilcoxon Citation1945).
To examine the potential relationship of CCBR occurrence to surface water TP concentrations, mean spring TP concentrations from 2002 to 2019 in LPP sites with at least 2 years of sampling were calculated in inland lakes and rivers with at least 1 CCBR and compared to locations with no CCBRs using Mann–Whitney U-tests. For large lakes and rivers with multiple monitoring sites, the spatial variation in TP among sites was first examined, and sites were chosen that were nearest (within 5 km) to the CCBR location(s). This accounted for potential localized factors (i.e., point source nutrient enrichment) in larger lakes and rivers. In 5 waterbodies, sites were excluded that were located >5 km away from the CCBR location(s). Sites in Lake Nipissing and Lake of the Woods, very large lakes (∼873 and ∼4349 km2, respectively) with segmented arms or bays, were subdivided to account for distant areas of the lake with localized water chemistry differences in which CCBRs occurred. In addition, there were 2 instances where sites in adjacent lakes were amalgamated. In these cases, a river mouth and a bay are monitored as a station distinct from the adjacent waterbody, but there is exchange of water (and potentially blooms) between stations. Since the LPP TP data were determined to be non-normal, comparisons among categories of lakes with no CCBRs, one or 2 CCBRs, and 3 or more CCBRs were made using a nonparametric Kruskal–Wallis test (Kruskal and Wallis Citation1952) with post hoc Dunn’s testing (Dunn Citation1964), and P-value adjustment with the Bonferroni method for multiple comparisons in R statistical software (R Core Team Citation2020) using the dunn.test package (Dinno Citation2017).
Results
There was a high degree of overlap in the location of CCBRs in Ontario waterbodies and accessibility by major roads and highways, with the lowest density of CCBRs occurring in the most and least populated areas of the province (). The CCBRs predominantly occurred in the Ontario Shield and Mixedwood Plains ecozones of southern Ontario, outside major cities where lakes and rivers are most dense. No reports (confirmed or otherwise) were received in the Hudson Bay Lowlands ecozone in the far north of Ontario. Approximately 80% of the waterbodies with at least 1 CCBR between 1994 and 2019 occurred in the Lake Simcoe–Rideau or Georgian Bay ecoregions (within the Mixedwood Plains and Ontario Shield ecozones, respectively), and these 2 ecoregions contained 88% of the waterbodies with CCBRs in 3 or more years. Data from LPP monitoring of inland lakes and rivers suggest that spring TP concentrations in the Georgian Bay ecoregion are generally lower (mean spring TP: 8.93 µg/L) than in other areas of Ontario, particularly the Lake Simcoe–Rideau ecoregion (mean spring TP: 13.66 µg/L; ).
The numbers of CCBRs in Ontario have continued in an upward trend over the last decade since this finding was first reported by Winter et al. (Citation2011; ). Unlike the initial analysis by Winter et al. (Citation2011), our updated analysis excluded CCBR locations that were not lakes, rivers, or streams (e.g., drainage ditches, artificial ponds, semi-enclosed harbors, and non-naturalized reservoirs) from the examination of patterns in annual CCBR totals; however, there was almost no alteration in the pattern of the earlier data (1994 to 2009) with this change. There was also an increasing trend over time between 1994 and 2019 in the number of waterbodies with a first instance of a CCBR (). The generally increasing trend in both metrics is most apparent from 2006 onward (), corresponding with the formalization of the coordinated sampling protocol and efforts to increase awareness of the protocol with stakeholders such as cottage associations.
The examination of temporal trends in the LPP TP dataset indicated that, overall, spring overturn (April or May) TP concentrations declined significantly in Ontario waterbodies from 2005–2009 to 2015–2019 (Wilcoxon signed-rank test: P = 6.939e-4, Z = 0.168), with 231 of 404 (∼57%) of LPP lakes showing lower TP in 2015–2019 (). When grouped by trophic state (0–10 µg/L TP = oligotrophic, 10–20 µg/L = mesotrophic, and >20 µg/L = eutrophic), declines in TP were most visible in mesotrophic and eutrophic lakes, in which 64% and 90% declined in the later time period, respectively, and were less clear in oligotrophic lakes (51% declined).
Comparison of spring TP concentrations in inland lakes and rivers with and without CCBRs used data from 1065 waterbodies monitored by LPP volunteers: 146 waterbodies with at least 1 CCBR, and 919 waterbodies in which cyanobacterial blooms were either unreported or unconfirmed. The concentration of TP in waterbodies that had at least 1 CCBR spanned a broad range from 3.5 µg/L to 37.7 µg/L. In waterbodies with no CCBRs, this range in spring TP was even broader, from 2.6 to 55.1 µg/L (data not displayed). These patterns were then explored at an ecoregion scale to account for regional differences in waterbody characteristics. We examined TP differences across inland lakes and rivers with 0, 1–2, or ≥3 years of CCBRs for the Georgian Bay and Lake Simcoe–Rideau ecoregions (), since these areas of the province accounted for a large portion of the TP and CCBR data. In the Georgian Bay ecoregion, there was no significant difference in mean spring TP concentrations in waterbodies without CCBRs compared to waterbodies with 1–2 years of CCBRs (, ). Waterbodies with ≥3 years of CCBRs, however, did have significantly higher mean spring TP compared to the group with no CCBRs and the group with 1–2 years of CCBRs (, ). In the Lake Simcoe–Rideau ecoregion, mean spring TP was higher in waterbodies with 1–2 years of CCBRs and waterbodies with ≥3 years of CCBRs, when compared to waterbodies without CCBRs (, ); however, these differences were not significant (). There was also no significant difference in mean spring TP between waterbodies in the Lake Simcoe–Rideau ecoregion with 1–2 years of CCBRs and those with ≥3 years of CCBRs (, ).
We examined the seasonality of the first and last CCBR each year over the period between 1998 and 2019 (), for which Winter et al. (Citation2011) found a significant lengthening of the algal bloom reporting season, particularly due to late-season cyanobacterial bloom reports trending later in the fall over time. Our trend assessment was limited to natural waterbodies (i.e., lakes, rivers, and Great Lake embayments) and excluded years with fewer than 10 CCBRs (i.e., all years prior to 2006). In contrast to Winter et al. (Citation2011), our analysis found no statistically significant trends for CCBRs becoming earlier in the year or later in the year, or for a lengthening of the season between the first and last CCBR each year between 2006 and 2019 (). On average, for years in which at least 10 CCBRs occurred (from 2006 to 2019), the season over which blooms were reported and confirmed as cyanobacteria lasted 160 days (5.3 months), and began in early June and ended in early November ().
The most frequently dominant or co-dominant taxon in CCBRs across all regions and waterbody types from 1994 to 2019 was Dolichospermum sensu lato (). Due to the recent revision of the genus Anabaena, this group may also have included some planktonic species of Anabaena but is hereafter called Dolichospermum for the sake of simplicity. The genus Microcystis was a less frequent contributor to CCBRs in the Ontario Shield ecozone than the genera Aphanizomenon, Woronichinia, Gloeotrichia, and Oscillatoria/Planktothrix (in order of decreasing occurrence; ). By comparison, Microcystis was much more frequently observed as dominant or co-dominant in the Mixedwood Plains ecozone relative to the Ontario Shield ecozone (), particularly in the Great Lakes and embayments (largely representative of samples from Lake Erie and the Bay of Quinte, Lake Ontario).
The timing of the observation of the 3 most commonly dominant or co-dominant genera in the CCBRs (Dolichospermum, Microcystis, and Aphanizomenon) showed slight differences in the seasonality (length and peak) of observations, but observations were generally most frequent in September (). CCBRs that were dominated or co-dominated by Dolichospermum occurred between May and December (), whereas CCBRs of Microcystis or Aphanizomenon were observed over a slightly shorter season (May–Nov and Jun–Nov, respectively; ). There was also variation in CCBR timing among waterbody types. CCBRs in small, enclosed areas such as ponds and ditches occurred earlier in the season than in larger waterbodies such as the Great Lakes ().
Discussion
Spatial patterns in waterbodies with CCBRs across Ontario
Our study finds that CCBRs were most common in areas with high recreational waterbody use, where there exists substantial overlap of humans and lakes, and in areas easily accessible by vehicle. There were very few CCBRs in the sparsely populated northern region of the province (i.e., Lake Abitibi, Lake Nipigon, Lake Wabigoon, and Lake St. Joseph ecoregions), despite a relatively high density of inland lakes in these areas. No CCBRs in our dataset were from the Hudson Bay Lowlands ecozone in the far north of Ontario. This observation does not mean that cyanobacterial bloom incidence is nonexistent in the north and in subarctic regions of Canada. For example, cyanobacterial blooms have been documented by researchers in some regions, including Aquatuk Lake in the far north of Ontario (Paterson et al. Citation2014), and in Jackfish Lake (Sivarajah et al. Citation2021) and Yellowknife Bay of Great Slave Lake (Pick Citation2016), both located in the Northwest Territories at 62°N latitude. Rather, the lack of CCBRs from the northern portion of Ontario in our dataset more accurately reflects that each CCBR data point in our study is initiated by a public complaint, and northern Ontario is extremely remote and sparsely populated. This is an important reminder that CCBRs are not truly objective measures of bloom occurrence.
Our dataset was dominated by CCBRs in waterbodies located in the Georgian Bay ecoregion in the Ontario Shield ecozone, and the Lake Simcoe–Rideau ecoregion of southern Ontario in the Mixedwood Plains ecozone. This pattern has persisted since it was first noted by Winter et al. (Citation2011). These 2 ecoregions (Georgian Bay and Lake Simcoe–Rideau) are contrasting in both their natural features and their degree of human influence, and the differing geology greatly influences spatial patterns in waterbody chemistry in Ontario. The Georgian Bay ecoregion, with the most CCBRs, lies within the Ontario Shield ecozone where the landscape is characterized by slow-weathering Precambrian granite bedrock (exposed or shallow soils), and where waterbodies are thus characterized by naturally low TP and concentrations of dissolved minerals like calcium and chloride. In contrast, the Lake Simcoe–Rideau ecoregion in the Mixedwood Plains ecozone in southern Ontario is more highly populated and contains deposits of limestone, dolostone, and siliciclastic sediments from ancient waterbodies and glaciers (Ontario Geological Survey Citation2011). As a result of these deposits and the carbonate-rich Paleozoic bedrock, watershed soils are deeper, and waterbodies are generally enriched in TP, calcium, and chloride concentrations. These broad geographic patterns were reflected in the LPP water chemistry data, supporting previously published literature (e.g., Ontario Biodiversity Council Citation2015).
To better understand why the Georgian Bay ecoregion has the highest proportion of CCBRs in this dataset relative to other areas, we consider 3 possible explanations. The first explanation is that the Georgian Bay ecoregion simply has more waterbodies where humans can participate in recreational activities and make observations. Compared to the southern portion of the province (i.e., the Lake Simcoe–Rideau ecoregion), the Georgian Bay ecoregion has twice the land area covered by water (excluding the Great Lakes) and more than double (2.5 times) the number of waterbodies (Ontario Hydro Network – Waterbody Citation2021). Although there are similar or higher numbers of waterbodies in regions to the north of the Georgian Bay ecoregion, these areas are less densely inhabited, which may reduce the likelihood of a bloom being observed or reported.
A second possibility is that the demographics and engagement that influence reporting rates are unique to the Georgian Bay ecoregion. A comparison of demographic information among ecoregions suggests that cyanobacterial blooms in other areas may be underreported. Although the population in the Georgian Bay ecoregion is less dense than in areas to the south, the ecoregion contains a higher proportion of private properties that are utilized on a seasonal basis (e.g., cottages, summer homes, cabins; Statistics Canada Citation2017). Water-based tourism and lake recreation bring many people to destinations in the area, such as Muskoka, which is well known for activities focused on lakes. It is possible that cyanobacterial blooms in other ecoregions are less reported because blooms occurring in nonrecreational settings do not cause as much public concern, or because observations are missed entirely in sparsely populated areas. Moreover, we know from the LPP dataset that there is high public awareness and engagement with water quality issues concentrated in the Georgian Bay ecoregion compared to other areas of the province (Millar et al. Citation2019, Ontario Ministry of the Environment, Conservation and Parks Citation2022b).
A third possible explanation is that lakes in the Georgian Bay ecoregion have higher cyanobacterial bloom incidence compared to other regions of the province (i.e., higher reporting reflects higher incidence). However, this would be an unexpected result based on ambient nutrient concentrations, as this ecoregion has relatively low TP concentrations in comparison to other areas (). Further, as noted already, CCBRs are not a reliable representation of cyanobacterial bloom incidence, in general, as reporting rates are confounded by demographic and socioeconomic factors.
These 3 explanations may not be mutually exclusive, but ultimately the spatial pattern in CCBRs demonstrates that they occur most frequently at the intersection of highly populated and lake-dense areas in south-central Ontario (i.e., the Georgian Bay ecoregion). However, because CCBRs are tied to public complaints, we cannot definitively conclude that this observation is a true representation of cyanobacterial bloom incidence in Ontario, or an artifact of population density related to higher reporting numbers or engagement. Cyanobacterial blooms not observed by people or reported to government are not captured in our dataset.
Temporal trends in CCBRs from 1994 to 2019
Our study indicates that the generally increasing trend in the number of CCBRs documented between 1994 and 2009 by Winter et al. (Citation2011) has persisted over the intervening decade to 2019. Slight differences in the number of CCBRs in the overlapping period (from 1994 to 2009) of our study with Winter et al. (Citation2011) exist because non-natural waterbodies (e.g., ditches and harbors) were excluded from the analysis in the current study. Our study also examined temporal patterns in the number of waterbodies with first-time CCBRs, a new metric that was not included in Winter et al. (Citation2011). The pattern in the number of waterbodies with a first-time occurrence of a CCBR from 1994 to 2019 is similar to that of the total number CCBRs and suggests growth in the total number of waterbodies with reported blooms over time. Some annual variability in the number of waterbodies with CCBRs is expected, since environmental drivers of blooms can vary annually (e.g., weather patterns). A notable decline in reports occurred in 2013–2014, which coincides with a change in algal identification analysts (the only time on record). Quality control procedures were in place to limit interanalyst differences, but it is possible that this transition contributed to variations in the number of CCBRs in this period.
Two possible and potentially co-occurring reasons for the increasing pattern observed in CCBRs over the last 2 decades in Ontario include (1) an increase in cyanobacterial bloom incidence in Ontario waterbodies and (2) heightened public awareness and, thus, increased public reporting of cyanobacterial blooms. The general increasing trend in CCBRs in our dataset, including in waterbodies with first-time reports, may reflect a true increase in the incidence of cyanobacterial blooms in Ontario. This suggestion is consistent with the observation of a global increase in cyanobacterial bloom incidence and severity over the last several decades, tracked by satellite remote sensing (Ho et al. Citation2019, Hou et al. Citation2022), from paleolimnological records (Taranu et al. Citation2015), and recorded in many individual lakes or more localized data sets (e.g., LeBlanc et al. Citation2008, Sterner et al. Citation2020, Smucker et al. Citation2021). Global increases in cyanobacterial blooms over the last several decades have been primarily attributed to nutrient enrichment (Heisler et al. Citation2008) and climate change (Paerl and Huisman Citation2008, Gilbert Citation2020); other possible but less widespread drivers include changes in food web structure (i.e., zooplankton grazing pressure; Korosi et al. Citation2012) and aquatic invasive species (e.g., Vanderploeg et al. Citation2001, Gaskill and Woller-Skar Citation2018).
Climate change can bolster cyanobacterial blooms through complex and interacting mechanisms, including (1) increases in water temperature and declines in wind speed that enhance thermal stratification (Woolway et al. Citation2019), which alters internal nutrient loading dynamics and gives cyanobacteria with buoyancy regulation a competitive edge over eukaryotic phytoplankton (Jöhnk et al. Citation2008, Carey et al. Citation2012, Molot et al. Citation2021); and (2) altered and extreme precipitation patterns (Larsen et al. Citation2020) and water levels (Callieri et al. Citation2014), which can shift the timing and magnitude of nutrient delivery to fuel cyanobacterial blooms. Some studies have shown water temperature to be a predictor of cyanobacterial dominance equally as important as macronutrient levels (Beaulieu et al. Citation2013) and predict that cyanobacteria will become more dominant in more lakes in response to climate warming, irrespective of nutrient levels (Pick Citation2016). For instance, modeling on a ∼1000 lake dataset spanning the continental United States predicted a relationship whereby a doubling in CO2 from 1990 levels will produce a doubling in mean lake cyanobacterial biomass as a result of a ∼3.3 C increase in maximum lake surface temperature (Beaulieu et al. Citation2013). Several studies examining lakes within Ontario or in neighboring provinces have linked recent (and believed to be unprecedented) cyanobacterial blooms in low-productivity systems to climate warming (e.g., LeBlanc et al. Citation2008, Favot et al. Citation2019, Sterner et al. Citation2020). For instance, a paleolimnological study on an oligotrophic, remote lake in a protected area with no residents or development in the catchment (Dickson Lake in Algonquin Provincial Park) demonstrated that a whole-lake Dolichospermum bloom in the fall of 2014 was unprecedented over the last century; the most likely environmental driver was an anomalously quick onset of summer thermal stratification linked to spring climatic conditions (Favot et al. Citation2019). In Lake of the Woods, a large lake in the Lake Wabigoon ecoregion of Ontario, increased cyanobacterial blooms and whole-lake algal production have been linked to climate warming (Binding et al. Citation2011, Paterson et al. Citation2017).
Despite the mounting number of studies linking increasing cyanobacterial or algal blooms with climate change or eutrophication, other studies have found no empirical evidence for generalized intensification of algal blooms (Wilkinson et al. Citation2022). Instead, these studies have demonstrated no widespread intensification of lacustrine algal blooms over the latest decade (Wilkinson et al. Citation2022), or in marine systems have found that expanded monitoring attention has led to a perceived global increase in HABs in recent decades (Hallegraeff et al. Citation2021). However, few of the studies that failed to detect recent trends in algal blooms have focused on latitudes comparable to Ontario. This is an important consideration since lakes in regions with cold winters (mean air temperatures less than −0.4 C) are warming more rapidly, with lakes in the Laurentian Great Lakes region warming significantly more rapidly than the global average (O’Reilly et al. Citation2015, Woolway et al. Citation2020). For example, enhanced lake stratification (and in turn one of the major pathways expected to increase algal production in oligotrophic lakes: deoxygenation and internal nutrient loading) resulting from a changed climate is greatest at higher latitudes (Woolway et al. Citation2021).
An influence of awareness on reporting by the public may also be contributing to the observed increase in CCBRs and is supported by certain temporal patterns in the number of CCBRs. For example, the sudden increase in CCBRs after 2005 may have been influenced by outreach efforts to communicate the Province of Ontario’s algal bloom response protocol after it was formalized in 2006. This initiative likely improved public awareness of blooms and of the protocol for reporting them, causing increased reporting of potential cyanobacterial blooms to officials administering the protocol. Similarly, it is plausible that international media attention garnered by the 2014 cyanobacterial bloom in Lake Erie that prompted a 3 day water shutoff in the city of Toledo, Ohio, may also have bolstered public awareness and reporting of water quality issues and suspected cyanobacterial blooms in Ontario.
Other studies examining blooms using public report-based datasets have faced a challenge similar to that of our study. For instance, Mishra et al. (Citation2020) documented increasing numbers of social media posts regarding HABs, as well as increasing numbers of waterbodies represented by these posts between 2011 and 2015. They acknowledged the inability to decipher whether these patterns represent a true increase in bloom incidence, or a symptom of greater public awareness and social media engagement about HABs. This uncertainty demonstrates the nature of public complaint-driven datasets. Ultimately, neither explanation of increasing public reporting or increasing incidence of cyanobacterial blooms can stand alone to satisfactorily explain the pattern of increasing CCBRs since 1994 that we observe in Ontario. Rather, we agree with Winter et al. (Citation2011) that it is likely that both are factors contributing to the trend.
CCBR seasonality and dominant cyanobacterial taxa
Winter et al. (Citation2011) documented that bloom reports (i.e., of cyanobacteria or eukaryotic algae) were occurring significantly later into the fall in the early 2000s compared to the 1990s and found a significant lengthening of the bloom reporting season over the period from 1994 to 2009 driven by late-season cyanobacterial blooms. In the present study, we limited analysis to reports confirmed to be cyanobacterial blooms, and only examined years with at least 10 confirmed reports (i.e., in the period from 2006 to 2019). Our analysis did not detect a significant trend toward cyanobacterial blooms being reported later in the season, nor any significant changes to the length of the cyanobacterial bloom reporting season over time. One explanation for the discrepancy between Winter et al. (Citation2011) and our findings of no change in timing and length of the CCBR reporting period is that the trends found in the earlier study may have been an artifact of the low number of CCBRs per year (<10) that occurred prior to 2006. That is, the small sample sizes for CCBRs in the early portion of the Winter et al. (Citation2011) time series reduced the probability of bloom reports being at the extreme ends of the open-water period, which made it more likely for there to be fewer days between the first and last report.
We found the number of CCBRs to be highest in August and September, which is well supported in the literature, with cyanobacterial blooms generally reaching a maximum in late summer or early autumn in the northern portion of North America (Coffer et al. Citation2020). In addition, our data indicate that blooms of cyanobacteria are occurring and being reported very early and very late in the open-water season in Ontario, starting early in May and ending as late as early December. These very early and very late season cyanobacterial blooms are typically dominated by Dolichospermum (). Although cyanobacteria generally reach optimal growth rates at higher water temperatures compared to other phytoplankton (Paerl et al. Citation2011), they may be able to proliferate in sunny and still conditions in protected areas during cool seasons by maintaining buoyancy in the warm stratified surface layer. Dolichospermum species have a broad ecology, and some can grow at a lower temperature relative to other cyanobacteria (Xiaochuang et al. Citation2016, Zhang et al. Citation2020); observations of species in this genus blooming in relatively cool environments are not unusual (Salmaso et al. Citation2015, Reinl et al. Citation2020).
Climate-driven reductions in lake ice cover have been observed in Ontario waterbodies (Futter Citation2003, Sharma et al. Citation2019) and are predicted to prolong the annual period of phytoplankton growth and cyanobacterial blooms (Paerl et al. Citation2011). However, we did not find a concordant lengthening in the cyanobacterial bloom reporting period between 2006 and 2019, potentially because the period of the record is not long enough, or because we are examining the length of the reporting season, which may not reflect the period of incidence.
Role of TP in patterns of CCBRs
In Ontario, TP is the measure used to monitor and manage waterbody trophic status and phytoplankton production (Clark and Hutchinson Citation1992, Ontario Ministry of Environment Citation2010). Cyanobacterial biomass and the risk of cyanobacterial blooms rise rapidly when TP is greater than 20 μg/L (Downing et al. Citation2001, Vuorio et al. Citation2020). Interestingly, a few of our observations initially seem disjointed with respect to the relationship of TP concentrations and patterns of CCBRs. First, our analysis of spring TP trends over the last decade in more than 400 inland lakes and rivers in Ontario suggests that TP concentrations have decreased in 57% of the locations, especially those classified as mesotrophic or eutrophic (64% and 90% with declines, respectively). Several other studies have reported declining TP levels in Ontario lakes over the last few decades (Eimers et al. Citation2009, Palmer et al. Citation2011). Yet at a landscape scale, we observe an increasing trend in the number of CCBRs to 2019, despite the overall decline in mean TP concentrations. Second, a large percentage (84%) of the inland waterbodies with CCBRs (i.e., excluding the Great Lakes) had spring TP concentrations less than 20 µg/L, and 44% had spring TP concentrations less than 10 µg/L. Finally, in both the Georgian Bay and Lake Simcoe–Rideau ecoregions, there was no significant difference in spring TP in waterbodies that had no reported or confirmed cyanobacterial blooms compared to those with one or 2 years with CCBRs.
As already discussed, factors other than TP are likely to have influenced the pattern of increasing CCBRs over time in Ontario. Furthermore, despite the relatively weak relationship between TP and CCBRs at a regional scale, our findings do not preclude the importance of TP and the role of eutrophication in the occurrence of cyanobacterial blooms at a site level. Waterbodies in the Georgian Bay ecoregion with reoccurring cyanobacterial blooms (i.e., with 3 or more years of CCBRs) had significantly higher average spring TP concentration than waterbodies with fewer CCBRs or no reports.
Additional context may help interpret our data and the apparent prevalence of cyanobacterial blooms in lakes with relatively low spring TP. First, the TP data used are monitored to provide an indication of the overall trophic state of each waterbody but are not necessarily an indication of the full spatial and temporal variation in phosphorus available for growth of phytoplankton. The TP measurements are pelagic, photic zone, springtime values only and are an average of at least 2 years of data, excluding outliers in the time series. These factors are important because it is well documented that cyanobacterial blooms, and increases in cyanobacterial biomass in general, often occur in conjunction with deepwater anoxia and internal phosphorus loading (Nürnberg et al. Citation2013, Isles et al. Citation2015, Ding et al. Citation2018, Molot et al. Citation2021). Therefore, end-of-summer (peak CCBR period) at-depth TP concentrations might be more relevant for characterizing nutrient conditions in cyanobacterial bloom-affected lakes; however, such end-of-summer or deepwater TP data do not exist on a spatial scale as large as the spring TP data from LPP. In addition, TP samples were collected to characterize lake conditions at a broad spatial scale, so localized small-scale hotspots of eutrophication within each lake may not be represented.
Second, the large number of locations with CCBRs in the dataset that are oligotrophic may reflect the high proportion of oligotrophic waterbodies in the LPP TP dataset (). Many of the waterbodies represented in the LPP dataset are from the Georgian Bay ecoregion that is dominated by landscapes where phosphorus concentrations are naturally low, so the high proportion of oligotrophic waterbodies is not unexpected. Correspondingly, the relatively higher TP in waterbodies with CCBRs in the Lake Simcoe–Rideau ecoregion compared to the Georgian Bay ecoregion () likely reflects the underlying differences in TP distribution within the larger dataset ().
Third, the occurrence of CCBRs in oligotrophic lakes in our dataset is not totally unexpected, particularly when considering the identity of the dominant taxa. The majority of CCBRs in our study were dominated by Dolichospermum, especially in low-phosphorus waterbodies of the Georgian Bay ecoregion. This genus contains a diverse array of taxa that have a widespread distribution (Xiaochuang et al. Citation2016). The ubiquitous nature of the group indicates some species are able to form persistent populations, even in low-phosphorus environments (Favot et al. Citation2019, Reinl et al. Citation2020, Sterner et al. Citation2020), unlike other bloom-forming cyanobacteria like Microcystis spp. that are generally more prevalent in phosphorus-enriched conditions. By maintaining a small seed population, these taxa can form blooms opportunistically when conditions become favorable. Due to the presence of gas vesicles, Dolichospermum can also form problematic surface scums even when there is relatively low abundance of cells in the water column, particularly when cells are concentrated into embayments or along shorelines by winds.
Irrespective of the factors influencing the patterns we observed, the occurrence of cyanobacterial blooms in oligotrophic systems is not unprecedented; other studies have documented increases in cyanobacterial biomass and blooms in oligotrophic systems over the last few decades believed to be promoted by factors other than phosphorus concentrations (LeBlanc et al. Citation2008, Favot et al. Citation2019, Freeman et al. Citation2020, Reinl et al. Citation2020, Sterner et al. Citation2020). Deviating from the classic high-nutrient/algal bloom paradigm, the drivers of cyanobacterial bloom formation in low-nutrient systems have received far less research attention; clearly, cyanobacteria are able to thrive under a wide range of environmental conditions, including low-nutrient waterbodies (Reinl et al. Citation2021). Finally, the relationship between cyanobacterial biomass and phosphorus in low-productivity waterbodies characteristic of the Georgian Bay ecoregion (which represents a large portion of our dataset) could be different from the relationship built on a broad TP gradient to establish nutrient thresholds such as that presented in Downing et al. (Citation2001).
Other considerations: What is a bloom?
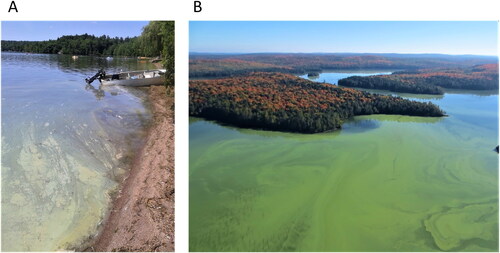
It is important to note that comparing our observations to other studies may be confounded by variation in how the term “bloom” is defined. In particular, the meaning can change greatly depending on the context or objective of the data collection (Smayda Citation1997, Ho and Michalak Citation2015). Definitions for what constitutes a bloom vary and there is no consistent unit of measure that is useful in all contexts, such as assessing trophic status or estimating risk of exposure to cyanotoxins. Our application of the term “bloom” may be more inclusive than studies that assess nutrient thresholds for risk of blooms. Since the objective of the public complaint-driven process that generated our dataset is to obtain a rapid estimate of health risk (i.e., due to possible toxin exposure), the process does not distinguish between spatially localized accumulation of cells or a broader waterbody-wide ecological state triggered by larger-scale limnological processes. Consequently, as counted in this study, the identification of a “bloom” may include a scenario in which cells that were present in the lake at low concentrations became buoyant and then were concentrated by wind or waves into a small area (), or whole-lake phenomena (). Assuming the grab sample contained cells in high abundance that were dominated by cyanobacteria, both scenarios are considered cyanobacterial blooms in this study. This does not downplay the importance of this dataset in a public health context, since it is important to know the breadth of situations in which there may be risk of exposure to toxins that can be produced by dense accumulations of cyanobacteria.
Figure 8. Examples of cyanobacterial blooms in Ontario lakes at a localized (A) and whole-lake (B) scale. Photographs provided by the Ontario Ministry of the Environment, Conservation and Parks (A), and by Alison Lake, Ontario Ministry of Natural Resources and Forestry (B).
Conclusions
In summary, our findings indicate that CCBRs were most common in south-central Ontario in the Georgian Bay ecoregion. The total number of CCBRs, as well as the number of new waterbodies with CCBRs, has generally continued to increase over the last decade, and the length of the cyanobacterial bloom reporting period has not changed significantly since 2006. A high proportion of waterbodies with CCBRs (∼84%) have spring TP of <20 µg/L (with 44% having <10 µg/L). This range of TP would classify these waterbodies as being of relatively good water quality and would not immediately flag them to local managers as waterbodies with elevated nutrient concentrations (Ontario Ministry of Environment and Energy Citation1994).
Climate warming is altering lake physicochemical properties such as the length and strength of thermal stratification and length of the ice-free season (Woolway et al. Citation2022), as well as the extent of anoxia (Jane et al. Citation2021), which alters the timing and availability of nutrients to fuel cyanobacterial blooms. Mounting evidence suggests that continued climate change will exacerbate cyanobacterial bloom extent and severity, and will result in more cyanobacterial dominance in more waterbodies, irrespective of nutrient regime (Pick Citation2016). It is important to note, however, that the drivers of cyanobacterial blooms likely vary regionally. For instance, while climate warming could be a factor contributing to increasing CCBRs in low-nutrient lakes on the Precambrian Shield (which is an area and waterbody type that is well represented in our dataset), in areas of the Mixedwood Plains ecoregion cyanobacterial blooms occur where there is very low residential and recreational development, but more agriculture. These types of blooms and agricultural regions could be underrepresented in this dataset due to a lack of public observation and recreational users to report blooms, as well as a smaller number of these waterbodies within the Province of Ontario. Moving forward, the prevention and mitigation of cyanobacterial blooms will require a multifaceted approach incorporating existing broad-scale nutrient management strategies, an approach that also considers local factors (Erratt et al. Citation2022).
The observed increase in incidence of CCBRs in Ontario from 1994 to 2019 may have public health implications since many of the cyanobacterial taxa typically observed in CCBRs in Ontario are known to produce cyanotoxins. Furthermore, regardless of the underlying causes, the continued increase in CCBRs represents a growing public health issue. New approaches for the detection and monitoring of cyanobacterial blooms (e.g., real-time monitoring, satellite or hyperspectral imagery, and improved toxicological data) may assist with assessing the public health risk posed by cyanotoxins (Chorus and Welker Citation2021).
Acknowledgments
We thank the Natural Sciences and Engineering Research Council of Canada for a Discovery Grant awarded to AMP. Thanks are due to the Ontario Lake Partner Program volunteers and the Federation of Ontario Cottagers’ Associations for contributing water samples to the dataset that is critical to establishing how water chemistry differs in lakes with and without reported cyanobacterial blooms. We acknowledge the essential contributions of the MECP staff that provided the algal identification services and laboratory analyses, as well as the MECP Regional and District staff, Public Health Units, and other groups that have collected and submitted the algal bloom samples throughout the years. Finally, we thank 3 reviewers for their thoughtful comments and edits to this article.
Disclosure statement
The authors report there are no competing interests to declare.
Correction Statement
This article has been republished with minor changes. These changes do not impact the academic content of the article.
References
- Amorim CA, Moura ADN. 2021. Ecological impacts of freshwater algal blooms on water quality, plankton biodiversity, structure and ecosystem functioning. Sci Total Environ. 758:143605. doi:10.1016/j.scitotenv.2020.143605.
- Beaulieu M, Pick FR, Gregory-Eaves I. 2013. Nutrients and water temperature are significant predictors of cyanobacterial biomass in a 1147 lakes dataset. Limnol Oceanogr. 58(5):1736–1746. doi:10.4319/lo.2013.58.5.1736.
- Binding CE, Greenberg TA, Bukata RP. 2011. Time series analysis of algal blooms in Lake of the Woods using the MERIS maximum chlorophyll index. J Plankton Res. 33(12):1847–1852. doi:10.1093/plankt/fbr079.
- Brooks BW, Lazorchak JM, Howard MDA, Johnson M-VV, Morton SL, Perkins DAK, Reavie ED, Scott GI, Smith SS, Steevens JA. 2016. Are harmful algal blooms becoming the greatest inland water quality threat to public health and aquatic ecosystems? Environ Toxicol Chem. 35(1):6–13. doi:10.1002/etc.3220.
- Callieri C, Bertoni R, Contesini M, Bertoni F. 2014. Lake level fluctuations boost toxic cyanobacterial “oligotrophic blooms”. PLoS One. 9(10):e10952. doi:10.1371/journal.pone.0109526.
- Carey CC, Ibelings BW, Hoffmann EP, Hamilton DP, Brookes JD. 2012. Eco-physiological adaptations that favour freshwater cyanobacteria in a changing climate. Water Res. 46(5):1394–1407. doi:10.1016/j.watres.2011.12.016.
- Chapra SC, Boehlert B, Fant C, Bierman VJ, Henderson J, David M, Mas DML, Rennels L, Jantarasami L, Martinich J, et al. 2017. Climate change impacts on harmful algal blooms in U.S. freshwaters: a screening-level assessment. Environ Sci Technol. 51(16):8933–8943. doi:10.1021/acs.est.7b01498.
- Chorus I, Fastner J, Welker M. 2021. Cyanobacteria and cyanotoxins in a changing environment: concepts, controversies, challenges. Water. 13(18):2463. doi:10.3390/w13182463.
- Chorus I, Welker M. 2021. Toxic cyanobacteria in water: a guide to their public health consequences, monitoring and management, 2nd edition. CRC Press, Boca Raton (FL), on behalf of the World Health Organization, Geneva, CH; p. 1–858.
- Clark B, Hutchinson NJ. 1992. Measuring the trophic status of lakes: sampling protocols. Ontario Ministry of Environment and Energy. ISBN 0-7778-0387-9; p. 1–36.
- Clark BJ, Paterson AM, Jeziorski A, Kelsey S. 2010. Assessing variability in total phosphorus measurements in Ontario lakes. Lake Reserv Manage. 26(1):63–72. doi:10.1080/07438141003712139.
- Coffer MM, Schaeffer BA, Darling JA, Urquhart EA, Salls WB. 2020. Quantifying national and regional cyanobacterial occurrence in US lakes using satellite remote sensing. Ecol Indic. 111:105976. doi:10.1016/j.ecolind.2019.105976.
- Cottingham KL, Ewing HA, Greer ML, Carey CC, Weathers KC. 2015. Cyanobacteria as biological drivers of lake nitrogen and phosphorus cycling. Ecosphere. 6(1):1–19. doi:10.1890/ES14-00174.1.
- Cressey D. 2017. Climate change is making algal blooms worse. Nature. doi:10.1038/nature.2017.21884.
- Ding S, Chen M, Gong M, Fan X, Qin B, Xu H, Gao S, Jin Z, Tsang DCW, Zhang C. 2018. Internal phosphorus loading from sediments causes seasonal nitrogen limitation for harmful algal blooms. Sci Total Environ. 625:872–884. doi:10.1016/j.scitotenv.2017.12.348.
- Dinno A. 2017. Dunn.test: Dunn’s test of multiple comparisons using rank sums. R package version 1.3.5; [cited 1 May 2022]. Available from https://CRAN.R-project.org/package=dunn.test.
- Downing JA, Watson SB, McCauley E. 2001. Predicting cyanobacteria dominance in lakes. Can J Fish Aquat Sci. 58(10):1905–1908. doi:10.1139/f01-143.
- Dunn OJ. 1964. Multiple comparisons using rank sums. Technometrics. 6(3):241–252. doi:10.1080/00401706.1964.10490181.
- Eimers MC, Watmough SA, Paterson AM, Dillon PJ, Yao H. 2009. Long-term declines in phosphorus export from forested catchments in south-central Ontario. Can J Fish Aquat Sci. 66(10):1682–1692. doi:10.1139/F09-101.
- Erratt KJ, Creed IF, Trick CG. 2022. Harmonizing science and management options to reduce risks of cyanobacteria. Harmful Algae. 116:102264. doi:10.1016/j.hal.2022.102264.
- Favot EJ, Rühland KM, DeSellas AM, Ingram R, Paterson AM, Smol JP. 2019. Climate variability promotes unprecedented cyanobacterial blooms in a remote, oligotrophic Ontario lake: evidence from paleolimnology. J Paleolimnol. 62(1):31–52. doi:10.1007/s10933-019-00074-4.
- Freeman EC, Creed IF, Jones B, Bergström A. 2020. Global changes may be promoting a rise in select cyanobacteria in nutrient-poor northern lakes. Glob Chang Biol. 26(9):4966–4987. doi:10.1111/gcb.15189.
- Futter MN. 2003. Patterns and trends in southern Ontario lake ice phenology. Environ Monit Assess. 88(1-3):431–444. doi:10.1023/a:1025549913965.
- Gaskill JA, Woller-Skar MM. 2018. Do invasive dreissenid mussels influence spatial and temporal patterns of toxic Microcystis aeruginosa in a low-nutrient Michigan lake? Lake Reservoir Manage. 34:244–257.
- Gilbert PM. 2020. Harmful algae at the complex nexus of eutrophication and climate change. Harmful Algae 91:101583.
- Hallegraeff GM, Anderson DM, Belin C, Bottein MYD, Bresnan E, Chinain M, Enevoldsen H, Iwataki M, Karlson B, McKenzie CH, et al. 2021. Perceived global increase in algal blooms is attributable to intensified monitoring and emerging bloom impacts. Commun Earth Environ. 2(1):117. doi:10.1038/s43247-021-00178-8.
- Heisler J, Glibert P, Burkholder J, Anderson D, Cochlan W, Dennison W, Gobler C, Dortch Q, Heil C, Humphries E, et al. 2008. Eutrophication and harmful algal blooms: a scientific consensus. Harmful Algae. 8(1):3–13. doi:10.1016/j.hal.2008.08.006.
- Ho JC, Michalak AM. 2015. Challenges in tracking harmful algal blooms: a synthesis of evidence from Lake Erie. J Great Lakes Res. 41(2):317–325. doi:10.1016/j.jglr.2015.01.001.
- Ho JC, Michalak AM, Pahlevan N. 2019. Widespread global increase in intense lake phytoplankton blooms since the 1980s. Nature. 574(7780):667–670. doi:10.1038/s41586-019-1648-7.
- Hou X, Feng L, Dai Y, Hu C, Gibson L, Tang J, Lee Z, Wang Y, Cai X, Liu J, et al. 2022. Global mapping reveals increase in lacustrine algal blooms over the past decade. Nat Geosci. 15(2):130–134. doi:10.1038/s41561-021-00887-x.
- Ingram RG, Girard RE, Paterson AM, Sutey P, Evans D, Xu R, Rusak J, Masters C. 2019. Dorset Environmental Science Centre: lake sampling methods. Ministry of the Environment, Conservation and Parks, technical report. p. 1–107.
- Isles PDF, Giles CD, Gearhart TA, Yaoyang X, Druschel GK, Schroth AW. 2015. Dynamic internal drivers of a historically severe cyanobacteria bloom in Lake Champlain revealed through comprehensive monitoring. J Great Lakes Res. 41(3):818–829. doi:10.1016/j.jglr.2015.06.006.
- Jane SF, Hansen GJA, Kraemer BM, Leavitt PR, Mincer JL, North RL, Pilla RM, Stetler JT, Williamson CE, Woolway RI, Arvola L, et al. 2021. Widespread deoxygenation of temperate lakes. Nature. 594(7861):66–70. doi:10.1038/s41586-021-03550-y.
- Jöhnk KD, Huisman J, Sharples J, Sommeijer B, Visser PM, Stroom JM. 2008. Summer heatwaves promote blooms of harmful cyanobacteria. Glob Chang Biol. 14(3):495–512. doi:10.1111/j.1365-2486.2007.01510.x.
- Knoll LB, Sarnelle O, Hamilton SK, Kissman CEH, Wilson AE, Rose JB, Morgan MR. 2008. Invasive zebra mussels (Dreissena polymorpha) increase cyanobacterial toxin concentrations in low-nutrient lakes. Can J Fish Aquat Sci. 65(3):448–455. doi:10.1139/f07-181.
- Korosi JB, Burke SM, Thienpont JR, Smol JP. 2012. Anomalous rise in algal production linked to lakewater calcium decline through food web interactions. Proc Biol Sci. 279(1731):1210–1217. doi:10.1098/rspb.2011.1411.
- Kruskal WH, Wallis A. 1952. Use of ranks in one-criterion variance analysis. J Am Stat Assoc. 47(260):583–621. doi:10.1080/01621459.1952.10483441.
- Krztoń W, Kosiba J, Pociecha A, Wilk-Woźniak E. 2019. The effect of cyanobacterial blooms on bio- and functional diversity of zooplankton communities. Biodivers Conserv. 28(7):1815–1835. doi:10.1007/s10531-019-01758-z.
- Larsen ML, Baulch HM, Schiff SL, Simon DF, Sauvé S, Venkiteswaran JJ. 2020. Extreme rainfall drives early onset cyanobacterial bloom. FACETS. 5(1):899–920. doi:10.1139/facets-2020-0022.
- LeBlanc S, Pick FR, Hamilton PB. 2008. Fall cyanobacterial blooms in oligotrophic-to-mesotrophic temperate lakes and the role of climate change. Verh Int Verein Limnol. 30(1):90–94. doi:10.1080/03680770.2008.11902091.
- Lürling M, Mendes e Mello M, van Oosterhout F, de Senerpont Domis L, Marinho MM. 2018. Response of natural cyanobacteria and algae assemblages to a nutrient pulse and elevated temperature. Front Microbiol. 9:1851.
- Masters C, Cederwall J, Sutey P. 2017. The determination of total phosphorus in water by colourimetry. Ontario Ministry of the Environment, Conservation and Parks, Laboratory Services Branch, DOP-E3036; p. 1–49.
- McLeod AI. 2011. Kendall: Kendall rank correlation and Mann-Kendall trend test. R package version 2.2; [cited 1 May 2022]. Available from https://CRAN.R-project.org/package=Kendall.
- Millar EE, Hazell EC, Melles SJ. 2019. The “cottage effect” in citizen science? Spatial bias in aquatic monitoring programs. Int J Geogr Inf Sci. 33(8):1612–1632. doi:10.1080/13658816.2018.1423686.
- Mishra DR, Kumar A, Ramaswamy L, Boddula VK, Das MC, Page BP, Weber SJ. 2020. CyanoTRACKER: a cloud-based integrated multi-platform architecture for global observation of cyanobacterial harmful algal blooms. Harmful Algae. 96:101828. doi:10.1016/j.hal.2020.101828.
- Molot LA, Schiff SL, Venkiteswaran JJ, Baulch HM, Higgins SN, Zastepa A, Verschoor MJ, Walters D. 2021. Low sediment redox promotes cyanobacteria blooms across a trophic range: implications for management. Lake Reserv Manage. 37:120–142. doi:10.1080/10402381.2020.1854400.
- Nürnberg GK, Molot LA, O’Connor E, Jarjanazi H, Winter J, Young J. 2013. Evidence for internal phosphorus loading, hypoxia and effects on phytoplankton in partially polymictic Lake Simcoe, Ontario. J Great Lakes Res. 39(2):259–270. doi:10.1016/j.jglr.2013.03.016.
- O’Reilly CM, Sharma S, Gray DK, Hampton SE, Read JS, Rowley RJ, Schneider P, Lenters JD, McIntyre PB, Kraemer BM, Weyhenmeyer GA, et al. 2015. Rapid and highly variable warming of lake surface waters around the globe. Geophys Res Lett. 42:10773–10781.
- Ontario Biodiversity Council. 2015. State of Ontario’s Biodiversity [web application]. Ontario Biodiversity Council, Peterborough, Ontario; [cited 19 May 2022]. Available from https://sobr.ca/indicator/water-quality-inland-lakes/.
- Ontario Geological Survey. 2011. 1:250 000 scale bedrock geology of Ontario. Ontario Geological Survey, Miscellaneous Release: Data 126-Revision 1.
- Ontario Hydro Network – Waterbody [computer file]. 2021. Peterborough, ON: Ontario Ministry of Natural Resources and Forestry; [cited 1 Feb 2022]. Available from http://geohub.lio.gov.on.ca.
- Ontario Ministry of the Environment. 2010. Lakeshore capacity assessment handbook: protecting water quality in inland lakes on Ontario’s Precambrian shield Appendix A: rationale for a revised phosphorus criterion for Precambrian shield lakes in Ontario. Toronto, Ontario; [cited 1 May 2022]. Available from https://www.ontario.ca/page/lakeshore-capacity-assessment-handbook-protecting-water-quality-inland-lakes-ontarios-precambrian.
- Ontario Ministry of Environment and Energy. 1994. Water management: policies, guidelines, provincial water quality objectives. 61 pp.
- Ontario Ministry of the Environment, Conservation and Parks. 2022a. Data Catalogue: Ontario Lake Partner; [cited 1 Feb 2022]. Available from https://data.ontario.ca/dataset/ontario-lake-partner.
- Ontario Ministry of the Environment, Conservation and Parks. 2022b. Map: Lake Partner; [cited 1 Jul 2022]. Available from https://www.ontario.ca/page/map-lake-partner.
- Ontario Road Network [computer file]. 2018. Peterborough, ON: Ontario Ministry of Natural Resources and Forestry; [cited 1 Feb 2022]. Available from http://geohub.lio.gov.on.ca.
- Paerl HW, Hall NS, Calandrino ES. 2011. Controlling harmful cyanobacterial blooms in a world experiencing anthropogenic and climatic-induced change. Sci Total Environ. 409(10):1739–1745. doi:10.1016/j.scitotenv.2011.02.001.
- Paerl HW, Huisman J. 2008. Blooms like it hot. Science. 320(5872):57–58. doi:10.1126/science.1155398.
- Paerl HW, Paul VJ. 2012. Climate change: links to global expansion of harmful cyanobacteria. Water Res. 46(5):1349–1363. doi:10.1016/j.watres.2011.08.002.
- Palmer ME, Yan ND, Paterson AM, Girard RE. 2011. Water quality changes in south-central Ontario lakes and the role of local factors in regulating lake response to regional stressors. Can J Fish Aquat Sci. 68(6):1038–1050. doi:10.1139/f2011-041.
- Paterson AM, Keller B, Jones C, Rühland KM, Winter J. 2014. An exploratory survey of water chemistry and plankton communities in lakes near the Sutton River, Hudson Bay Lowlands, Ontario, Canada. Arct, Antarct Alp Res. 46(1):121–138. doi:10.1657/1938-4246-46.1.121.
- Paterson AM, Rühland KM, Anstey CV, Smol JP. 2017. Climate as a driver of increasing algal production in Lake of the Woods, Ontario, Canada. Lake Reserv Manag. 33:1–12.
- Pick FR. 2016. Blooming algae: a Canadian perspective on the rise of toxic cyanobacteria. Can J Fish Aquat Sci. 73(7):1149–1158. doi:10.1139/cjfas-2015-0470.
- Posch T, Koster O, Salcher MM, Pernthaler J. 2012. Harmful filamentous cyanobacteria favoured by reduced water turnover with lake warming. Nature Clim Change. 2(11):809–813. doi:10.1038/nclimate1581.
- Pouria S, de Andrade A, Barbosa J, Cavalcanti RL, Barreto VTS, Ward CJ, Preiser W, Poon GK, Neild GH, Codd GA. 1998. Fatal microcystin intoxication in haemodialysis unit in Caruaru, Brazil. Lancet. 352(9121):21–26. doi:10.1016/S0140-6736(97)12285-1.
- R Core Team. 2020. R: a language and environment for statistical computing. R Foundation for Statistical Computing, Vienna, Austria; [cited 1 Jan 2022]. Available from https://www.R-project.org/.
- Reinl KL, Brookes JD, Carey CC, Harris TD, Ibelings BW, Morales-Williams AM, De Senerpont Domis LN, Atkins KS, Isles PDF, Mesman JP, et al. 2021. Cyanobacterial blooms in oligotrophic lakes: shifting the high-nutrient paradigm. Freshw Biol. 66(9):1846–1859. doi:10.1111/fwb.13791.
- Reinl KL, Sterner RW, Moraska Lafrancois B, Brovold S. 2020. Fluvial seeding of cyanobacterial blooms in oligotrophic Lake Superior. Harmful Algae. 100:101941. doi:10.1016/j.hal.2020.101941.
- Salmaso N, Buzzi F, Capelli C, Shams S, Cerasino L. 2015. Expansion of bloom-forming Dolichospermum lemmermannii (Nostocales, Cyanobacteria) to the deep lakes south of the Alps: colonization patterns, driving forces and implications for water use. Harmful Algae. 50:76–87. doi:10.1016/j.hal.2015.09.008.
- Schindler DW, Carpenter SR, Chapra SC, Hecky RE, Orihel DM. 2016. Reducing phosphorus to curb lake eutrophication is a success. Environ Sci Technol. 50(17):8923–8929. doi:10.1021/acs.est.6b02204.
- Sharma S, Blagrave K, Magnuson JJ, O’Reilly CM, Oliver S, Batt RD, Magee MR, Straile D, Weyhenmeyer GA, Winslow L, et al. 2019. Widespread loss of lake ice around the Northern Hemisphere in a warming world. Nat Clim Chang. 9(3):227–231. doi:10.1038/s41558-018-0393-5.
- Sivarajah B, Simmatis B, Favot EJ, Palmer MJ, Smol JP. 2021. Eutrophication and climatic changes lead to unprecedented blooms in a Canadian sub-arctic landscape. Harmful Algae. 105:102036. doi:10.1016/j.hal.2021.102036.
- Smayda TJ. 1997. What is a bloom? A commentary. Limnol Oceanogr. 42(5part2):1132–1136. doi:10.4319/lo.1997.42.5_part_2.1132.
- Smith VH, Schindler DW. 2009. Eutrophication science: where do we go from here? Trends Ecol Evol. 24(4):201–207. doi:10.1016/j.tree.2008.11.009.
- Smucker NJ, Beaulieu JJ, Nietch CT, Young JL. 2021. Increasingly severe cyanobacterial blooms and deep water hypoxia coincide with warming water temperatures in reservoirs. Glob Chang Biol. 27(11):2507–2519. doi:10.1111/gcb.15618.
- Statistics Canada. 2017. 2016 Census: Census Profile Downloads (Tables: 98-401-X).
- Steffensen DA. 2008. Economic cost of cyanobacterial blooms. In: Hudnell HK, editor. Cyanobacterial harmful algal blooms: state of the science and research needs. New York (NY): Springer; p. 855–865.
- Sterner RW, Reinl KL, Moraska Lafrancois B, Brovold S, Miller TR. 2020. A first assessment of cyanobacterial blooms in oligotrophic Lake Superior. Limnol Oceanogr. 65(12):2984–2998. doi:10.1002/lno.11569.
- Svirčev Z, Lalić D, Bojadžija Savić G, Tokodi N, Drobac Backović D, Chen L, Meriluoto J, Codd GA. 2019. Global geographical and historical overview of cyanotoxin distribution and cyanobacterial poisonings. Arch Toxicol. 93(9):2429–2481. doi:10.1007/s00204-019-02524-4.
- Taranu ZE, Gregory-Eaves I, Leavitt PR, Bunting L, Buchaca T, Catalan J, Domaizon I, Guilizzoni P, Lami A, McGowan S, Moorhouse H, et al. 2015. Acceleration of cyanobacterial dominance in north temperate-subarctic lakes during the Anthropocene. Ecol Lett. 18(4):375–384. doi:10.1111/ele.12420.
- Utermöhl H. 1931. Neue Wege in der quantitativen Erfassung des Planktons. (Mit besondere Beriicksichtigung des Ultraplanktons). Verh Int Verein Theor Angew Limnol. 5(2):567–596. doi:10.1080/03680770.1931.11898492.
- Vanderploeg HA, Liebig JR, Carmichael WW, Agy MA, Johengen TH, Fahnenstiel GL, Nalepa TF. 2001. Zebra mussel (Dreissena polymorpha) selective filtration promoted toxic Microcystis blooms in Saginaw Bay (Lake Huron) and Lake Erie. Can J Fish Aquat Sci. 58(6):1208–1221. doi:10.1139/f01-066.
- Vuorio K, Järvinen M, Kotamäki N. 2020. Phosphorus thresholds for bloom-forming cyanobacterial taxa in boreal lakes. Hydrobiologia. 847(21):4389–4400. doi:10.1007/s10750-019-04161-5.
- Wilcoxon F. 1945. Individual comparisons by ranking methods. Biometrics. 1(6):80–83. doi:10.2307/3001968.
- Wilkinson GM, Walter JA, Buelo CD, Pace ML. 2022. No evidence of widespread algal bloom intensification in hundreds of lakes. Frontiers Ecol Environ. 20(1):16–21. doi:10.1002/fee.2421.
- Winter JG, DeSellas AM, Fletcher R, Heintsch L, Morley A, Nakamoto L, Utsumi K. 2011. Algal blooms in Ontario, Canada: increases in reports since 1994. Lake Reserv Manage. 27(2):107–114. doi:10.1080/07438141.2011.557765.
- Woolway RI, Kraemer BM, Lenters JD, Merchant CJ, O’Reilly CM, Sharma S. 2020. Global lake responses to climate change. Nat Rev Earth Environ. 1(8):388–403. doi:10.1038/s43017-020-0067-5.
- Woolway RI, Merchant CJ, Van Den Hoek J, Azorin-Molina C, Nõges P, Laas A, Mackay EB, Jones ID. 2019. Northern hemisphere atmospheric stilling accelerates lake thermal responses to a warming world. Geophys Res Lett. 46(21):11983–11992. doi:10.1029/2019GL082752.
- Woolway RI, Sharma S, Smol JP. 2022. Lakes in hot water: the impacts of a changing climate on aquatic ecosystems. BioScience. 72(11):1050–1061. doi:10.1093/biosci/biac052.
- Woolway RI, Sharma S, Weyhenmeyer GA, Debolskiy A, Golub M, Mercado-Bettín D, Perroud M, Stepanenko V, Tan Z, Grant L, et al. 2021. Phenological shifts in lake stratification under climate change. Nat Comm. 12:2318.
- Xiaochuang L, Dreher TW, Renhui L. 2016. An overview of diversity, occurrence, genetics and toxin production of bloom-forming Dolichospermum (Anabaena) species. Harmful Algae. 54:54–68.
- Zhang M, Yang Z, Yu Y, Shi X. 2020. Interannual and seasonal shift between Microcystis and Dolichospermum: a 7-year investigation in Lake Chaohu, China. Water 12(7):1978. doi:10.3390/w12071978.