
 ?Mathematical formulae have been encoded as MathML and are displayed in this HTML version using MathJax in order to improve their display. Uncheck the box to turn MathJax off. This feature requires Javascript. Click on a formula to zoom.
Abstract
In this study, the heat and mass transport characteristics of anode-supported solid oxide fuel cells (SOFCs) are numerically investigated by using a two-dimensional model. The mathematical model is validated by comparing the numerical results with experimental data found in the open literature. The species and temperature distributions of SOFCs at different cell voltages are presented and compared. Effects of operating temperature, flow direction arrangement, and flow velocity on the overall cell performance and local temperature distribution are also analyzed. It is concluded that the local temperature is increased with decreasing operating cell voltage, increasing operating temperature, and decreasing cathode flow velocity. The temperature distribution is significantly changed when counter-flow arrangement is used instead of coflow arrangement. In addition, the effect of anode flow velocity on temperature distribution is negligible.
1. Introduction
With the rapid development of global economy, the energy demand has been gradually increasing during the past decades. Fossil fuels including coal, petroleum, and natural gas are still the major energy sources around the world. Due to the environment and energy issues, most societies are trying to use clean and sustainable energy instead of fossil fuels. Fuel cells are regarded as one of the most promising alternative energy technologies [Citation1]. According to the electrolyte, fuel cells can be classified into different types [Citation2]. Proton exchange membrane fuel cells (PEMFCs) are typical low-temperature fuel cells [Citation3–9]. And solid oxide fuel cells (SOFCs) are typical high-temperature fuel cells. SOFCs have attracted wide attention due to their advantages compared to other types of fuel cells. Tubular and planar SOFCs are two typical configurations of such cells. For the planar SOFCs, there are three types of cells including anode-supported cells, electrolyte-supported cells, and cathode-supported cells.
Cell performance of anode-supported and electrolyte-supported SOFCs under varying operating temperature and pressure was experimentally investigated by Hsieh et al. [Citation10]. The cell performance was significantly improved with increasing operating temperature and pressure. A spiral-like interconnector was proposed and applied to improve the mass transfer inside SOFCs [Citation11]. Experiments were carried out to evaluate the mass transfer performance. Compared to experimental measurements, numerical simulations can provide detailed information of transport phenomena inside fuel cells. Numerous mathematical models have been developed and applied to improve the understanding of fuel cells. A mathematical model was developed to predict the cell performance and corresponding potential losses [Citation12]. It was reported that the potential losses were mainly attributed to the Ohmic loss and this needed to be minimized to improve the cell performance. The effects of operating and design conditions on cell performance were systematically investigated. Ni et al. [Citation13] performed numerical analyses on the cell performance of SOFCs with functionally graded electrodes, where nonuniform porosity and particle size were linearly distributed. Similarly, nonlinear porosity distribution has been applied in the electrodes [Citation14]. The cell performance of SOFCs with parabolic, linear, and inverse parabolic porosity distributions was compared with that of SOFCs with uniform porosity distribution. It was found that the cell performance was strongly influenced by the porous microstructure distributions. The local transport characteristics of SOFCs with square and rectangular channels were numerically studied and compared by Andersson et al. [Citation15]. Recently, the effect of flow channel geometry on the cell performance of SOFCs was evaluated by Khazaee et al. [Citation16]. Numerical results showed that the best cell performance was provided by the rectangular channel, followed by the triangular channel and the trapezoid channel. Different flow field designs can also be found in the papers presented by Danilov and Tade [Citation17], Canavar and Timurkutluk [Citation18], Saied et al. [Citation19], and Shen et al. [Citation20]. Due to the fuel flexibility, there are also many investigations related to internal reforming reaction occurring in SOFCs [Citation21–23].
The lifetime of SOFCs is significantly affected by the thermal stress, which is caused by the prominent temperature gradient. The thermal stress distribution within SOFCs has already been extensively investigated by different researchers [Citation24–26]. In addition, there are also some investigations focusing on the temperature distribution within SOFCs. The species and temperature distributions of SOFCs were predicted by a mathematical model developed by Mahcene et al. [Citation27]. The effect of several heat sources was systematically investigated. The temperature distributions of SOFCs were numerically simulated by Yahya et al. [Citation28] using the lattice Boltzmann method (LBM). The effects of thermal conductivity, cell configuration, operating temperature, porosity, and current density on temperature distribution were comprehensively discussed and analyzed. The heat and mass transfer characteristics of SOFCs with varying electrolyte thicknesses and operating temperatures were investigated and discussed by Park et al. [Citation29]. Similarly, the effect of fuel utilization on heat and mass transfer within SOFCs was investigated by Lee et al. [Citation30].
Although there are various numerical investigations on the cell performance and transport processes inside SOFCs, a comprehensive study on the temperature distribution is still limited. The existing papers mainly focus on the chemical reactions occurring in the electrodes. The aim of this study was to study the heat and mass transport characteristics in anode-supported SOFCs at various operating conditions. In the present study, a two-dimensional, nonisothermal, and steady-state model based on the finite volume method (FVM) was developed and used to investigate the effects of operating voltage, flow direction arrangement, operating temperature, and flow velocity on the heat transfer characteristics of anode-supported planar SOFCs.
2. Model description
2.1. Physical model and assumptions
In the present study, a two-dimensional mathematical model was developed for anode-supported planar solid oxide fuel cells. As shown in , the computational domain consists of several layers, i.e., the anode/cathode interconnect, the anode/cathode flow channel, the anode/cathode diffusion layer, the anode/cathode functional layer, and the electrolyte layer between the anode and cathode electrodes. The geometric parameters of the physical model and the operating conditions are summarized in .
Figure 1. Schematic of anode-supported solid oxide fuel cells with coflow arrangement.
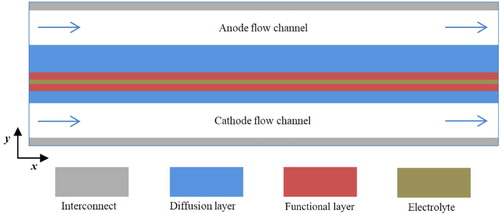
Table 1. Fuel cell geometric parameters and operating conditions [Citation31].
The assumptions made in the mathematical model are as follows: steady state; laminar flow; incompressible gas; isotropic and homogeneous electrodes; neglected radiation heat transfer. The conservation equations of mass, momentum, species, energy, and charge are solved to describe the transport processes in fuel cells. The transport equations are connected and coupled with each other through the source/sink terms.
2.2. Governing equations
Mass conservation equation:
(1)
(1)
where ρ and
are the mixture fluid density and velocity, respectively. Smass is determined by the mass consumption or generation caused by the electrochemical reaction.
(2)
(2)
(3)
(3)
Momentum conservation equation:
(4)
(4)
where P and μ are the mixture pressure and dynamic viscosity, respectively. Smom is the source term of the momentum equation. In the porous regions, the Darcy’s law is adopted.
(5)
(5)
where K is the permeability.
Species conservation equation:
(6)
(6)
where Yi and Deff,i are the mass fraction and effective diffusivity for the ith species, respectively. Si is the consumption or generation amount of the ith (H2, O2, H2O) species.
(7)
(7)
(8)
(8)
(9)
(9)
Energy conservation equation:
(10)
(10)
where cp and keff are the specific heat and effective thermal conductivity, respectively. The irreversible, reversible, and Ohmic heat generation terms are included in the source term of the energy equation.
(11)
(11)
Charge conservation equation:
(12)
(12)
(13)
(13)
where σeff,e is the effective electronic conductivity, and σeff,i is the effective ionic conductivity. The source terms are described by the Butler–Volmer equation.
(14)
(14)
(15)
(15)
The corresponding expressions and parameters used in the mathematical model are summarized and presented in and , respectively. More detailed information can be found in [Citation29].
Table 2. Complementary expressions.
Table 3. Parameters used in the mathematical model.
2.3. Numerical implementation and boundary conditions
The mathematical model is implemented using the commercial software ANSYS FLUENT. The governing equations of charge transport are implemented by using the user-defined scalar (UDS) equations. In addition, the user-defined functions (UDF) are used to define and calculate the source terms and the parameters in the iterative calculation process.
At the inlet of the flow channels, the velocity, temperature, and species mass fractions are prescribed. At the outlet of flow channels, a pressure-outlet boundary condition is assigned. Constant electric potentials (ϕe = 0 and ϕe = Vcell) are specified at the anode and cathode terminal walls, respectively. And the adiabatic boundary condition is specified at all the surrounding walls. And detailed boundary conditions are summarized in .
Table 4. Boundary conditions.
The Semi-Implicit Method for Pressure Linked Equations (SIMPLE) algorithm is used to link the pressure and velocity fields. The second-order upwind discretization scheme is adopted for momentum, species, energy, and UDS equations to ensure numerical stability and accuracy. Four mesh systems (x×y), namely, mesh I (40 × 34), mesh II (80 × 46), mesh III (120 × 58), and mesh IV (160 × 70), are used to investigate the mesh independence. In order to balance the accuracy and computational resources, the mesh system III has been chosen for the following simulations.
3. Results and discussion
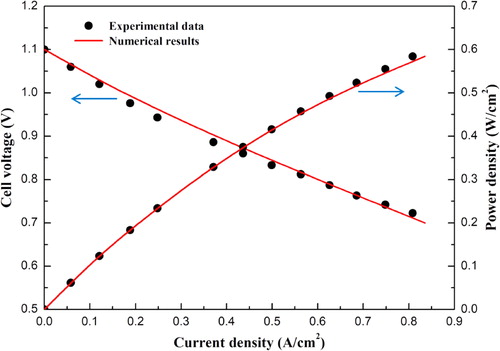
Prior to the numerical simulations, a model validation was carried out and it is found that the numerical results agree well with the experimental data reported by Zhang et al. [Citation31], as shown in . The experimental operating temperature is 1073 K, and the operating pressure is 1.0 atm. Air and humidified hydrogen were introduced into the cathode and anode sides with the flow rate of 500 and 200 sccm, respectively.
Figure 2. Comparison between the numerical results and experimental data.
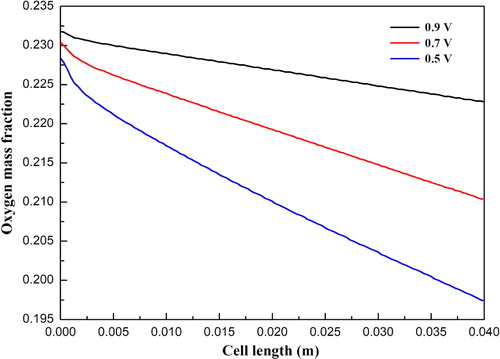
and show the hydrogen and water mass fraction distributions along the cell length direction at cell voltages 0.9, 0.7, and 0.5 V, respectively. For all three cases, the hydrogen mass fraction is gradually decreased, while the water mass fraction is gradually increased along the cell length direction. This is because hydrogen is consumed and water is simultaneously produced due to the electrochemical reactions occurring in the functional layers. In addition, the oxygen mass fraction distributions along the cell length direction at three cell voltages are illustrated in . The mass fraction is gradually decreased due to the consumption of oxygen. It is also observed that the magnitude of the mass fraction is significantly affected by the cell voltage. The corresponding current densities for three cell voltages are 0.31, 0.69, and 1.11 A/cm2, respectively. Larger amounts of hydrogen and oxygen are consumed at a lower cell voltage. Accordingly, the amount of water is increased with decreasing cell voltage.
Figure 3. Hydrogen mass fraction distribution at the anode diffusion layer and functional layer interface under different operating voltages.
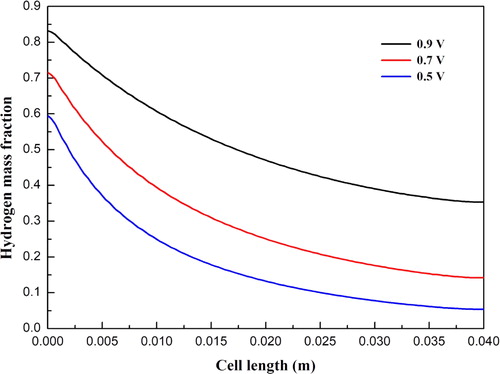
Figure 4. Water mass fraction distribution at the anode diffusion layer and functional layer interface under different operating voltages.
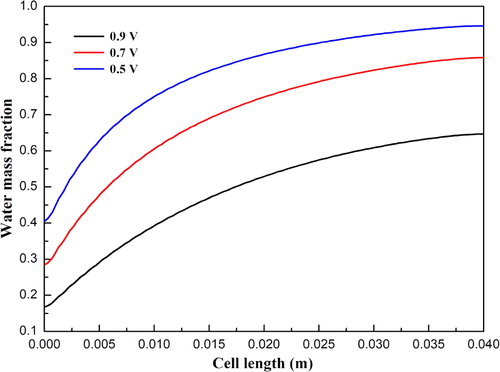
Figure 5. Oxygen mass fraction distribution at the cathode diffusion layer and functional layer interface under different operating voltages.
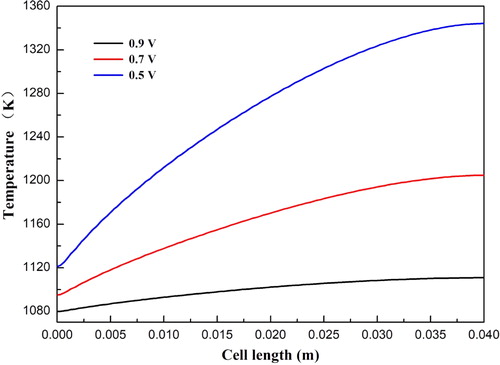
The temperature distributions at cell voltages 0.9, 0.7, and 0.5 V are shown in . For all three cases, the minimum temperature appears at the cell inlet region and the maximum temperature occurs at the cell outlet region. In addition, the local temperature distribution at the anode diffusion layer and functional layer interface is presented in . Temperature is nonlinearly increased along the cell length direction for all three cases. The temperature is increased from 1079.8 to 1110.8 K, from 1094.9 to 1204.8 K, and from 1120.9 to 1344.2 K at the cell voltage 0.9, 0.7, and 0.5 V, respectively. The temperature difference between the inlet temperature (x = 0 m) and the outlet temperature (x = 0.4 m) is greatly increased with decreasing cell voltage.
Figure 6. Temperature distribution of SOFCs: (a) operating cell voltage 0.9 V; (b) operating cell voltage 0.7 V; (c) operating cell voltage 0.5 V.
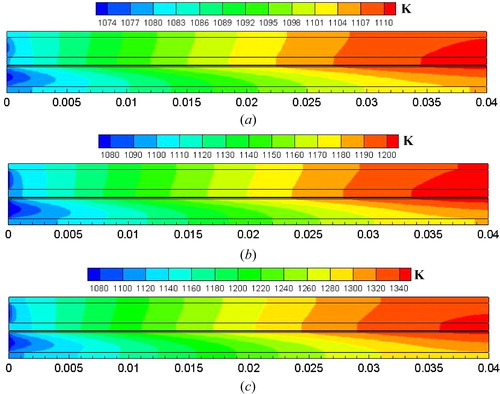
Figure 7. Temperature distribution at the anode diffusion layer and functional layer interface under different operating voltages.
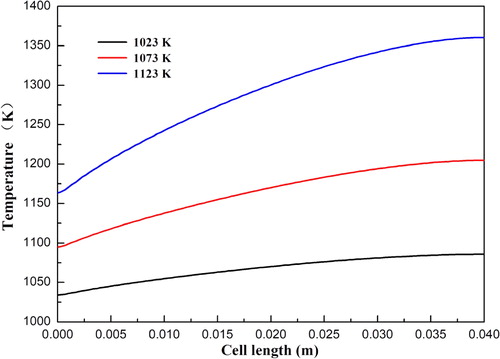
In the following section, the effects of operating temperature, flow direction, anode velocity, and cathode velocity on the temperature distribution are systematically investigated. The cell operating voltage is fixed at 0.7 V in the corresponding numerical simulations. The temperature distributions of SOFCs at an operating temperature varying from 1023 to 1123 K are shown in . It is clearly seen that both the local temperature magnitude and the temperature variation along the cell length direction are gradually increased with increasing operating temperature. The temperature is increased from 1034.0 to 1085.8 K, from 1094.9 to 1204.8 K, and from 1163.4.9 to 1360.4 K at the cell operating temperatures 1023, 1073, and 1123 K, respectively. The corresponding current densities for the three cases at the cell voltage 0.7 V are 0.37, 0.69, and 1.17 A/cm2, respectively. It is concluded that the cell performance is significantly improved by the increasing operating temperature. In addition, the corresponding temperature inside the fuel cells is greatly increased.
Figure 8. Temperature distribution at the anode diffusion layer and functional layer interface under different operating temperature.
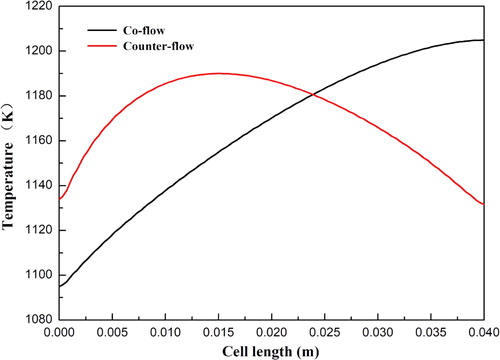
Generally, three different flow arrangements including coflow, counter-flow, and crossflow are used in SOFCs. In this study, a comparison between the coflow and counter-flow arrangements is performed to study the heat transport characteristics in SOFCs. The temperature distributions of SOFCs with coflow and counter-flow arrangements are shown in . The anode flow channel and cathode flow channel have the same flow direction in the coflow arrangement. On the other hand, the flow direction in the cathode flow channel is opposite to the anode flow channel in the counter-flow arrangement. It is observed that a lower maximum temperature and a higher minimum temperature are obtained by the SOFC with counter-flow arrangement compared to the SOFC with coflow arrangement. The maximum temperature of the two cases is 1204.8 and 1189.9 K, respectively. The minimum temperature of coflow arrangement is 1094.9 K, while that of counter-flow arrangement is 1131.6 K. For the coflow arrangement, the temperature is monotonically increased along the cell length direction. For the counter-flow arrangement, the temperature is firstly increased and then gradually decreased along the cell length direction. The maximum temperature appears around the x = 0.15 m position, which is at the upstream of the anode electrode. The corresponding current densities for the two cases at the cell voltage 0.7 V are 0.69 and 0.70 A/cm2, respectively. The overall cell performance is not affected by the flow arrangements, while the local temperature distribution is significantly changed.
Figure 9. Temperature distribution at the anode diffusion layer and functional layer interface under different flow arrangements.
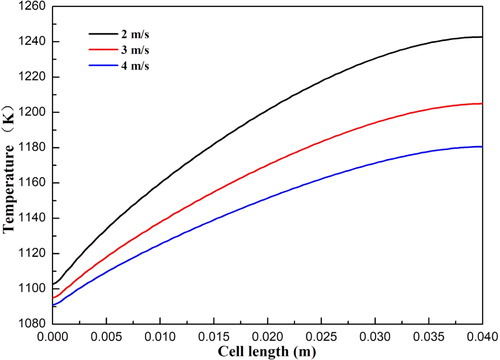
shows the temperature distributions of SOFCs with anode flow velocity varying from 0.2 to 0.4 m/s. It can be seen that the temperature variation between the different cases is very small. This indicates that the effect of the anode flow velocity on temperature is negligible. The corresponding current densities for the three cases at the cell voltage 0.7 V are 0.68, 0.69, and 0.70 A/cm2, respectively. The effect of the cathode flow velocity on the temperature distributions of SOFCs is also examined and shown in . The velocity varies from 2 to 4 m/s with an interval of 1 m/s. It is observed that the local temperature is considerably decreased with increasing velocity, especially the maximum temperature. The corresponding current densities for the three cases at the cell voltage 0.7 V are 0.69, 0.69, and 0.70 A/cm2, respectively. The corresponding maximum temperature for the three cases at the cell voltage 0.7 V are 1242.7, 1204.8, and 1180.5 K, respectively. This indicates that the local temperature can be greatly decreased with increasing air flow velocity.
Figure 10. Temperature distribution at the anode diffusion layer and functional layer interface under different anode flow velocities.
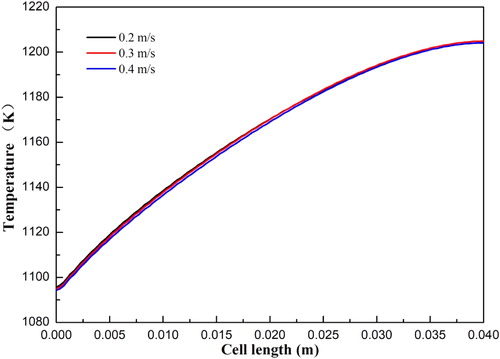
Figure 11. Temperature distribution at the anode diffusion layer and functional layer interface under different cathode flow velocities.
4. Conclusions
In this study, a two-dimensional, nonisothermal, steady-state model was applied to investigate the heat and mass transport characteristics of SOFCs. The mass, momentum, species, temperature, and charge conservation equations were solved, and the results were analyzed and discussed. The conclusions are as follows:
The temperature is gradually increased along the flow direction, and the temperature is significantly increased with decreasing cell operating voltage. The overall cell performance can be greatly improved by increasing the operating temperature, and the local temperature is also significantly increased. The flow arrangements have strong impact on the local temperature distribution, and a lower maximum temperature is provided by the counter-flow arrangement. The effect of anode flow velocity on temperature distribution can be ignored, while the temperature is gradually decreased with increasing cathode flow velocity.
| Nomenclature | ||
| a | = | effective surface area, m–1 |
| c | = | mole concentration, mol m–3 |
| cp | = | specific heat, J kg–1 K–1 |
| d | = | diameter, m |
| D | = | diffusivity, m2 s–1 |
| F | = | Faraday constant, 96485 C mol–1 |
| j | = | volumetric current density, A m–3 |
| k | = | thermal conductivity, W m–1 K–1 |
| K | = | permeability, m2 |
| M | = | molecular weight, kg mol–1 |
| P | = | pressure, Pa |
| R | = | universal gas constant, 8.314 J mol–1 K–1 |
| S | = | source term |
| T | = | temperature, K |
| = | velocity vector, m/s | |
| U | = | thermodynamic equilibrium potential, V |
| V | = | voltage, V |
| Y | = | mass fraction |
| Greek Symbols | ||
| α | = | transfer coefficient |
| γ | = | concentration dependence |
| ε | = | porosity |
| η | = | over-potential, V |
| μ | = | dynamic viscosity, Pa s |
| ρ | = | density, kg m–3 |
| σ | = | electronic/ionic conductivity, S m–1 |
| τ | = | tortuosity |
| ϕ | = | potential, V |
| Superscripts and Subscripts | ||
| a | = | anode |
| c | = | cathode |
| e | = | electron |
| eff | = | effective |
| f | = | fluid |
| g | = | gas |
| i | = | ith species/ion |
| mass | = | mass equation |
| mom | = | momentum equation |
| p | = | pore |
| ref | = | reference |
| s | = | solid |
| T | = | temperature equation |
Additional information
Funding
References
- O. Z. Sharaf, and M. F. Orhan, “An overview of fuel cell technology: Fundamentals and applications,” Renew. Sust. Energ. Rev., vol. 32, pp. 810–853, 2014. DOI: 10.1016/j.rser.2014.01.012.
- S. Mekhilef, R. Saidur, and A. Safari, “Comparative study of different fuel cell technologies,” Renew. Sust. Energ. Rev., vol. 16, no. 1, pp. 981–989, 2012. DOI: 10.1016/j.rser.2011.09.020.
- Z. Z. Li, L. Chen, and W. Q. Tao, “Molecular dynamics simulation of water permeation through the nafion membrane,” Numer. Heat Transfer A, vol. 70, no. 11, pp. 1232–1241, 2016. DOI: 10.1080/10407782.2016.1230424.
- L. Chen, Y. L. He, and W. Q. Tao, “The temperature effect on the diffusion processes of water and proton in the proton exchange membrane using molecular dynamics simulations,” Numer. Heat Transfer A, vol. 65, no. 3, pp. 216–228, 2014. DOI: 10.1080/10407782.2013.784677.
- L. Chen, H. Luan, Y. L. He, and W. Q. Tao, “Effects of roughness of gas diffusion layer surface on liquid water transport in micro gas channels of a proton exchange membrane fuel cell,” Numer. Heat Transfer A, vol. 62, no. 4, pp. 295–318, 2012. DOI: 10.1080/10407782.2012.670586.
- S. A. Li, and B. Sunden, “Numerical Analysis on thermal performance of cooling plates with wavy channels in PEM fuel cells,” Int. J. Numer. Methods Heat Fluid Flow, vol. 28, no. 7, pp. 1684–1697, 2018. DOI: 10.1108/HFF-01-2018-0034.
- C. L. Han, and Z. Q. Chen, “Numerical simulation for the effect of vaporization intensity in membrane on the performance of pem fuel cell,” Numer. Heat Transfer A, vol. 73, no. 3, pp. 177–194, 2018. DOI: 10.1080/10407782.2017.1421370.
- S. A. Li, J. L. Yuan, G. N. Xie, and B. Sunden, “Numerical investigation of transport phenomena in high temperature proton exchange membrane fuel cells with different flow field designs,” Numer. Heat Transfer A, vol. 72, no. 11, pp. 807–820, 2017. DOI: 10.1080/10407782.2017.1412221.
- S. A. Li, and B. Sunden, “Numerical study on thermal performance of non-uniform flow channel designs for cooling plates of PEM fuel cells,” Numer. Heat Transfer A, vol. 74, no. 1, pp. 917–930, 2018. DOI: 10.1080/10407782.2018.1486642.
- Y. D. Hsieh, Y. H. Chan, and S. S. Shy, “Effects of pressurization and temperature on power generating characteristics and impedances of anode-supported and electrolyte-supported planar solid oxide fuel cells,” J. Power Sources, vol. 288, pp. 1–10, 2015. DOI: 10.1016/j.jpowsour.2015.08.080.
- M. Yan, P. Fu, X. Li, M. Zeng, and Q. W. Wang, “Mass transfer enhancement of a spiral-like interconnector for planar solid oxide fuel cells,” Appl. Energy, vol. 160, pp. 954–964, 2015. DOI: 10.1016/j.apenergy.2015.03.115.
- M. M. Hussain, X. Li, and I. Dincer, “Mathematical modeling of planar solid oxide fuel cells,” J. Power Sources, vol. 161, no. 2, pp. 1012–1022, 2006. DOI: 10.1016/j.jpowsour.2006.05.055.
- M. Ni, M. K. H. Leung, and D. Y. C. Leung, “Micro-scale modelling of solid oxide fuel cells with micro-structurally graded electrodes,” J. Power Sources, vol. 168, no. 2, pp. 369–378, 2007. DOI: 10.1016/j.jpowsour.2007.03.005.
- J. X. Shi, and X. J. Xue, “CFD analysis of a symmetrical planar SOFC with heterogeneous electrode properties,” Electrochim. Acta, vol. 55, no. 18, pp. 5263–5273, 2010. DOI: 10.1016/j.electacta.2010.04.060.
- M. Andersson, J. Yuan, and B. Sunden, “SOFC cell design optimization using the finite element method based CFD approach,” Fuel Cells, vol. 14, no. 2, pp. 177–188, 2014. DOI: 10.1002/fuce.201300160.
- I. Khazaee, and A. Rava, “Numerical simulations of the performance of solid oxide fuel cell with different flow channel geometries,” Energy, vol. 119, pp. 235–244, 2017. DOI: 10.1016/j.energy.2016.12.074.
- V. A. Danilov, and M. O. Tade, “A CFD-based model of a planar SOFC for anode flow field design,” Int. J. Hydrogen Energy, vol. 34, no. 21, pp. 8998–9006, 2009. DOI: 10.1016/j.ijhydene.2009.08.073.
- M. Canavar, and B. Timurkutluk, “Design and fabrication of novel anode flow-field for commercial size solid oxide fuel cells,” J. Power Sources, vol. 346, pp. 49–55, 2017. DOI: 10.1016/j.jpowsour.2017.02.020.
- M. Saied, K. Ahmed, M. Nemat-Alla, M. Ahmed, and M. Ei-Sebaie, “Performance study of solid oxide fuel cell with various flow field designs: Numerical study,” Int. J. Hydrogen Energy, vol. 43, no. 45, pp. 20931–20946, 2018. DOI: 10.1016/j.ijhydene.2018.09.034.
- Q. W. Shen, L. N. Sun, and B. W. Wang, “Numerical simulation of the effects of obstacles in gas flow fields of a solid oxide fuel cell,” Int. J. Electrochem. Sci., vol. 14, pp. 1698–1712, 2019. DOI: 10.20964/2019.02.11.
- C. Yang, G. G. Yang, D. T. Yue, J. L. Yuan, and B. Sunden, “Computational fluid dynamics model development on transport phenomena coupling with reactions in intermediate temperature solid oxide fuel cells,” J. Renew. Sustain. Energy, vol. 5, no. 2, pp. 021420, 2013. DOI: 10.1063/1.4798789.
- M. Ni, Z. P. Shao, and K. Y. Chan, “Modeling of proton-conducting solid oxide fuel cells fueled with syngas,” Energies, vol. 7, no. 7, pp. 4381–4396, 2014. DOI: 10.3390/en7074381.
- V. Menon, A. Banerjee, J. Dailly, and O. Deutschmann, “Numerical analysis of mass and heat transport in proton-conducting SOFCs with direct internal reforming,” Appl. Energy, vol. 149, pp. 161–175, 2015. DOI: 10.1016/j.apenergy.2015.03.037.
- A. Selimovic, M. Kemm, T. Torisson, and M. Assadi, “Steady state and transient thermal stress analysis in planar solid oxide fuel cells,” J. Power Sources, vol. 145, no. 2, pp. 463–469, 2005. DOI: 10.1016/j.jpowsour.2004.11.073.
- S. Zeng et al., “Thermal stress analysis of a planar anode-supported solid oxide fuel cell: Effects of anode porosity,” Int. J. Hydrogen Energy, vol. 42, no. 31, pp. 20239–20248, 2017. DOI: 10.1016/j.ijhydene.2017.05.189.
- X. Fang, J. Zhu, and Z. Lin, “Effects of electrode composition and thickness on the mechanical performance of a solid oxide fuel cell,” Energies, vol. 11, no. 7, pp. 1735, 2018. DOI: 10.3390/en11071735.
- H. Mahcene, H. B. Moussa, H. Bouguettaia, D. Bechki, S. Babay, and M. S. Meftah, “Study of species, temperature distributions and the solid oxide fuel cells performance in a 2-D model,” Int. J. Hydrogen Energy, vol. 36, no. 6, pp. 4244–4252, 2011. DOI: 10.1016/j.ijhydene.2010.07.075.
- A. Yahya, R. Rabhi, H. Dhahri, and K. Slimi, “Numerical simulation of temperature distribution in a planar solid oxide fuel cell using lattice Boltzmann method,” Powder Technol., vol. 338, pp. 402–415, 2018. DOI: 10.1016/j.powtec.2018.07.060.
- J. M. Park, D. Y. Kim, J. D. Baek, Y. Yoon, P. Su, and S. Lee, “Effect of electrolyte thickness on electrochemical reactions and thermo-fluidic characteristics inside a SOFC unit cell,” Energies, vol. 11, no. 3, pp. 473, 2018. DOI: 10.3390/en11030473.
- S. Lee et al., “The effect of fuel utilization on heat and mass transfer within solid oxide fuel cells examined by three-dimensional numerical simulations,” Int. J. Heat Mass Transf., vol. 97, pp. 77–93, 2016. DOI: 10.1016/j.ijheatmasstransfer.2016.02.001.
- Z. Zhang et al., “Three-Dimensional CFD Modeling of Transport Phenomena in a Cross-Flow Anode-Supported Planar SOFC,” Energies, vol. 7, no. 1, pp. 80–98, 2013. DOI: 10.3390/en7010080.