
 ?Mathematical formulae have been encoded as MathML and are displayed in this HTML version using MathJax in order to improve their display. Uncheck the box to turn MathJax off. This feature requires Javascript. Click on a formula to zoom.
Abstract
Transient response of the pinch point is crucial to the evaluations of the recuperator efficiency. A reheat and recompression cycle dynamic simulation system for supercritical CO2 is built, and a transient segmented model is developed to explore the dynamic characteristics of the recuperators. The operating conditions including inlet mass flowrate, temperature and pressure of the low temperature recuperator (LTR) change dramatically with the withdraw-mass variation, which causes different response characteristics of the pinch point. The pinch point gradually transfers from the cold end to the hot end of the LTR as the mass flowrate decreases. The higher pinch-point temperature difference leads to lower heat exchanger effectiveness, and the internal pinch point greatly weakens the recuperator performance. A new prediction model is proposed to quickly determine the pinch point location and analyze the operating conditions prone to cause internal pinch point. The range of split ratio in which the internal pinch point exists in the LTR is obtained. The lower-limit of split ratio variation is sensitive to the high- and low-pressures, the isentropic efficiency of the compressor, and the outlet temperature of the precooler, while the upper-limit of split ratio is only related to the pressures of the recuperator.
1. Introduction
The supercritical CO2 (S-CO2) Brayton cycle, which employs CO2 as the working fluid with the temperature and pressure levels higher than those at the critical point, is currently recognized as one of the advanced and efficient power cycles due to its superiorities: super compactness and high thermal power efficiency [Citation1]. S-CO2 Brayton cycle is promising for use in various energy conversion areas, such as coal power [Citation2], IV generation nuclear power [Citation3], geothermal power [Citation4], solar thermal power generations [Citation5] and thermal energy storage [Citation6].
The expansion ratio of the S-CO2 Brayton cycle is quite low so as to keep CO2 in supercritical region. Thus, the turbine should have very high outlet temperature. Considering that the compressor has quite low outlet temperature, the cycle should recuperate the heat as much as possible to avoid the thermal loss. Thus, the recuperator plays a significant role in improving the S-CO2 Brayton cycle efficiency. Currently, the most favored recuperator type is the printed-circuit heat exchanger (PCHE) with high compactness and super heat exchanger effectiveness [Citation7]. However, due to the dramatic change of the specific heat of CO2 in the pseudo-critical region [Citation8], the recuperator may have an internal pinch point [Citation9] which can weaken the heat exchanger performance and may even lead to nonphysical design. When the internal pinch point occurs, the mismatch of specific heats of the hot- and cold-side fluids can increase the overall temperature difference, leading to decrease in the heat exchanger effectiveness [Citation10].
It is believed that an accurate calculation of the pinch point in the recuperator is critical for evaluating the efficiencies of the recuperators. To identify the location of the pinch point, many investigations [Citation11–13] have been carried out, and most of them have employed the segmented model to determine the internal pinch point location by calculating the temperature profiles in the recuperators. Indeed, more intensive calculations are needed by using the segmental model to determine whether and where the pinch point exists inside the recuperator. The approach based on the segmented model is very time-consuming and inefficient. It is thus urgent to propose an approach to quickly determine the pinch point location in the design process. Ladislav et al. [Citation12] located the zero pinch point in the analysis of an S-CO2 recuperator by establishing an approximate relationship which is only a function of pressures on the hot- and cold-sides. However, the method is of low accuracy and not applicable to the cases of different mass fractions. Son et al. [Citation13] proposed an accelerated calculation methodology by developing a new definition of the heat exchanger efficiency based on the concept of zero internal pinch point which can be accurately retrieved by employing artificial neural networks. In addition, Kim et al. [Citation14] stated that the pinch point temperature method was more effective than the effectiveness method in the thermal efficiency analysis.
Under variable load conditions, the temperature difference and the location of the pinch point may change dynamically. If the pinch point moves to the inside of the recuperator, the heat exchanger effectiveness will be decreased. Most of the studies on recuperators focus on the thermal hydraulic characteristics under steady conditions [Citation15–18] rather than under transient conditions. In addition, most of the dynamic simulation work has been conducted on the cycle performance, load following characteristics and frequency modulation characteristics of the S-CO2 cycle under different load following control strategies [Citation19–22]. Bian et al. [Citation19] compared the effects of different valve control schemes on the open-loop dynamic characteristics of a S-CO2 Brayton cycle in the views of the safety performance as well as the thermodynamic response characteristics by establishing a dynamic model. Liese et al. [Citation20] analyzed the dynamic performance of the S-CO2 Brayton cycle in the operations of warm shutdown, subsequent startup and the fast ramped-setpoint load-following, based on the improved model for a 10 MW S-CO2 Brayton cycle pilot plant. Ma et al. [Citation22] proposed a new synergistic control method combining the mass flowrate control scheme and the temperature control scheme under the practical micro-grid fluctuating load, aiming to balance the power generation efficiency and power generation stability. However, only a few studies have paid attention to the transient response of the recuperators. Jiang et al. [Citation23] built one-dimensional steady-state and dynamic models for the PCHE in S-CO2 cycles, and the parameter optimization was performed based on the steady-state model while cycle performance evaluation and transient behavior prediction were made based on the dynamic model. Chen et al. [Citation24] explored the performance variation of the heat exchanger in a solar tower power plant by the dynamic model for PCHE. Ma et al. [Citation25] explored the transient responses of the overall heat flux, the outlet temperature and the heat transfer coefficient of the PCHE by CFD simulations, and based on the CFD data, the performance of the PCHE prediction model was built by backward propagation (BP) neural network. Nevertheless, few scholars have paid attention to the pinch point response characteristics of the recuperator under load varying conditions. The transient characteristics of the pinch point in the recuperators and the related effects on the efficiency of recuperators need to be further studied.
To fill the gap, this article studies the dynamic characteristics of the location and the temperature difference of pinch point, and compares dynamic variations of heat exchanger effectiveness under different load following control strategies including mass-flowrate-, pressure- and temperature-variable load control strategies. Besides, a prediction model is proposed to quickly judge whether there is an internal pinch point in the design process and obtain a split ratio range within which the internal pinch point exists. Then, the effects of the key parameters including the cold- and hot-side pressures of the low temperature recuperator (LTR), the outlet temperature of the precooler, and the isentropic efficiency of the compressor on the split ratio range are analyzed. The remaining sections are arranged as follows: Section 2 describes single reheat and recompression arrangement of S-CO2 cycle and its dynamic model; Section 3 describes the dynamic modeling and validation for heat exchangers, turbo-machinery and control schemes; Section 4 proposes the internal pinch point location prediction model; Section 5 presents the performance of S-CO2 Brayton cycle under off-design conditions, and explores the dynamic performance of LTR, and analyzes the operating conditions prone to cause internal pinch point through the proposed prediction model; Section 6 gives a summary of this work.
2. Configuration and simulation model of S-CO2 Brayton cycle
In this work, a reheat and recompression S-CO2 Brayton cycle is selected as the research object. As shown in , the S-CO2 is compressed by the main-compressor (MC) and then flows into the cold sides of the LTR and the high temperature recuperator (HTR) in turn. It is heated by the expanded exhaust S-CO2 from Low Pressure Turbine (LPT). Then, the S-CO2 after heating in the boiler will do work in the High-Pressure Turbine (HPT) and S-CO2 will continue to perform work in the Low-Pressure Turbine (LPT) after the reheat process. Then the S-CO2 successively flows into the hot sides of the HTR and LTR. After that, the S-CO2 is split into two streams: One stream flowing to the inlet of MC after the cooling process in the precooler (PC), while the other going to the cold side of HTR after compression by the re-compressor (RC). The inventory control has the advantage of yielding higher thermal efficiency than other control schemes, so it is promising to employ generally to ensure the high cycle efficiency during the load variation process. In this article, an inventory vessel (IV) is installed to withdraw and add the mass on the high- and low-pressure sides, namely the outlet and inlet of MC. shows the design parameters of the S-CO2 Brayton cycle of 600 MWe [Citation26]. Though there is still no actual S-CO2 cycle on level of 600 MWe, a volume of numerical investigation has been carried out on the S-CO2 cycle on this level [Citation26–30]. The minimum pinch point temperature difference of heat exchanger is selected as 5 °C in engineering to ensure the reasonable effectiveness and capital cost. To obtain higher cycle efficiency, the optimal recompression split ratio of a value of about 0.318 is selected in this work [Citation14]. The temperature-entropy diagram of the cycle is shown in . The labels of the state points in are the same as those in .
Figure 1. The reheat and recompression arrangement of S-CO2 Brayton cycle.
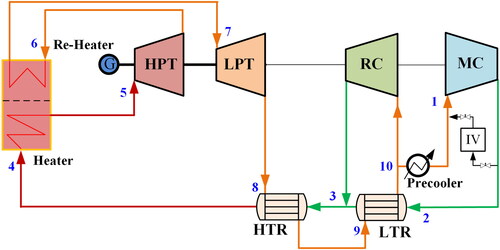
Figure 2. Temperature-entropy diagram of a reheat and recompression S-CO2 Brayton cycle.
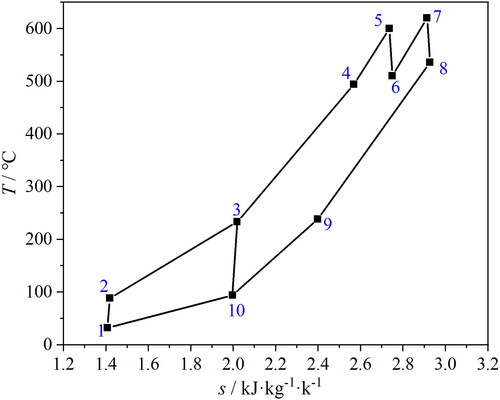
Table 1. Design parameters of the base cycle [Citation26].
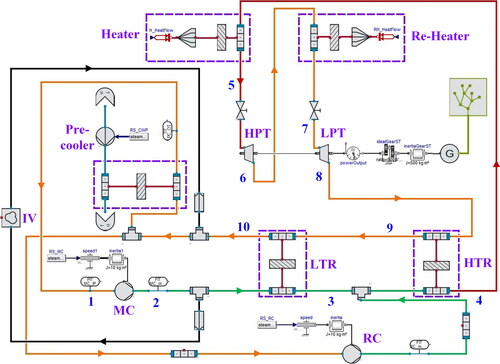
A dynamic simulation model for the reheat and recompression S-CO2 cycle Brayton system is built as shown in . In the figure, the labels of the state points and the stream colors are the same as those in . The dynamic models for the heat exchangers, turbomachines and power grid are developed. In addition, five control schemes are built to maintain the outlet temperature of PC, the inlet temperature of HT and RT, the outlet pressure of RT and the split ratio of the cycle. Considering the accuracy and time cost of calculation, the residuals for the calculation in this article is selected as 1 × 10⁻⁵.
Figure 3. S-CO2 recompression Brayton dynamic simulation system.
3. Thermal dynamic model and validation
3.1. Dynamic modeling of recuperator
The regeneration process is essential to improve the efficiency of S-CO2 Brayton cycle [Citation22]. The recuperators of large volume and heat capacity would have large thermal inertia, leading to significant delay of thermal dynamic parameters under dynamic conditions. presents the design parameters of HRT and LTR [Citation26].
Table 2. Geometrical parameters of the HTR and LTR [Citation26].
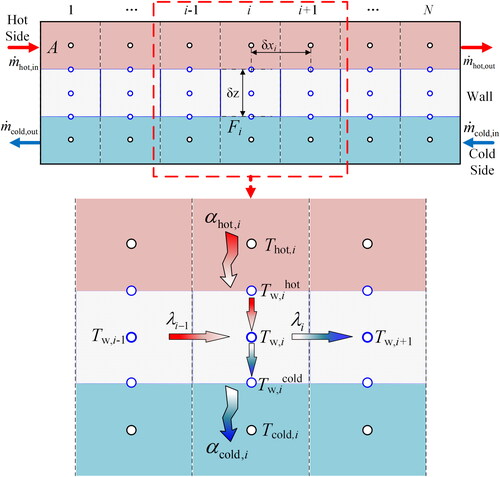
The recuperator is discretized in the length direction to fully consider the strong variations of the physical properties of S-CO2, as shown in . The segmented model can increase the calculation accuracy by capturing the dramatic changes of physical properties of S-CO2 in the pseudo-critical region. In this article, PC, LTR and HTR are modeled by the unsteady segmented model. In this work, the discretization number of the recuperator is finally selected as 100 based on an independence test.
Figure 4. Segmented model for PCHE with semicircular channels.
For the fluids in the channel, the unsteady conservation equations of mass, momentum and energy can be expressed as:
(1)
(1)
(2)
(2)
(3)
(3)
An unsteady heat transfer model for the solid wall is built to consider the inertia of the solid wall. Based on an energy balance, the change rate of the internal energy of the wall is caused by the convection heat transfer by the fluids of hot and cold sides and the heat conduction in axial direction.
(4)
(4)
(5)
(5)
(6)
(6)
To solve the momentum and energy conservation equations, the Gnielinski correlation [Citation31] is used to calculate the heat transfer coefficient.
(7)
(7)
Here the Colebrook correlation [Citation32] valid in the turbulent regime is used to predict the Fanning factor.
(8)
(8)
(9)
(9)
(10)
(10)
where C1 and C2 are two empirical factors of 1.2 and 1.1, respectively [Citation33].
3.2. Turbo-machinery modeling
The isentropic efficiencies of the compressor and turbine should not be assumed to be constant under off-design conditions, since the isentropic efficiencies of turbomachines can vary significantly under off-design conditions. Thus, it is needed to adapt the efficiency calculation formula to the off-design conditions. Thus, the models of compressor and turbine considering the influences of flow rate, pressure, temperature and rotating speed [Citation34, Citation35] are employed.
The isentropic efficiency of the compressor, ηC, is related to the corrected mass flow rate and the corrected relative rotational speed Nr.
(11)
(11)
(12)
(12)
(13)
(13)
The relationship between mass flow rate and pressure ratio for the compressor is as follow:
(14)
(14)
(15)
(15)
(16)
(16)
(17)
(17)
In this work, p = 0.36 and q = 1.06 for large axial flow turbines [Citation34].
The isentropic efficiency of turbine, ηT, is also related to the corrected mass flow rate and the corrected relative rotational speed Nr.
(18)
(18)
The mass flow characteristics of the turbine is approximately described by a modified formula. The temperature, rotating speed, mass flowrate and expansion ratio are interrelated as follows.
(19)
(19)
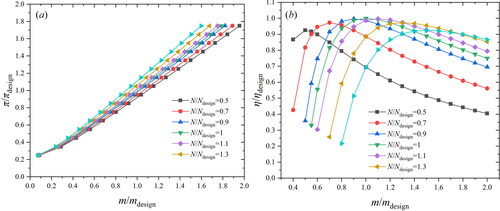
The characteristics performance curves of the compressor and the turbine are shown in and , respectively. In , the efficiency curves gradually flatten but the compression ratio curves gradually steepen, as the relative speed of the compressor increases. The rotating speed and the mass flowrate of the compressor should be correlated positively to obtain stable operation. In , the expansion ratio and the flow rate of turbine should be positively correlated under the load variation condition, as the rotating speed of the turbine is generally maintained in 3000 rpm.
Figure 5. Compressor characteristics curves: (a) relative compression ratio; (b) relative efficiency.
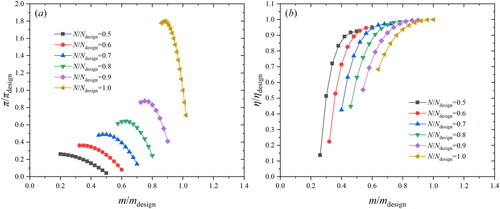
Figure 6. Turbine characteristics curves: (a) relative expansion ratio; (b) relative efficiency.
3.3. Controller and valves
All controllers are implemented as proportional-integral (PI) controllers. For the system in which variable X has specific relationship with variable Y, by adjusting the value of X, the value of Y can be forced to approach the target Ytarget. The generic formulation of PI controllers can be expressed as:
(20)
(20)
(21)
(21)
(22)
(22)
where e(t) is the error term at current time between the variable Y and its target Ytarget, dX(t) is the change of variable X, while KP and KIP are proportional gain constant and integral proportional gain constant, respectively.
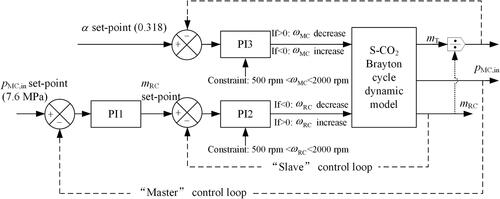
As is known, the minimum pressure in the S-CO2 Brayton cycle should be controlled higher than the critical pressure of CO2. Besides, the split ratio could be maintained in variation conditions. shows the control schemes for keeping the pressure ratio and the split ratio in the present study. A cascaded control scheme, being a compromise of a master-slave controller pair, is designed for the pressure control. The master controller PI1 determines the set-point for the mass flowrate of re-compressor (mRC) to obtain the pressure (pMC,in) set-point. The slave controller PI2 tracks the mRC set-point proposed by PI1 by controlling the rotating speed of the re-compressor. The feedback control loop (PI2) is constrained by the range of rotating speed of the re-compressor. The split ratio control is designed as a single feedback control system with the controller PI3 to achieve the set-value of the split ratio. In addition, three additional control loops are used to achieve the fluid temperatures at the outlets of PC, main-heater and re-heater.
Figure 7. Pressure and split ratio control schemes.
As the main actuator for control, the valve is used for bypass control, turbine throttling control and inventory control [Citation19]. The regulating valve mainly acts as a resistance part, and its resistance on the flow channel is mainly considered in modeling. At a small pressure ratio, the flowrate, pressure drop and valve opening of the valve have the relationship as follows [Citation36].
(23)
(23)
At the large pressure ratio, such as bypass valves, choke might happen, thus in this case the orifice plate flow should be modeled as follows [Citation36].
(24)
(24)
where Cv and Cd are the valve construction coefficient and the discharge coefficient, respectively.
3.4. Validation
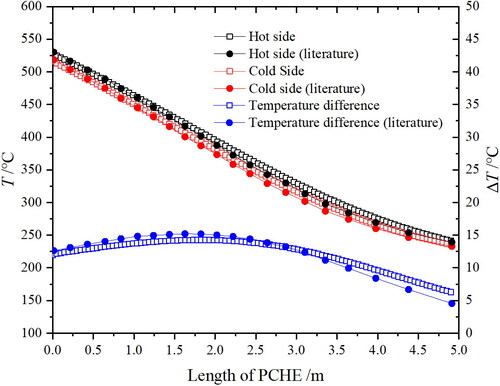
As shown in , to verify the reliability and accuracy of the proposed model, the calculated results are compared with the data from literatures. The steady-state temperature profiles calculated by the proposed model are compared with the data in the work by Xi’an Thermal Power Research Institute Co. Ltd [Citation26]. The results indicate that the maximum deviation of the temperature difference is less than 5 °C.
Figure 8. Temperature profiles on the cold- and hot-side, and temperature difference in the PCHE.
The calculation results of the S-CO2 cycle in steady-state are compared with the Ref. [Citation26]. As shown in , the boiler output heat, HTR duty, LTR duty, PC duty and cycle efficiency are compared with the literature data, and the largest relative deviation is about 3%.
Table 3. Comparison of the calculation results and literature data of S-CO2 cycle [Citation26].
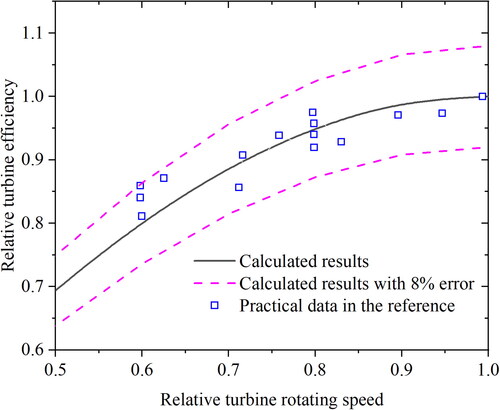
In addition, the model of the turbomachinery is verified at the off-design conditions, as shown in . The turbine efficiency variation with the rotational speed is compared with the practical data [Citation36]. The overall deviation is smaller than 8% for the relative rotating speed range of 0.5-1.0 which indicates that the model of the turbomachinery is reliable under off-design working conditions.
Figure 9. Comparison in the relative turbine efficiency variation with relative rotating speed.
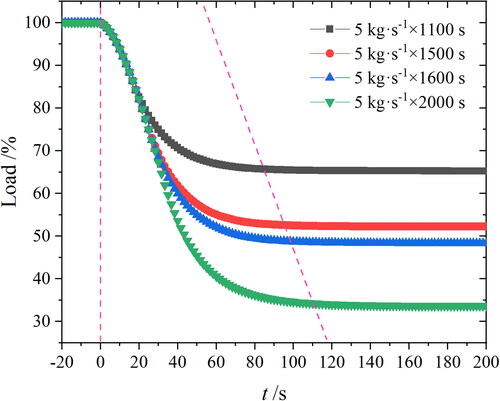
To verify the control schemes, the transient responses of the mass flowrate and the minimal pressure with the sinusoidally varying set values are simulated, as shown in . Both parameters can well follow the variations of the set values. Therefore, the control schemes for the pressure and split ratio are effective in this work. presents the cycle load variation with time controlled by the proposed control schemes under different withdraw-mass conditions. Obviously, the inventory withdraw mass can decrease the cycle load effectively and the proposed control schemes can make the cycle load gradually to transfer from 100% to the corresponding steady-state load.
Figure 10. Fluctuations of mass flow (a) and pressure (b) following with set values.
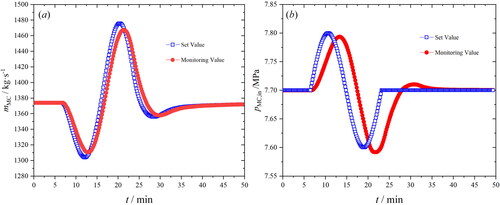
Figure 11. Variations of the S-CO2 Brayton cycle load under different inventory withdraw-mass.
4. Internal pinch point location prediction model
A prediction model is developed to quickly judge whether there is an internal pinch point in the design process. By using this model, the range of split ratio where the internal pinch point exists can be determined, so that the internal pinch point can be avoided by adjusting the operating conditions.
First, the specific heat cp is fitted as a binary function of pressure p and temperature T.
(25)
(25)
Then, a function of cp of the cold- and hot-side fluids can be constructed
(26)
(26)
where π is the pressure ratio between the cold- and hot-sides, and α is the split ratio of the S-CO2 Brayton cycle.
(27)
(27)
(28)
(28)
The necessary and sufficient condition for the internal pinch point to occur in the recuperator can be determined as follows:
(29)
(29)
(30)
(30)
(31)
(31)
Based on these, it is easy to predict whether the internal pinch point exists without calculating the heat exchanger by using the segmented model.
The compressor efficiency and the outlet temperature are expressed by the following equations.
(32)
(32)
(33)
(33)
(34)
(34)
5. Results and discussion
5.1. Performance of the S-CO2 Bryton cycle under off-load conditions
shows the effects of the withdraw-mass from the cycle to the inventory vessel on the heat output of the recuperators, the cycle load and the thermal efficiency. As the withdraw-mass increases, the cycle load decreases linearly from 100% to 24.5%, and the cycle efficiency gradually decreases with an increasing decline rate. With the decrease in the cycle load, the LTR heat output dramatically decreases from 728.64 MW to 132.11 MW, while the HTR heat output has a little decrease from 1488.02 MW to 1281.66 MW. presents the mass flowrate, temperature, and pressure parameters under different off-load conditions. As the increase in the withdraw mass, the mass flow rate of HTR decreases, and the pressure parameters including the inlet pressures of MT and RT decrease, and the temperature parameters including the inlet temperatures of LTR and PC decrease, but the inlet temperature of hot side of HTR increases. Besides, the operating conditions including the mass flowrate, the pressure and the inlet temperature of LTR change dramatically with the withdraw-mass variation, which could cause a significant change of the LTR operation. Therefore, it is of great necessity to explore the dynamic response of the pinch point in LTR under varying conditions.
Figure 12. The effects of withdraw-mass from cycle to inventory vessel.
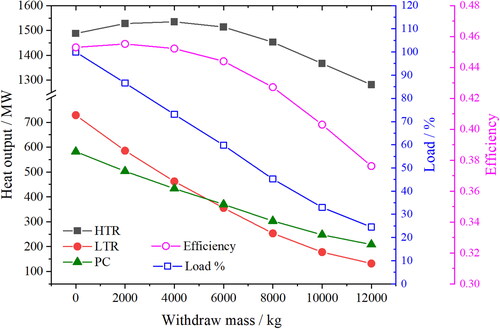
Table 4. Parameters in the cycle in different off-design conditions.
5.2. The dynamic response of the LTR under load varying conditions
5.2.1. Results under mass flowrate varying conditions
During the inventory control process, the mass flowrate of the cold side of LTR will be directly influenced, so the dynamic responses of outlet temperatures of cold- and hot-side fluids, the pinch point temperature difference, the pinch point location and the heat exchanger effectiveness under mass flowrate step-varying conditions are first explored (). The effectiveness of the heat exchanger reflects the ratio of the actual heat transfer effect to the maximum possible heat transfer effect. The calculation formula of heat exchanger effectiveness is as [Citation37]:
(35)
(35)
where the denominator is the maximum possible heat transfer temperature difference value of the fluid in the heat exchanger while the numerator is the largest actual temperature difference value of the cold or hot fluid in the heat exchanger.
Figure 13. Outlet temperature transient variations of cold-side (a) and hot-side (b) fluids under mass flowrate stepwise varying conditions.
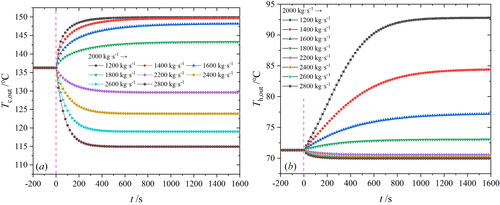
Figure 14. Pinch point location transient variations under mass flowrate stepwise-varying conditions.
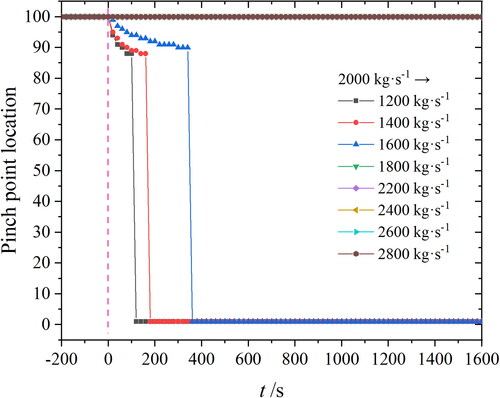
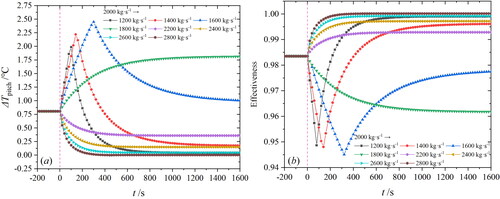
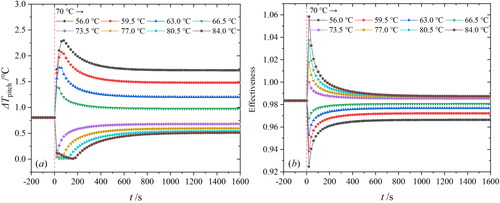
Figure 15. Pinch point temperature difference (a) and heat exchanger effectiveness (b) transient variations under mass flowrate stepwise-varying conditions.
The step-variations of inlet mass flowrate on the cold side from 2000.0 kg·s−1 to the different values are set as the boundary conditions to simulate the load-up and load-down processes. Meanwhile, the inlet mass flowrate on the hot side is 2932.55 kg·s−1, and the inlet temperatures on the hot and cold sides are 150 °C and 70 °C, and the inlet pressures on the hot- and cold-sides are set as 7.8 MPa and 20 MPa. In , both the outlet temperatures on the cold and hot sides increase as the mass flowrates are stepwise decreased under the load-down conditions. In contrast, in the load-up process, as the mass flowrates are stepwise increased, the outlet temperatures of cold side and hot side decrease.
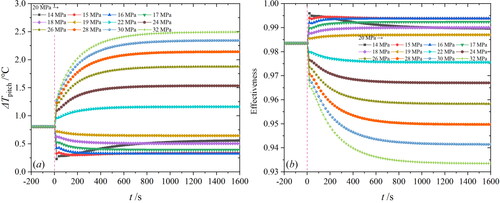
As shown in , when the mass flowrate decreases, the pinch point gradually transfers from the cold end to the hot end of LTR, resulting in the lower increase rate of Tc,out with the stepwise-decreasing mass flowrate and the lower decrease rate of Th,out with the stepwise-increasing mass flowrate. In addition, the variations of pinch point temperature difference and the heat exchanger effectiveness with stepwise-varying mass flowrate are shown in . Obviously, opposite trends between the temperature difference and the effectiveness mean that the higher pinch point temperature difference causes the lower heat exchanger effectiveness. Furthermore, under the conditions that the mass flowrates are decreased from 2000 kg·s−1 to 1200 kg·s−1, 1400 kg·s−1 and 1600 kg·s−1, the heat exchanger efficiencies dramatically decrease to the minimum as the internal pinch point occurs in the LTR. Therefore, the internal pinch point can result in the deterioration of the LTR performance.
5.2.2. Results under pressure varying conditions
Since the inventory control can also lead to variation of the inlet pressure on the cold side of LTR (as shown in ), the dynamic responses of outlet temperature variations of cold- and hot-side fluids, the pinch point location, the pinch point temperature difference and the heat exchanger effectiveness under pressure stepwise-varying conditions are analyzed, as shown in , respectively. The variations of inlet pressure on the cold side from 20 MPa to the different values are set to simulate the pressure variation during the load-up and load-down processes. Meanwhile, the inlet temperatures on the hot and cold sides are 150 °C and 70 °C; The inlet pressure on the hot side is 7.8 MPa, and the inlet mass flowrate on the hot and cold sides are 2932.55 kg·s−1 and 2000.0 kg·s−1, respectively. In , as the pressures are stepwise increased, both the outlet temperatures on both sides increase. In contrast, the outlet temperature on the cold side increases but that on the hot side decreases, when the pressures are stepwise decreased.
Figure 16. Outlet temperature variations of cold-side (a) and hot-side (b) fluids with time under pressure stepwise-varying conditions.
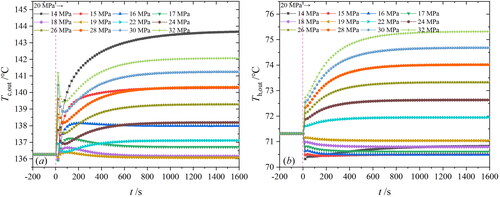
Figure 17. Pinch point location variations with time under pressure stepwise-varying conditions.
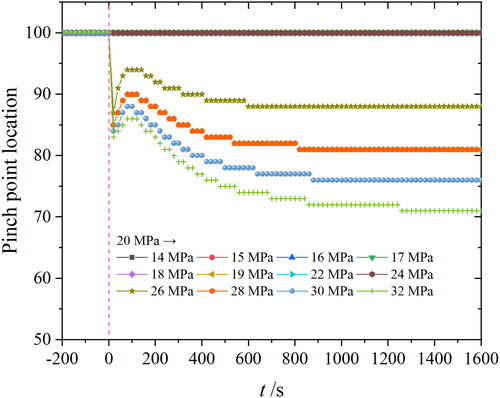
Figure 18. Pinch point temperature difference (a) and heat exchanger effectiveness (b) variations with time under pressure stepwise-varying conditions.
Besides, the variation of pressure can greatly affect the pinch point in the LTR. When the pressures are stepwise increased to 26 MPa, 28 MPa, 30 MPa, and 32 MPa, the pinch points gradually transfer from the cold end to the LTR inside, as shown in . Under these conditions, the performance of LTR has been greatly weakened (). In addition, as shown in , the responses of the pinch point temperature difference also show opposite trends with the effectiveness of LTR. The higher pinch point difference leads to the lower heat exchanger effectiveness.
5.2.3. Results under temperature varying conditions
present the dynamic responses of outlet temperature variations on cold and hot sides, the pinch point location, the pinch point temperature difference and the heat exchanger effectiveness under inlet temperature on the cold side stepwise-varying conditions. The pressures on the hot and cold sides are 7.8 MPa and 20 MPa, and the inlet temperature on the hot side is 150 °C, while the inlet mass flowrate on the hot and cold sides are set as 2932.55 kg·s−1 and 2000.0 kg·s−1, respectively. In , as the temperature is step increased or decreased from 70 °C, both the responses of outlet temperatures on the hot- and cold-sides have the same trends with the temperature boundary condition.
Figure 19. Outlet temperature variation of cold-side (a) and hot-side (b) fluids with time under temperature stepwise-varying conditions.
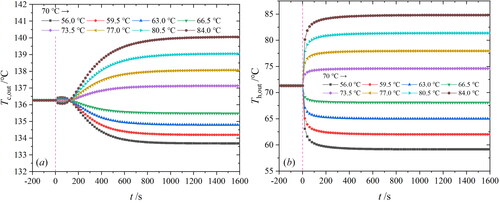
Figure 20. Pinch point location variations with time under temperature stepwise-decreasing (a) and stepwise-increasing (b) conditions.
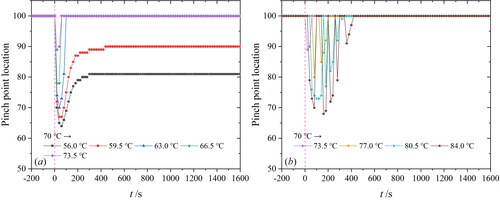
Figure 21. Pinch point temperature difference (a) and heat exchanger effectiveness (b) variations with time under temperature stepwise-varying conditions.
In , the pinch point location gradually transfers from the cold end to the interior of LTR when inlet temperature decreases to 56 °C. On the other hand, the pinch point locations are finally stabilized on the cold end through a period of dynamic oscillation as the inlet temperature increases stepwise. This can be attributed to the oscillation mismatch of the physical properties on both sides due to the dynamic change of temperature. The cases with internal pinch points achieve lower heat exchanger effectiveness. In addition, the responses of the pinch point temperature difference and the effectiveness of LTR also show opposite trends, as evident in . Therefore, the pinch point temperature difference and pinch point location have quite different dynamic response characteristics under different dynamic processes, which have a great impact on the heat exchanger performance. It should be noted that the calculations of heat exchangers in are under the off-design conditions, in which the heat transfer area are relatively more abundant than that under design conditions so as to leading to much lower the pinch point temperature differences and much higher heat exchanger effectiveness.
5.3. Critical split ratio prediction
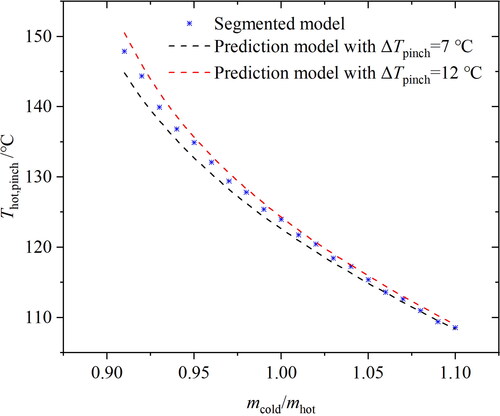
Since the heat exchanger performance is remarkably influenced by the internal pinch point, a prediction model is used to quickly determine the pinch point location and achieve the operating conditions that are likely to cause internal pinch point. compares the obtained hot-side temperatures at the pinch point between the segmented model and the prediction model. As the increase in the mass flow ratio between the cold and hot fluids, the hot temperature at the pinch point decreases. This means that the pinch point gradually moves to the cold end with the increase in the cold mass flowrate. By comparing the predicted and calculated results, it is proved that the prediction model is reliable. Therefore, the proposed prediction model can be used to quickly predict the location of the internal pinch point without performing the complex calculation by the segmental model.
Figure 22. Comparison between the segmented model and the prediction model.
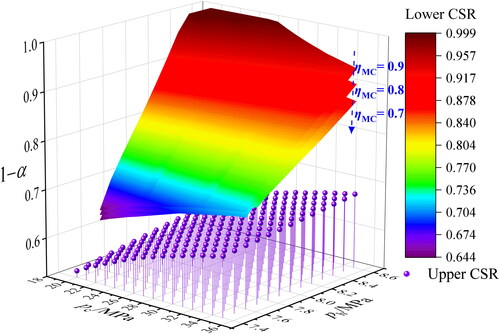
Based on the proposed prediction model, whether the internal pinch point exists or not can be quickly determined once the designing parameters including hot- and cold-side pressures of the recuperator, the isentropic efficiency of the compressor, and the outlet temperature of the precooler are given. Furthermore, the split ratio range with upper- and lower- critical split ratios (CSRs) are presented for different working conditions of the LTR in and . The surfaces and spheres in these figures represent the lower-CSR and the upper-CSR, respectively. The lower-CSR variation is sensitive to the hot- and cold-side pressures, the isentropic efficiency of the compressor, and the outlet temperature of the precooler, while the upper-CSR is only related to the pressures. Besides, the increase in the outlet temperature of the PC, the decrease in the isentropic efficiency of the compressor and the decrease in the hot-side pressure can reduce the probability of the internal pinch point occurrence. As the outlet temperature of PC increases (), the outlet temperature of MC increases significantly. As a result, the cold end temperature of LTR is far away from the quasi-critical zone, and the variation rates of physical properties with temperature are greatly reduced, leading to an increased lower-CSR. In contrast, in , as the decrease of isentropic efficiency of MC, the outlet temperature of MC will slightly increase under a specific pressure ratio. Thereby, the cold end of LTR will be correspondingly far away from the quasi-critical zone, leading to an increased lower-CSR. However, due to the limited temperature rise at the outlet of MC caused by the decreased isentropic efficiency, the increase in the lower-CSR is quite small.
Figure 23. The variations of upper and lower CSRs with the temperature at the outlet of the precooler.
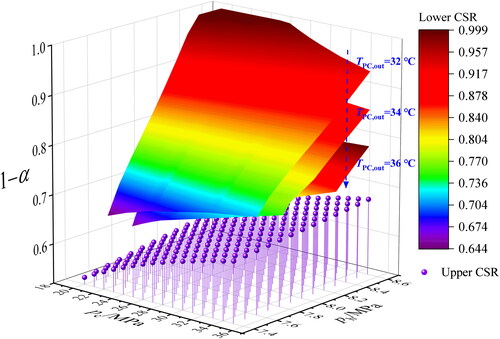
Figure 24. The upper and lower critical split ratio variation with isentropic efficiency of compressor.
6. Conclusions
The transient characteristics of the LTR in a reheat and recompression S-CO2 Brayton cycle are explored by developing an unsteady segmented model for recuperators. Besides, a prediction model has been proposed to quickly determine the pinch point location and analyze the operating conditions prone to cause internal pinch point. The main conclusions are drawn as follows:
The proposed control schemes can effectively control the cycle operation during inventory withdraw mass process. With the withdraw-mass increases, the power generation load decreases from 100% to 24.5%, the LTR hot side inlet mass flowrate decreases from 2971.23 kg·s−1 to 1526.02 kg·s−1, the hot side outlet temperature decreases from 92.03 °C to 54.35 °C, and the cold side inlet pressure decreases from 32.51 MPa to 14.59 MPa.
In the transient process, the pinch point location transfers dynamically. The larger pinch point temperature difference causes lower heat exchanger effectiveness, and the internal pinch point greatly weakens the heat exchanger effectiveness.
The lower-CSR variation is sensitive to the high- and low-pressures, the isentropic efficiency of the compressor, and the outlet temperature of the precooler, while the upper-CSR is only related to the pressures. The internal pinch point can be avoided by adjusting the split ratio in the application.
The increase in the outlet temperature of the PC, the decrease in the isentropic efficiency of the MC and the decrease in the hot-side pressure of the LTR, can reduce the probability of occurrence of the internal pinch point.
| Nomenclature | ||
| A | = | Cross section area, [m−2] |
| cp | = | Specific heat, [J·kg−1·°C−1] |
| Cd | = | Discharge coefficient, [-] |
| Cv | = | Valve construction coefficient, [-] |
| D | = | Equivalent Diameter, [m] |
| f | = | Valve opening, [-], Friction factor, [-] |
| F | = | Heat transfer area, [m−2] |
| h | = | Enthalpy, [kJ·kg−1] |
| K | = | Gain constant, [-] |
| = | Mass flowrate, [kg·s−1] | |
| N | = | Rotating speed, [s−1] |
| Nu | = | Nusselt Number, [-] |
| p | = | Pressure, [Pa] |
| Pr | = | Prandtl number, [-] |
| Ra | = | Surface roughness, [μm] |
| Re | = | Reynolds number, [-] |
| s | = | Entropy, [kJ·kg−1·°C−1] |
| t | = | Time, [s] |
| T | = | Temperature, [°C or K] |
| ΔT | = | Temperature difference, [°C] |
| Greek symbols | ||
| α | = | Split ratio, [-]; Convective heat transfer coefficient, [W·m−2·°C−1] |
| δx | = | Length of segmented element, [m] |
| δz | = | Equivalent wall thickness, [m] |
| γ | = | Specific heat ratio, [-] |
| ηC | = | Compressor isentropic efficiency, [-] |
| ηT | = | Turbine isentropic efficiency, [-] |
| λ | = | Thermal conductivity, [W·m−1·°C−1] |
| ρ | = | Density, [kg·m−3] |
| π | = | Pressure ratio, [-] |
| Abbreviations | ||
| BP | = | Back propagation |
| CFD | = | Computational fluid dynamics |
| CSR | = | Critical split ratio |
| IV | = | Inventory vessel |
| LTR | = | Low temperature recuperator |
| MC | = | Main compressor |
| PC | = | Precooler |
| PCHE | = | Printed circuit heat exchanger |
| RC | = | Re-compressor |
Additional information
Funding
References
- M. Li, H. Zhu, J. Guo, K. Wang, and W. Tao, “The development technology and applications of supercritical CO2 power cycle in nuclear energy, solar energy and other energy industries,” Appl. Thermal Eng., vol. 126, pp. 255–275, 2017. /11/05/2017, doi: 10.1016/j.applthermaleng.2017.07.173.
- W. Bai et al., “Energy and exergy analyses of an improved recompression supercritical CO2 cycle for coal-fired power plant,” Energy, vol. 222, pp. 119976, 2021. DOI: 10.1016/j.energy.2021.119976.
- J. Hidalgo-Salaverri, P. Cano-Megias, R. Chacartegui, J. Ayllon-Guerola, and E. Viezzer, “Analysis of supercritical carbon dioxide Brayton cycles for a helium-cooled pebble bed blanket DEMO-like fusion power plant,” Fusion Engineering Design, vol. 173, pp. 112860, 2021. DOI: 10.1016/j.fusengdes.2021.112860.
- E. Ruiz-Casanova, C. Rubio-Maya, J. J. Pacheco-Ibarra, V. M. Ambriz-Diaz, C. E. Romero, and X. Wang, “Thermodynamic analysis and optimization of supercritical carbon dioxide Brayton cycles for use with low-grade geothermal heat sources,” Energy Convers. Manage, vol. 216, Jul 15 2020. Art no. 112978, DOI: 10.1016/j.enconman.2020.112978.
- Y. Yang, Y. Lu, H. Wei, Y. Wu, and Q. Gao, “Numerical study of thermal-hydraulic performance of sCO2-molten salt printed circuit heat exchanger with discontinuous fins channel,” Numerical Heat Transfer, Part A: Applicat., pp. 1–21, 2022. DOI: 10.1080/10407782.2022.2105113.
- T. D. Luz, F. G. Battisti, and A. K. Da Silva, “A numerical study of supercritical carbon dioxide as a medium for thermal energy storage applications under natural convection,” Numerical Heat Transfer, Part A: Applicat., vol. 81, no. 3-6, pp. 49–71, 2022. DOI: 10.1080/10407782.2021.1969812.
- M. Qiao, Z. Jing, X. Ma, S. Wang, and D. Xu, “Thermal–hydraulic characteristics and structure optimization of Z-channel printed circuit heat exchanger,” Numerical Heat Transfer, Part A: Applicat., pp. 1–21, 2022. DOI: 10.1080/10407782.2022.2105111.
- T. Zhang and D. Che, “Lattice Boltzmann simulation of natural convection in an inclined square cavity with spatial temperature variation,” Numerical Heat Transfer, Part A: Applicat., vol. 66, no. 6, pp. 712–732, 2014. DOI: 10.1080/10407782.2014.894408.
- K. Cheng, J. Zhou, H. Zhang, X. Huai, and J. Guo, “Experimental investigation of thermal-hydraulic characteristics of a printed circuit heat exchanger used as a pre-cooler for the supercritical CO2 Brayton cycle,” Appl. Thermal Eng., vol. 171, pp. 115116, 2020. DOI: 10.1016/j.applthermaleng.2020.115116.
- F. Zhang, Y. Zhu, C. Li, and P. Jiang, “Thermodynamic optimization of heat transfer process in thermal systems using CO2 as the working fluid based on temperature glide matching,” Energy, vol. 151, pp. 376–386, 2018. DOI: 10.1016/j.energy.2018.03.009.
- F. Jacob, A. Rolt, J. Sebastiampillai, V. Sethi, M. Belmonte, and P. Cobas, “Performance of a supercritical CO2 bottoming cycle for aero applications,” Appl. Sci., vol. 7, no. 3, pp. 255, 2017. DOI: 10.3390/app7030255.
- V. Ladislav, D. Vaclav, B. Ondrej, and N. Vaclav, “Pinch point analysis of heat exchangers for supercritical carbon dioxide with gaseous admixtures in CCS systems,” Energy Procedia, vol. 86, pp. 489–499, 2016. DOI: 10.1016/j.egypro.2016.01.050.
- S. Son, J. Y. Heo, and J. I. Lee, “Prediction of inner pinch for supercritical CO2 heat exchanger using Artificial Neural Network and evaluation of its impact on cycle design,” Energy Convers. Manage., vol. 163, pp. 66–73, 2018. DOI: 10.1016/j.enconman.2018.02.044.
- S. Kim, Y. Cho, M. S. Kim, and M. Kim, “Characteristics and optimization of supercritical CO2 recompression power cycle and the influence of pinch point temperature difference of recuperators,” Energy, vol. 147, pp. 1216–1226, 2018. DOI: 10.1016/j.energy.2017.12.161.
- N. Bartel et al., “Comparative analysis of compact heat exchangers for application as the intermediate heat exchanger for advanced nuclear reactors,” Ann. Nucl. Energy, vol. 81, pp. 143–149, 2015. DOI: 10.1016/j.anucene.2015.03.029.
- W. Chu, X. Li, T. Ma, Y. Chen, and Q. Wang, “Experimental investigation on SCO2-water heat transfer characteristics in a printed circuit heat exchanger with straight channels,” Int. J. Heat Mass Transfer., vol. 113, pp. 184–194, 2017. DOI: 10.1016/j.ijheatmasstransfer.2017.05.059.
- W. Chu, X. Li, T. Ma, Y. Chen, and Q. Wang, “Study on hydraulic and thermal performance of printed circuit heat transfer surface with distributed airfoil fins,” Appl. Thermal Engineering, vol. 114, pp. 1309–1318, 2017. /03/05/2017, DOI: 10.1016/j.applthermaleng.2016.11.187.
- W. Wang, Y. Qiu, Y. He, and H. Shi, “Experimental study on the heat transfer performance of a molten-salt printed circuit heat exchanger with airfoil fins for concentrating solar power,” Int. J. Heat Mass Transfer, vol. 135, pp. 837–846, 2019. DOI: 10.1016/j.ijheatmasstransfer.2019.02.012.
- X. Bian et al., “A comprehensive evaluation of the effect of different control valves on the dynamic performance of a recompression supercritical CO2 Brayton cycle,” Energy, vol. 248, pp. 123630, 2022. DOI: 10.1016/j.energy.2022.123630.
- E. Liese, J. Albright, and S. A. Zitney, “Startup, shutdown, and load-following simulations of a 10 MWe supercritical CO2 recompression closed Brayton cycle,” Appl. Energy, vol. 277, pp. 115628, 2020. DOI: 10.1016/j.apenergy.2020.115628.
- J. Yang, Z. Yang, and Y. Duan, “Part-load performance analysis and comparison of supercritical CO2 Brayton cycles,” Energy Convers. Manage., vol. 214, pp. 112832, 2020. /06/15/2020, DOI: 10.1016/j.enconman.2020.112832.
- T. Ma, M. Li, J. Xu, J. Ni, W. Tao, and L. Wang, “Study of dynamic response characteristics of S-CO2 cycle in coal-fired power plants based on real-time micro-grid load and a novel synergistic control method with variable working conditions,” Energy Convers. Manage., vol. 254, pp. 115264, 2022. DOI: 10.1016/j.enconman.2022.115264.
- Y. Jiang, E. Liese, S. E. Zitney, and D. Bhattacharyya, “Design and dynamic modeling of printed circuit heat exchangers for supercritical carbon dioxide Brayton power cycles,” Appl. Energy, vol. 231, pp. 1019–1032, 2018. DOI: 10.1016/j.apenergy.2018.09.193.
- K. Chen, W. Pu, Q. Zhang, B. Lan, Z. Song, and Y. Mao, “Thermal performance analysis on steady-state and dynamic response characteristic in solar tower power plant based on supercritical carbon dioxide Brayton cycle,” Energy Source Part A: Recov. Utiliz. Environ. Effects, pp. 1–23, 2020. DOI: 10.1080/15567036.2020.1838001.
- T. Ma, M. Li, J. Xu, and F. Cao, “Thermodynamic analysis and performance prediction on dynamic response characteristic of PCHE in 1000 MW S-CO2 coal fired power plant,” Energy, vol. 175, pp. 123–138, 2019. DOI: 10.1016/j.energy.2019.03.082.
- Y. Zhang, H. Li, M. Yao, and Y. Wang, “Conceptual design of the recuperator and precooler for a 600MW fossil-based supercritical CO2 power generation system,” Proc. CSEE, vol. 37, no. 24, pp. 7223–7229, 2017. DOI: 10.13334/j.0258-8013.pcsee.162449.(in Chinese)
- J. Zhou et al., “Exergy analysis of a 1000 MW single reheat supercritical CO2 Brayton cycle coal-fired power plant,” Energy Convers. Manage., vol. 173, pp. 348–358, Oct 1 2018. DOI: 10.1016/j.enconman.2018.07.096.
- W. Wang, Z. Hunag, S. Zhao, C. Chen, and Z. Yao, “Simulation research on thermodynamic performance of supercritical carbon dioxide 600 MW coal-fired power system,” Thermal Power Generation, vol. 49, no. 10, pp. 101–106, 2020. (in Chinese)
- W. Bai, Y. Zhang, Y. Yang, H. Li, and M. Yao, “300 MW boiler design study for coal-fired supercritical CO2 Brayton cycle,” Appl. Thermal Eng., vol. 135, pp. 66–73, 2018. DOI: 10.1016/j.applthermaleng.2018.01.110.
- H. Li et al., “Preliminary design assessment of supercritical CO2 cycle for commercial scale coal-fired power plants,” Appl. Thermal Eng., vol. 158, pp. 113785, 2019. DOI: 10.1016/j.applthermaleng.2019.113785.
- V. Gnielinski, “New equations for heat and mass transfer in turbulent pipe and channel flow,” Int. Chem. Eng., vol. 16, no. 2, pp. 10, 1976.
- T. K. Serghides, “Estimate friction factor accurately,” Chem. Eng., vol. 91, pp. 63–64, 1984.
- M. Marchionni, L. Chai, G. Bianchi and S. A. Tassou, “Numerical modelling and transient analysis of a printed circuit heat exchanger used as recuperator for supercritical CO2 heat to power conversion systems,” Appl. Thermal Engineering, vol. 161, pp. 114190, 2019. DOI: 10.1016/j.applthermaleng.2019.114190.
- W. Wang, R. Cai, and N. Zhang, “General characteristics of single shaft microturbine set at variable speed operation and its optimization,” Appl. Thermal Eng., vol. 24, no. 13, pp. 1851–1863, 2004. DOI: 10.1016/j.applthermaleng.2003.12.012.
- N. Zhang and R. Cai, “Analytical solutions and typical characteristics of part-load performances of single shaft gas turbine and its cogeneration,” Energy Convers. Manage, vol. 43, no. 9, pp. 1323–1337, 2002. DOI: 10.1016/S0196-8904(02)00018-3.
- H. H. Weiss and L. Boswirth, “A simple but efficient equipment for experimental determination of valve loss coefficients under compressible and steady flow conditions,” presented at the International Compressor Engineering Conference, 1982, pp. 374.
- T. L. Bergman, A. Lavine, F. P. Incropera, and D. P. Dewitt, Fundamentals of Heat and Mass Transfer. Hoboken, NJ, USA: Wiley, 2011.