 ?Mathematical formulae have been encoded as MathML and are displayed in this HTML version using MathJax in order to improve their display. Uncheck the box to turn MathJax off. This feature requires Javascript. Click on a formula to zoom.
Abstract
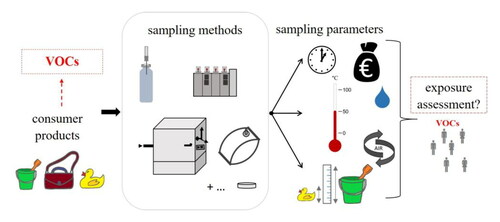
Volatile organic compounds (VOCs) are common constituents of many consumer products. Although many VOCs are generally considered harmless at low concentrations, some compound classes represent substances of concern in relation to human (inhalation) exposure and can elicit adverse health effects, especially when concentrations build up, such as in indoor settings. Determining VOC emissions from consumer products, such as toys, utensils or decorative articles, is of utmost importance to enable the assessment of inhalation exposure under real-world scenarios with respect to consumer safety. Due to the diverse sizes and shapes of such products, as well as their differing uses, a one-size-fits-all approach for measuring VOC emissions is not possible, thus, sampling procedures must be chosen carefully to best suit the sample under investigation. This review outlines the different sampling approaches for characterizing VOC emissions from consumer products, including headspace and emission test chamber methods. The advantages and disadvantages of each sampling technique are discussed in relation to their time and cost efficiency, as well as their suitability to realistically assess VOC inhalation exposures.
Graphical Abstract
Introduction
People in industrialized nations spend 80–90% of their time indoors, making indoor air quality (IAQ) an important factor for human health and wellbeing.[Citation1–4] IAQ is characterized by the nature and abundance of chemical, physical and/or biological (including microbial) constituents. While the term “physical” in the context of pollutants mainly refers to fibers or particulate matter (PM), unwanted “chemical” components encompass both inorganic and organic compounds.[Citation4,Citation5] Amongst the latter, volatile organic compounds (VOCs) are a group of chemically diverse constituents that are ubiquitous in indoor air, typically at trace concentrations (several parts per million by volume (ppmv) or lower), and represent an important aspect of IAQ.[Citation4,Citation6–8] These compounds arise primarily through emissions from within the indoor environment, such as from construction materials and furnishings,[Citation9–12] household products (cleaning agents, detergents),[Citation13–15] human activities (e.g., cooking, showering)[Citation16,Citation17] and humans[Citation18–20] themselves. Moreover, consumer products, including decorative articles, tools, utensils, textiles or children’s toys, amongst others, have been shown to emit a range of different compounds and are considered a major source of indoor VOCs.[Citation21–28] “Consumer products” is a broad term that encompasses a variety of different items, although specific definitions for individual product categories are in use by the regulatory authorities in some countries. In Germany, for instance, consumer products are defined by the German Food and Feed Code (“Lebens- und Futtermittelgesetzbuch,” LFGB) to include toys and items consumers regularly come into contact with, such as textiles, masks and bracelets.[Citation29]
Due to advancements in construction practices and improved insulation in recent decades, contemporary buildings exhibit relatively low air change rates between indoors and outdoors, consequently leading to an accumulation of VOCs in the indoor environment.[Citation30] Accordingly, human occupants can become exposed to these substances at high concentrations and for prolonged periods. Poor IAQ and accumulation of VOCs is thereby associated with negative consequences on health and well-being, leading to odor nuisance, irritation of the eyes and nose, or other adverse effects through inhalation.[Citation6,Citation31–33]
The VOCs emitted from various products in indoor settings cover diverse substance classes.[Citation23,Citation24] Among the most frequently encountered categories of VOCs found indoors are aromatic compounds, such as benzene and toluene, aldehydes, for instance acetaldehyde and hexanal, and terpenes, including α- or β-pinene and limonene.[Citation8,Citation34,Citation35] Volatile compounds present in consumer products can have different origins, including substances that have been added or used intentionally during manufacturing. Solvent residues, additives and monomers are typical VOCs that have been detected in different kinds of consumer products. Some of these VOCs are of toxicological relevance, such as styrene and 1,3-butadiene, which are solvent and monomer residues that have been detected in plastics.[Citation36,Citation37] In some cases, volatile constituents of products are odor-active and elicit smells that consumers perceive as unpleasant or that are potentially harmful,[Citation38,Citation39] in other cases, odorous compounds are added intentionally by the manufacturer to impart the product with a characteristic smell.[Citation27,Citation40,Citation41] Furthermore, volatile emissions can derive from non-intentionally added substances (NIAS), which include contaminants, by-products of the manufacturing process, or reaction products of additives that form over the lifetime of the product.[Citation42,Citation43]
The vast abundance of consumer products found in homes and offices throughout the world emphasizes the importance of their impact on IAQ through volatile emissions and highlights the associated need to consider such emissions in the context of consumer protection, especially in relation to compounds with potential toxicological effects. The risk that is posed by the presence of a volatile compound in the ambient air depends on the nature of the chemical and the degree of exposure toward it, i.e., its concentration and the duration of exposure.[Citation44] Usually, the most prominent exposure to VOCs occurs via inhalation, thus, consumer health risk assessments associated with consumer products primarily focus on the inhalation exposure of VOCs released from products and materials.[Citation26,Citation42,Citation45] Comprehensive exposure assessments require reliable, reproducible and ultimately affordable methods for characterizing VOC emissions from highly diverse sources, ranging from large building materials to small and durable consumer products. Sample preparation and the sampling procedure itself are often the most critical steps in characterizing such emissions, and therefore, must be chosen carefully to suit the product of interest. This is especially relevant in the field of consumer protection, since reliable exposure assessments require accurate analyses, which have a direct impact on the outcome of the assessment of associated health risks.
Previous articles on emissions, including some review papers, have focused on the VOCs most commonly detected in indoor environments, such as through emissions from construction materials, furniture, personal care products, fragranced articles or household items, but only rarely explicitly in relation to sampling techniques.[Citation9–11,Citation26,Citation41,Citation46,Citation47] The sampling and analysis of VOCs in indoor air have also been reviewed, with a treatment of the associated risks posed to human health through inhalation exposure.[Citation46,Citation48,Citation49] Some studies also presented or compared different sampling approaches relating to VOC emissions from selected polymers and consumer products.[Citation42,Citation50,Citation51] Nevertheless, there is a lack of articles systematically reviewing and comparing different sampling approaches to determine VOC emissions from solid consumer products. The present article, therefore, exclusively reviews sampling approaches and provides an overview of existing techniques that can be applied for the collection of VOCs emitted from consumer products, with the aim of supporting the selection of the most appropriate sampling method for the specific research question at hand. The review covers key approaches for the first critical step of characterizing VOC emissions, namely sampling, with a focus on durable (solid) consumer products. The sampling techniques reviewed here have broad applicability to most VOCs emitted from a wide variety of materials, sizes, shapes and compositions of consumer products, whereby this diversity precludes a universal sampling approach. Thus, this article compares different techniques, including headspace sampling – both static and dynamic collection – as well as emission test chamber methods. The main aspects of each sampling approach are described, with examples of applications and a discussion of associated advantages, disadvantages and limitations. A major focus is placed on methods that allow the direct or indirect determination of expected emission rates under realistic exposure scenarios. To provide the required theoretical background, the article commences with an introduction to the general mechanistic concepts relating to the processes involved in VOC emissions, followed by a brief discourse on regulatory aspects of emissions assessments.
Definitions and physical principles of VOC emissions from solid matrices
VOCs comprise chemical substances that exhibit boiling points from about 50 °C to 260 °C;[Citation52] beyond this range, substances with lower boiling points (<50 °C) are commonly referred to as very volatile organic compounds (VVOCs), while those with boiling points exceeding 260 °C are termed semivolatile organic compounds (SVOCs). According to the EN 16516 standard,[Citation53] VOCs are defined as all volatile organic substances that elute between n-hexane (boiling point 69 °C[Citation54]) and n-hexadecane (boiling point 287 °C[Citation55]) when using a nonpolar (5%-phenyl-/95%-methyl-polysiloxane) capillary column for separation by gas chromatography (GC). Apart from covering a wide range of boiling points and vapor pressures, the term “VOC” is not limited to a certain substance class of chemicals. Consequently, VOCs are of diverse chemical nature and exhibit different (physical and chemical) properties, offering varied functional moieties, polarities and reactivities.
The characteristics and mechanistic physical principles of VOC emissions from solid materials have been closely studied in the context of emissions modeling.[Citation56–61] Overall, the emissions of VOCs from solid matrices into indoor or test chamber air can be divided into three main processes: (i) the (internal) diffusion of the compound within the material, (ii) the partitioning of the compound at the interface between the material and the surrounding air and (iii) the (external) diffusion and/or convection of the compound within the air boundary layer between the sample surface and the surrounding bulk air.[Citation56,Citation57,Citation62]
VOC diffusion within the material is characterized by Fick’s second law and is described by the following equation (EquationEq. (1)(1)
(1) ):
(1)
(1)
where cm is the VOC concentration within the material, t is time, y is the diffusion coordinate and Dm is the diffusion coefficient of the molecule in the respective material. The diffusion coefficient is a proportionality constant relating the concentration gradient to the molecular flux.[Citation63] Similarly, the diffusion of a compound in air is characterized by the related diffusion coefficient, Da.
Under conditions of chemical equilibrium, the VOC concentrations in the gas phase around the sample and the material surface are characterized by the respective material/air partition coefficients, Km,a (EquationEq. (2)(2)
(2) ):
(2)
(2)
where cm,surface and ca are the concentrations at the material surface and in the air boundary layer around the sample surface, respectively. Therefore, Km,a can be used to predict the partitioning of a compound between the sample and the air layer directly above it. For the partitioning of compounds between indoor materials and air, Km,a varies depending on the nature of the compound and the source material (cf. ). In addition, temperature has an impact on Km.a.[Citation64,Citation65]
Table 1. Physical parameters of selected volatile organic compounds (VOCs) in relation to their emissions from representative products, as encountered in indoor settings.
The convective mass-transfer coefficient, h, describes the mass flux of a compound from the material surface through the air boundary layer toward the bulk air.[Citation56,Citation62,Citation66] In VOC emission modeling, h is used to set a boundary condition at the material surface, as defined in the following equation (EquationEq. (3)(3)
(3) ).[Citation56,Citation59,Citation66,Citation67]
(3)
(3)
where cba is the VOC concentration in “bulk air”, i.e., the air outside a diffusion layer.
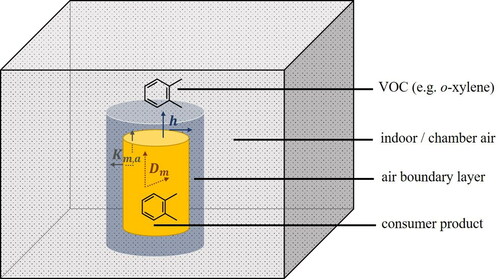
VOC emissions from a solid sample into air are illustrated in . Different mass transfer processes of a compound (represented by ortho-xylene in ) are shown: diffusion within the source material (diffusion coefficient, Dm), partitioning at the material/air interface (partition coefficient, Km,a) and diffusion and/or convection (mass transfer coefficient, h) within the air boundary layer, which exists between the sample material surface and the bulk air.
Figure 1. Physical processes involved in the emissions of volatile organic compounds (VOCs) from solid materials into indoor/test chamber air. VOC emissions are characterized by three main processes: internal diffusion (characterized by the diffusion coefficient, Dm), partitioning between the sample material surface and the surrounding air (characterized by the partition coefficient, Km,a) and external diffusion/convection (characterized by the convective mass transfer coefficient, h). The VOC depicted in this schematic is ortho-xylene.
These physical parameters can be determined empirically through independent measurements[Citation62,Citation68–70] as well as by modeling experimental emission test chamber data.[Citation58,Citation66,Citation71] Beyond that, the parameters can be predicted based on the physicochemical properties of the target compound and/or the sample matrix.[Citation72,Citation73] summarizes some physical parameters of selected VOCs that characterize their emissions from representative products encountered in an indoor setting. Values for Km,a and Dm vary over several orders of magnitude, depending on the compound and the sample matrix. In contrast, values for h and Da usually differ by only one order of magnitude for different VOCs. Diffusion coefficients of VOCs in the (solid) material are usually much smaller than in air, therefore, their mass transfer within the material is significantly slower.
Depending on Dm, Km,a and h, mass transfer is potentially limited by two processes, namely diffusion within the material and transfer of the VOCs to the air boundary layer. If one of these two processes is significantly slower than the other it will govern and limit the emission rate.[Citation59,Citation62,Citation73–75] For highly volatile compounds, internal diffusion is the limiting factor in most cases. Hence, the emission rates of such VOCs from a specific material are largely independent of the air boundary layer characteristics, such as thickness and convective mass transfer coefficient h.[Citation62,Citation73,Citation75] In such cases, the configuration shown in is very stable.
The emission rate decreases over time (cf. EquationEq. (1)(1)
(1) ), yet most regulations consider a representative period of off-gassing of materials in the initial period after production or processing, which usually occurs before exposure to consumers is of relevance.[Citation76] Many of the established procedures to measure VOC emissions aim to assess the long-term inhalation exposure beyond this initial period. According to the German AgBB (“Ausschuss zur gesundheitlichen Bewertung von Bauprodukten”; committee for health-related evaluation of building products) scheme and DIN EN 16516, for example, emissions from building materials are assessed by placing these in an emission test chamber that is flushed with air at a steady rate until a nearly constant emission rate is achieved (e.g., after up to 28 days).[Citation53,Citation76] Pre-defined loading factors, which are derived from typical ratios of sample surface and indoor air volume in a 3 m × 4 m × 2.5 m (30 m3) standard room, ensure that the measured VOC concentrations in the chamber air can be compared to guideline values derived in relation to long-term exposure. In this scenario, internal diffusion within the sample material is usually the rate-limiting step. For consumer products and some specific applications, however, these assumptions may not be necessarily true. Toys, for example, are often used immediately after removing the packaging, which can be accompanied by high peaks of VOC emissions when used for the first time or after storage in environments with limited air exchange (initial emission peak). In such cases, the transfer of VOCs into the air boundary layer may be rate-limiting until the material surface is depleted of VOCs, with subsequent re-supply driven by internal diffusion. In addition, some indoor environments, such as (cluttered) children’s nurseries or retail stores, may contain large numbers of consumer products emitting a diverse range of compounds, although these scenarios are usually not associated with long-term (i.e., lifelong) exposures. Accordingly, loading factors typically used for the assessment of VOC emissions from building products are not realistic for many consumer products and long-term exposure limit values are not applicable.
Other VOC exposure routes relevant to human health may also be considered, such as dermal uptake via direct skin contact or through the inhalation (or ingestion in babies and young children) of particulate matter (PM) enriched with compounds.[Citation25,Citation77] These routes of exposure are especially relevant for compounds of low volatility whereby exposure through the air is limited compared to physical contact with the product. In these cases, air boundary layer diffusion is the controlling process. Migration of compounds into other matrices than air, such as food or other consumer-related substrates, also plays an important role in consumer protection. For this purpose, however, other assessments must be conducted using appropriate methods.[Citation78,Citation79] This review article focuses on inhalation as the primary route of exposure to VOCs emitted from consumer products into the surrounding air.
Regulatory background
Official (legal) regulations on VOCs in consumer products typically impose limits of individual substances or compound classes in relation to specific products. The toy safety directive 2009/48/EC of the EU,[Citation80] for example, regulates the use of certain fragrance allergens in toys, currently restricting 55 fragrances and requiring that a further 11 allergenic fragrances are declared on the product label if their concentration in the toy exceeds 100 mg/kg. A realistic risk assessment in relation to inhalation exposure, however, requires that the emissions of volatile constituents from products are assessed in relation to their derived (indoor) air concentrations for direct comparison with their associated guideline values. The REACH framework of the EU[Citation81] (registration, evaluation, authorisation and restriction of chemicals) stipulates exposure limits for certain substances based on the derived no effect levels (DNELs); these are typically provided as air concentrations that should not be exceeded. In addition to DNELs, the EU documents the lowest concentration of interest (LCI) values. LCI values are partly derived from the associated values established in Germany (the NIK values, or “niedrigste interessierende Konzentrationen”) and France (the CLI values, or “Concentrations Limites d’intérê”) and define air concentration limits of VOCs emitted from building products that are determined through emission tests according to DIN EN 16516.[Citation53,Citation82,Citation83] Although these LCI values are used in assessment standards, they are tightly linked to the measurement procedure, which is often not suitable for small consumer products. Other norms include the ISO 16000 series,[Citation84] which describe the exact procedures for sampling and analyzing VOCs emitted from construction products, or the standards from the American Society for Testing and Materials (ASTM international). Despite these guidelines and standards, specific regulations that define emission limits or analytical methods to determine VOC emissions from consumer products currently do not exist in the EU. One exception is the planned restriction on formaldehyde release from consumer articles.[Citation85] Furthermore, a recent study undertaken by the Danish Environmental Protection Agency (EPA) has triggered a discussion at the EU level about emission limit values for some VOCs in toys, leading to the definition of emission limit values for related VOCs.[Citation86] Further guidelines are offered by the German committee on indoor air guide values (AIR), which consider all VOCs present in the indoor air, irrespective of their emission sources and cover values for individual VOCs as well as total VOC (TVOC) concentrations in their assessment of IAQ.[Citation87,Citation88]
Analytical methods to determine VOC emissions
Measurements of VOC emissions from consumer products typically proceed in two steps, namely (i) sampling and (ii) instrumental analysis. While this review article focuses on sampling methods, a short overview of the most common analytical techniques for VOC analysis is presented for the sake of completeness and because the ensuing analytical approach is a decisive factor in choosing a suitable sampling method.
Due to the complex mixture of VOCs encountered in these applications, the analytical procedure typically includes a separation of compounds. The most widespread approach for the separation of volatiles is GC.[Citation18,Citation24,Citation40,Citation89] The ability of a GC system to analyze individual compounds depends on the transfer of these compounds into the system, as well as the subsequent detection technique. Compound transfer is strongly dependent on the sampling method and the nature of the captured sample. Volatile compounds sampled onto sorbent materials, for example, must be subsequently liberated from the material, which is usually achieved through thermal desorption (TD).[Citation24,Citation42,Citation90] This process typically includes a subsequent focusing step, e.g., using a cryogenic trap, which avoids peak broadening by ensuring a fixed starting time and point.[Citation91] Focusing or trapping can also be applied as an enrichment step to increase sensitivity.[Citation92]
After GC separation, detection of the eluting analytes is most routinely performed using either mass spectrometry (MS) or flame ionization detection (FID). In GC-MS, analytes are typically ionized via electron ionization (EI) or chemical ionization (CI), whereby their ensuing characteristic mass spectra are compared to reference spectra to aid compound identification.[Citation22,Citation45,Citation93] By comparison, GC-FID relies solely on the retention times of individual compounds in the related GC column but offers the advantage of providing a compound-independent response (proportional to carbon content of the eluting molecule[Citation94]). In the case of odor-active compounds, GC-olfactometry (GC-O) offers a means to determine the presence of odorants through use of an olfactory detection port at which a trained assessor smells the eluting compounds and notes their odor qualities.[Citation38,Citation39,Citation93]
An alternative, fast and direct analytical method for the detection of VOCs is offered by direct injection mass spectrometry (DIMS). DIMS is based on chemical ionization and includes proton transfer reaction-mass spectrometry (PTR-MS), selected ion flow tube-mass spectrometry (SIFT-MS) and atmospheric pressure chemical ionization-mass spectrometry (APCI-MS), amongst others, and allows for real-time detection of gas phase VOC emissions.[Citation95] Due to their high sensitivity, a major benefit of DIMS techniques is that VOC emissions from various matrices can be determined directly, without the need for extensive sample preparation, allowing dynamic processes to be characterized, as well as being tailored to high-throughput screening analyses. The limited ability of these techniques to achieve unequivocal compound identification mean that they are best suited for targeted analyses, i.e., when the constituent compounds are known a priori. Nevertheless, they are widely used in non-targeted analyses, whereby compound assignments are made through knowledge of reaction mechanisms and/or through additional complementary GC-MS analyses to confirm compound identities.[Citation96]
Ion mobility spectrometry (IMS), either as a direct, online detector or as a tool for intermittent analysis when coupled to GC (i.e., GC-IMS) has also been applied to measure VOC emissions. In IMS, analytes are separated based on the mobility of the respective ions within an electric field.[Citation97] IMS has been reported for many applications,[Citation98,Citation99] including on-site environmental monitoring (e.g., screening for contaminants in water and soil),[Citation98] chemical warfare detection,[Citation100] human breath research (i.e., volatile biomarker detection)[Citation101] and food analysis (i.e., aroma compound detection).[Citation99,Citation102,Citation103]
Beyond chromatographic or mass spectrometric methods, the use of sensor arrays or so called electronic noses for the determination of VOC emissions from products, such as plastic-based articles, has been investigated.[Citation104,Citation105]
Further details on instrumental methods for separation and detection of VOCs are beyond the scope of this review article, which focuses on sampling approaches. For further information on the principles and applications of these techniques in regard to VOC analysis, the reader is referred to comprehensive review articles in the scientific literature, e.g., on IMS[Citation97–99,Citation106] and DIMS methods,[Citation95,Citation96,Citation107,Citation108] or the use of sensors or sensor arrays,[Citation109–113] as well as GC-MS in general.[Citation94,Citation114]
Sampling methods for VOCs emitted from consumer products
Sampling is a critical step to isolate the target compounds and ensure their detectability.[Citation115–117] Collection of VOCs can be performed in many different ways and is closely related to the sample matrix and objectives of the analysis, as well as the emission scenario for determining emission rates. Configurations for sampling VOC emissions can be broadly categorized into two types: static and dynamic systems. Static systems are well suited for characterizing the nature and quantities of VOCs being emitted from a product whereas dynamic systems allow for the assessment of VOC emissions under simulated environmental conditions in order to ascertain realistic emission data. VOC emissions, by definition, relate to compounds that have transitioned from the product matrix into the gas phase surrounding the sample (as described above), thus, sampling usually proceeds in the gas phase.
VOCs emitted from consumer products can be sampled either by direct collection and analysis of headspace gas[Citation15,Citation118] or using sorption techniques whereby VOC constituents in headspace gas are captured and enriched on an adsorbent material prior to analysis.[Citation50,Citation119] Sampling approaches can also be differentiated between active and passive sampling. In active sampling, a pump is used to draw a defined volume of sample gas, either in a sampling receptacle or over a sorbent.[Citation120] By comparison, passive sampling proceeds without external influence, relying on the diffusion of compounds from the sample matrix into the headspace gas and onto a sorbent material.[Citation74,Citation121,Citation122]
Basic methodologies and physical principles of different sampling methods for assessing VOC emissions from solid consumer products are presented and discussed here, with the experimental configurations evaluated in relation to their suitability for simulating relevant environmental conditions and delivering realistic emission values. The discussion will consider critical parameters, including temperature, airflow and humidity relating to typical indoor conditions. Further, the relationship between sample size and surface area to the gas volume of the sampling device will be addressed, as will the possibility for in situ sampling (e.g., at the sample site). gives an overview and appraisal of the main characteristics of the methods covered in this review, which are broadly categorized into four main groups, namely: headspace techniques, sampling bags, emission test chambers and alternative methods mainly applied in other fields. These methods feature different advantages and disadvantages, thus, they are suitable for different applications and objectives.
Table 2. Comparison of sampling methods for VOC emissions from solid material consumer products, indicating their potentials and limitations.
Headspace methods
Headspace sampling is a useful approach to characterize the volatile constituents of a sample, as has been demonstrated in many applications.[Citation13,Citation15,Citation50,Citation123,Citation124] The premise of headspace sampling is that volatile constituents of a sample material or product partition between the sample matrix (solid, in the context of this review, but similarly for liquid samples) and the surrounding gas, i.e., the sample headspace (predominantly above the sample when housed in a sampling receptacle, hence the term); due to this phenomenon, this approach is also referred to as vapor phase extraction.[Citation125] Headspace sampling offers convenience through the separation of VOCs from their matrix of origin, thereby avoiding contamination of the chromatography and detection systems. A further advantage in headspace sampling is the possibility for automation of analysis, such as in headspace GC, allowing for the measurement of many samples in succession.[Citation126]
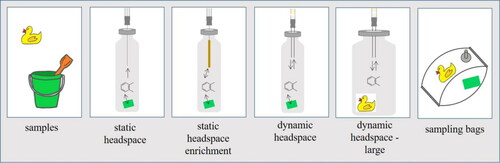
A graphical overview of headspace methods for sampling VOC emissions from consumer products covered in this review is given in . Several different approaches for headspace sampling and analysis exist, including extraction of a headspace aliquot (cf., Static headspace sampling) with direct injection into the GC system,[Citation15,Citation92,Citation127,Citation128] or by the use of sorbent materials for compound enrichment.[Citation40,Citation126,Citation127] This section presents and discusses different headspace techniques that are applicable for consumer product emissions tests. As suggested by Kremser et al.,[Citation126] the sampling techniques can be broadly classified into three categories, namely static sampling, static enrichment and dynamic enrichment. In contrast to static sampling and analysis, "dynamic" refers to the continuous or intermittent depletion of volatiles from the sample headspace into the carrier gas that is purged through the sampling system, whereby compounds are continuously re-supplied into the headspace gas from the sample matrix.[Citation126] Consequently, dynamic sampling actively influences the emission characteristics of a sample. In static headspace systems, a further differentiation must be made between equilibrium or non-equilibrium (shortened extraction time) conditions.
Figure 2. Headspace and bag sampling methods covered in this review article for the analysis of volatile organic compound (VOC) emissions.
Static headspace sampling
In classical static headspace sampling, an aliquot of the headspace gas of the sample matrix is collected for analysis, which can be considered a representative fraction of VOCs released by the sample. The composition of the headspace gas under equilibrium conditions mainly depends on the partition coefficients of compounds between the sample matrix and the vapor phase.[Citation64,Citation127] Gas phase (air) concentrations of compounds, ca, can be expressed according to EquationEq. (4)(4)
(4) , as follows:[Citation64,Citation128]
(4)
(4)
where cm is the compound concentration in the sample material, Km,a is the partition coefficient of the compound between sample matrix and the gas phase, and β represents the volumetric phase ratio between the gas phase and the sample phase. If cm is known, the static headspace sampling approach is an excellent method for determining Km,a.[Citation65]
In practice, static headspace sampling is achieved by placing the sample in a closed receptacle (e.g., a sealed glass vial) and allowing an equilibrium between the sample and the vapor phase to be established, before an aliquot is then extracted from the headspace and injected into the analyzer. Partitioning of compounds between solid sample matrices and headspace can be effectively influenced by variation of the temperature during the incubation period.[Citation115]
The broad applicability of static headspace sampling makes it a versatile approach for characterizing volatile constituents of consumer products. Lim et al.,[Citation15] for example, analyzed the release of benzene, toluene, ethylbenzene and o/m/p-xylenes (i.e., BTEX) from over 200 consumer products, e.g., toys, pencils and shoes, via static headspace GC-MS, with the aim of conducting a risk assessment relating to these chemicals. Typically up to 1 g of the respective sample was analyzed after an equilibration time of 30 min at 150 °C. BTEX compounds quantified via this method were subsequently used in combination with estimated inhalation and absorption rates, ventilation rate, exposure duration (e.g., time spent at home), amount of product used and frequency of exposure (e.g., daily) to estimate inhalation and dermal exposures over a lifetime. In this context, several assumptions were made in relation to indoor air exposure, including the steady release of BTEX over several months and the consideration of worst-case scenarios (exposure toward 100% of emitted BTEX). Taken together, the authors concluded that BTEX exposure for some products exceeded limit values and should, therefore, be reduced.[Citation15] By comparison, a study published by the Danish EPA focused on the analysis of VOCs in printed matter, i.e., journals and magazines, from different printing processes. To conduct a screening for VOCs emitted from the samples, headspace aliquots extracted at 100 °C were analyzed via GC-MS. In 21 samples, 143 single compounds could be identified and trends regarding their profiles following different printing techniques could be observed.[Citation118]
Static headspace sampling offers the benefit of separating the volatile compounds from the nonvolatile constituents of a sample with minimal equipment, thereby allowing for automated sampling under standardized, reproducible conditions.[Citation126] A major limitation of static headspace analysis, however, is that often the sample must be manipulated (typically cut into smaller pieces) to fit in the sampling vessel. As such, this approach does not readily allow realistic emission rates to be estimated and several assumptions are required in order to subsequently conduct exposure assessments. Accordingly, static headspace sampling is usually limited to qualitative assessments of VOC profiles or estimations of concentrations of compounds in a sample.[Citation37,Citation118]
Static headspace enrichment
An extension of conventional static headspace sampling can be achieved through the use of sample enrichment, whereby VOCs in the headspace gas are captured on sorbent materials.[Citation126,Citation129] One widespread approach is solid phase micro-extraction (SPME), which involves placing a fused silica fiber coated with a thin sorbent-phase film into the headspace gas of a sample to allow capture of constituent VOCs via diffusion until partitioning equilibrium has been reached. The technique can be considered a three-phase system, comprising the sample matrix, the headspace gas and the coating of the SPME fiber.[Citation117,Citation119,Citation127] Under conditions of equilibrium, the amount of a compound recovered on the fiber depends on its partition coefficients between air and the sample matrix (Ka,m), and air and the sorbent (Ks,a), as well as its concentration in the sample.[Citation119,Citation127,Citation129] This situation was described by Zhang and Pawliszyn[Citation119] for a system comprising an aqueous solution, air and the SPME sorbent, as follows (EquationEq. (5)(5)
(5) ):
(5)
(5)
where cs is the compound concentration in the sorbent and Vs, Vm and Va are the volumes of the sorbent coating, sample material and headspace gas (air), respectively. EquationEquation (5)
(5)
(5) reveals that the quantity of the compound sampled under equilibrium is directly proportional to the phase volumes of the sample material, headspace gas and sorbent, respectively. For high sorbent volumes, Vs, and high partition coefficients between sorbent and air, Ks,a, the sorbent may act as a sink and deplete the gas phase concentration. When operating under non-equilibrium conditions, sampling parameters, such as extraction time and temperature, must be strictly adhered to in order to ensure comparable results.[Citation127,Citation130]
Static headspace sampling via SPME has been demonstrated in numerous studies on consumer products. The Danish EPA,[Citation131] for instance, published a survey of allergens in children’s toys and cosmetic products. A qualitative screening for fragrance allergens was conducted using compound extraction via headspace SPME, although the report emphasized that the applied method first of all allowed for qualitative measurements of constituents emitted from the products into the gas phase.[Citation131] In other studies, VOCs emitted by a naturally aged book or from new or historical plastic objects were sampled by headspace or nondestructive direct-contact SPME.[Citation132,Citation133] For historical plastic objects, for example, sampling was conducted in situ at room temperature and for extraction periods of 15 days. Using headspace SPME sampling of small sample amounts, more than 200 VOCs emitted from the plastic products were detected. The authors concluded that noninvasive headspace SPME sampling is a suitable tool to identify VOCs emitted from different products.[Citation133] Another study sought to evaluate potential risks through inhalation of fragrance allergens emitted from scented dolls. Masuck et al.[Citation40] applied headspace SPME at 23 °C and 40 °C followed by GC-MS analysis, which revealed temperature-dependent emissions of fragrance allergens. Further, non-allergenic fragrances and plasticizers were found to be emitted from the samples.[Citation40] In a related study, the same group focused on developing a sensitive screening method, including headspace SPME, for fragrance allergens in toys, which led to the detection of fragrances in the ng/g range, thereby demonstrating the suitability of this approach for estimating fragrance emissions.[Citation50] The analysis of VOC emissions from historical plastic and rubber materials in another study was similarly conducted using headspace SPME-GC-MS, developing an optimized procedure that included a sample equilibration time of 7 days in closed vials amongst other parameters. According to that study, homogenization of the samples improved the reproducibility of the analysis, indicating that sample inhomogeneity represents a notable contributor to deviating results.[Citation134]
As described for static headspace approaches, headspace SPME can be readily automated to ensure standardized sampling conditions and minimized workload. The former is particularly important when working under non-equilibrium conditions.[Citation127,Citation130] Extraction and enrichment of compounds using sorbent materials generally yield higher sensitivity and lower limits of detection compared to classical static headspace sampling.[Citation126,Citation135,Citation136] As with the latter, headspace SPME is often applied for screening purposes rather than for quantitative estimation of emission rates.[Citation50,Citation132–134]
Dynamic headspace enrichment
In dynamic headspace (DHS) sampling, compound extraction typically includes a process of enrichment, which is achieved via cold trapping or through use of sorbent-loaded TD tubes.[Citation126,Citation137] Using this approach, the vial containing the sample is purged with gas, thereby forcing headspace gas to pass through the trap. The depletion of compounds in the vial headspace facilitates further transfer of VOCs from the sample into the gas phase. The amount of compounds sampled depends on the purge flow and sampling time (and corresponding purge volume), thus, extraction and enrichment can be significantly higher than in static headspace sampling, e.g., via SPME.[Citation126,Citation138] Cold traps are rapidly heated in order to re-volatilize trapped compounds and subsequently transfer these to the GC. By comparison, when using TD tubes the compounds emitted from the sample are transferred from the headspace into the tube, where they adsorb onto the sorption material.[Citation126,Citation137] Due to the greater surface area for adsorption compared to SPME fibers, the adsorption capacity of TD tubes is higher, leading to an increased sensitivity.[Citation138] Several suitable adsorbent materials are available for sampling VOCs on TD tubes, but the most common and widely used is Tenax® TA (poly(2,6-diphenyl-p-phenylene oxide)), a porous organic polymer.[Citation91,Citation137] Other materials include carbon-based adsorbents, which are more suitable for sampling VVOCs, or inorganic adsorbents, such as silica gels, which have a high affinity for polar compounds.[Citation139] Subsequent analysis of the trapped compounds proceeds by rapidly heating the TD tube in the thermal desorption system of the GC.[Citation91] An advantage of DHS sampling is the capability to include air exchange in the headspace vial or container before and in between sampling, which compares more realistically to indoor air scenarios.
An alternative to vial-based headspace sampling systems is represented by the commercial large dynamic headspace (termed DHS Large) system,[Citation137] using containers with volumes of between 250 and 1000 mL, which are comparable to volumes of small-scale chambers and microchambers (cf. Microchambers section). The DHS Large system was originally introduced to measure small, whole samples, and therefore eliminate the problem of cutting edges (when samples are cut to fit small-scale headspace vials, new surfaces are exposed that would not contribute naturally to VOC emissions). Due to their size and the ability to apply air exchange within the container, the DHS Large system can also be described as an automated microscale chamber.[Citation140]
Even et al.[Citation42] applied DHS-GC-MS to characterize the VOC profiles of diverse products, including 41 samples of plastic toys and decorative articles and calculated DHS scores for each analyte and sample. The ratio of a compound signal (Asample) to the signal of an internal standard (AIS sample) was normalized by the mass of the sample in the DHS vial (sample mass) after subtraction of the signal ratio in the blank measurement (EquationEq. (6)(6)
(6) ). This represents a similar procedure to the TVOC values that are typically calculated using a toluene equivalent to assess VOC emissions from construction products.
(6)
(6)
The calculation of these DHS scores enables a comparison of VOC emissions between different samples under equivalent extraction parameters (i.e., temperature, gas flow and sampling volume). In the aforementioned study, samples with higher DHS scores were selected for further emission analyses using test chambers.[Citation42] If the dynamic headspace parameters are adjusted to yield results that reliably correlate with those obtained with large-scale test chambers, DHS scores can be useful for official control laboratories (OCLs) in market control, especially considering the multiplexing capabilities of this method.
Several extensive studies have been carried out to compare different sampling approaches for diverse products. Masuck et al.,[Citation50] for example, compared headspace SPME, dynamic headspace and full evaporation dynamic headspace sampling to identify the most sensitive screening method for detecting fragrance compounds in toys. VOC extraction via full evaporation dynamic headspace sampling was carried out using ethyl acetate, with subsequent evaporation of an aliquot of the extracts in the headspace vials. This approach yielded the highest sensitivity (in the µg/g range) and best correlation to the concentrations of the fragrance compounds determined in the matrices of the samples. By comparison, the headspace SPME and dynamic headspace extraction approaches yielded concentrations in the ng/g range and were found to correlate well with real emission values, whereby the latter showed a higher sensitivity due to a greater adsorption capacity of the Tenax® TA polymer than the SPME fiber. In another application, Steinemann et al.[Citation41] investigated the VOC emissions of several consumer products, including solid air fresheners and dryer sheets, using a cryogenic pre-concentrator for sampling VOCs from a glass flask with direct GC-MS analysis. Many of the fragrances and VOCs found to emit from the samples were not disclosed on the labels or safety data sheets and some VOCs that were detected are classified as toxic or hazardous.
Overall, dynamic headspace methods can provide better insights into the emission properties of a sample compared to static headspace sampling. Due to their clear resemblance to emission test chamber measurements, dynamic headspace measurements could allow for a good estimation of emission rates when using suitable calibrations and experimental parameters, e.g., airflow rate and material sizing.
Sampling bags
Sampling bags represent an alternative technique for sampling VOCs, whereby the physical sample can be placed into the bag in order to establish a headspace for subsequent extraction and analysis. Sampling can be conducted directly or on a sorbent material that is either placed into the bag with the sample or is brought into contact with the vapor phase after a certain period of equilibration.[Citation22,Citation134,Citation141,Citation142] Before closing the bag, it can be filled with zero-air (i.e., purified air) to establish a clean background into which the VOCs from the sample can emit.[Citation141] As a passive method, bag sampling does not typically include air exchange. Although the sampling bag approach includes headspace enrichment, sampling cannot be easily automated as is carried out in classical headspace sampling methods.
A study published by the Norwegian Institute for Air Research that utilized sampling via bags included the identification and quantitation (as toluene equivalents) of VOCs emitted from children’s toys. The samples were placed into plastic bags filled with zero-air together with passive air samplers based on Tenax® TA adsorption tubes, with sampling conducted for 24 h.[Citation141] Other bag sampling studies include the investigation of odorous compounds emitted from light bulbs conducted by the Danish EPA.[Citation142] Mounted light bulbs were placed in Tedlar® bags and VOCs were collected onto adsorption tubes (in-situ sampling), with subsequent semi-quantitative analyses revealing the presence of acetic acid, n-butanol and toluene, amongst other compounds. Notably, a blank analysis of the air within the sampling bags was included in the study, which should be part of any reliable emission measurement procedure in order to ascertain the presence of potential confounders and account for these accordingly. A further study by the Danish EPA[Citation22] investigated the emissions of “slimy toys," which were sampled by placing these into Rilsan® sampling bags together with adsorbent tubes. Subsequent GC-MS analysis led to the identification of more than 50 compounds, including toluene and cyclohexanone.[Citation22] The aforementioned study on emissions from historic rubber and plastic materials also included sampling via bags in combination with a SPME fiber as a nondestructive method to investigate VOCs emitted by the samples.[Citation134] After placing the samples in the sampling bags (Tedlar® bags), these were left to equilibrate 7 days before inserting a SPME fiber for subsequent compound enrichment and extraction.[Citation134] Bag sampling is also employed in the ISO 12219 standard, relating to interior air of road vehicles, which covers the screening of VOCs emitted from interior car parts, including materials and equipment, such as seats and fairings. Using this approach, the samples are placed into the bag and heated to a specified temperature, which is followed by GC analysis of the gas phase using adsorption tubes.[Citation143]
The use of sampling bags offers the advantages of being suitable to sample emissions from whole products or directly at the sampling site. Disadvantages, on the other hand, include the limited ability for automated sampling (compared to other static headspace enrichment methods), since the sampling material (e.g., Tenax® TA-loaded TD tubes) must be transferred manually to the analytical system, as well as the permeability of many bag polymers [Citation144] or release of constituent VOCs themselves,[Citation134] both aspects of which can compromise sample integrity. Another limitation is that sampling compounds onto a sorbent placed inside the bag is usually not standardized and does not consider the size of the air gap between the sample and the sorbent, nor the loading factor. Accordingly, the distance, and therefore, diffusion length between the sample and the sorbent varies. Consequently, the use of sampling bags without standardized diffusion lengths is only appropriate for samples where mass transfer of the molecules is limited by the diffusion inside the sample material or as a static method under conditions of equilibrium.
Emission test chambers
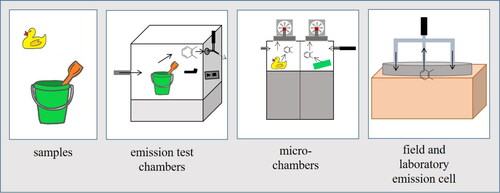
Emission test chambers are widely used to investigate VVOC, VOC or SVOC emissions from materials under controlled climatic conditions. presents an overview of the emission test chambers discussed in this review that are used to determine VOC emissions from consumer products. An emission test chamber is defined by ISO 16000-9 as an “enclosure with controlled operational parameters for the determination of VOCs emitted from building products.”[Citation145] A graphical overview of an emission test chamber with all relevant parameters is provided in this norm.
Figure 3. Overview of emission test chamber methods for the analysis of volatile organic compound (VOC) emissions.
Emission test chambers are available in a variety of shapes, from cylindrical or cuboid to angular, and sizes, ranging from a few cm3 up to several m3, which are classified as microscale, small-scale and large-scale chambers and cells. The chambers are usually constructed of inert materials, such as glass or stainless steel, in order to reduce or prevent the influence of the chamber material on the outcome of the test, e.g., acting as a VOC sink, which is particularly relevant when measuring SVOC emissions. This “sink-effect" describes the ability of components that are emitted from a material to be adsorbed within the emission test chamber or on the emitting material itself.[Citation146] Hence, there are two types of sink-effects: the chamber-inherent sink-effect and the sample-inherent sink-effect. The former is caused by the material of the emission test chamber and influences each test in the chamber; this sink-effect can be easily controlled by the choice of appropriate materials. In contrast, the sample-inherent sink-effect cannot be overcome, since some samples, especially porous building materials, act as “self-sinks" for the compounds they are emitting.[Citation147,Citation148]
Samples, often cut to a suitable size with a defined surface area from which VOCs are emitted, are placed inside the chamber. When samples are reduced in size in this manner, the freshly cut edges are often sealed, e.g., with low-emission aluminum tape, to avoid introducing additional VOC emissions from inner layers of products.[Citation53] Emission tests are then carried out at conditions of controlled temperature, T, relative humidity, rH, air change rate, n, air flow rate, v and product loading factor, L. Typical emission test chamber conditions – as defined in many regulations – are T = 23 °C (room temperature), rH = 50%, and n = 0.5/h.[Citation53,Citation145] These conditions are applied to simulate realistic conditions in indoor environments and are generally used for emission testing, although different parameters may sometimes be applied. Chamber air can be sampled either continuously (e.g., through the use of on-line analyzers, such as PTR-MS) or after specified periods using TD tubes (with subsequent analysis via TD-GC-MS).[Citation139] After analysis, the concentrations, cCA [µg/m3], of the VOCs in the sampled air are calculated. A further parameter, the area-specific air flow rate, q [m3/(m2h)], is calculated from n [1/h] and L [m2/m3] as specified in EquationEq. (7)(7)
(7) [Citation53]:
(7)
(7)
The area-specific emission rate, SERA [µg/(m2h)], of a compound can be calculated from the measured gas phase concentration, cCA, and q, as provided in EquationEq. (8)(8)
(8) . The SERA is useful when comparing results of the same sample investigated in different emission test chambers, because the influence of the chamber volume on cCA is eliminated.[Citation23,Citation53]
(8)
(8)
For quality assurance and quality control of emission test chamber measurements, inter-laboratory tests can be performed with the use of reference materials that exhibit reproducible emissions, greatly improving the reliability of such measurements.[Citation62,Citation75,Citation149–153]
Small- and large-scale emission test chambers
The most commonly used emission test chambers are small- and large-scale chambers, which are used for testing a variety of products. Their size ranges from a few dmCitation3 to 100 m3.[Citation146] Investigation of VOC emissions from construction products and furniture can be carried out according to the German AgBB scheme[Citation76] and the EN 16516 and ISO 16000 norms.[Citation53,Citation145] In these approaches, emission test chambers are loaded with a certain standardized loading factor, L, and sampling is usually carried out after 3 and 28 days, whereby the latter might also include sensory evaluations, depending on the product. Emission test chambers are also used to examine the VOC emissions from a variety of consumer products, whereby the procedures and conditions are often adopted and/or adapted from the regulations for testing construction materials and furniture.[Citation23,Citation154] Due to the generally smaller size of consumer products, the larger emission test chambers are often oversized. To address this issue, Even et al.[Citation23] compared an emission test chamber (203 L), a desiccator (24 L) and a microchamber (44 mL) to explore the comparability of emissions derived from these different chambers for a VOC-doped polyurethan reference material. Similar SERA were obtained with the microchamber as with the 203 L test system within a few hours after loading the chamber, although SERA was higher in the first hours for the two smaller chambers, especially for the more volatile compounds (see ). The outcome of the study indicated that small emission test chambers were well suited to examine the emissions from small-sized consumer products, thereby highlighting the potential application and related benefit for market control purposes.[Citation23]
Figure 4. Emissions of volatile organic compounds (VOCs) from polymer‐based consumer products: Comparison of three emission chamber sizes. Reproduced from Even et al.[Citation23] under public license (https://creativecommons.org/licenses/by/4.0/.).
![Figure 4. Emissions of volatile organic compounds (VOCs) from polymer‐based consumer products: Comparison of three emission chamber sizes. Reproduced from Even et al.[Citation23] under public license (https://creativecommons.org/licenses/by/4.0/.).](/cms/asset/5d9de773-448b-4bfb-9595-0c1582a89842/batc_a_2136484_f0004_b.jpg)
Emission test chamber studies encompass many different consumer products. Bartsch et al.,[Citation93] for example, investigated the emissions of odorous VOCs from various scented consumer products (e.g., candles and printing products) in a desiccator that was repurposed as a small-scale test chamber. TD-GC-MS and GC-O were used as a combination of chemical analysis and a sensory evaluation. At least one EU-regulated fragrance allergen was detected in almost every product.[Citation93] Derudi et al.[Citation155] similarly designed a laboratory-scale test chamber to investigate the VOC emissions of burning scented candles and pointed out the necessity for simple and cheap methods to measure such emissions. Even et al.[Citation42] used a large-scale emission test chamber (203 L) to investigate the VOC emissions from toys and performed an exposure assessment by calculating indoor air concentrations for comparison with guideline values. The Danish EPA[Citation118] presented a method that used a 5.6 L glass container as a sampling vessel for studying the VOC emissions from printed materials. A defined air volume was passed through the adsorption tube filled with either Tenax® TA or activated charcoal, which was subsequently used for quantitation of VOCs emitted by the sample. The investigations were conducted at different times after printing. A decrease in the emission over time was observed for some VOCs, whereas others exhibited maximum emissions after a few days, or the emissions increased continuously during the observation period. Based on their findings, the researchers were able to estimate consumers’ inhalation exposure toward VOCs emitted from printed matter, such as magazines.[Citation118] A similar experimental approach was presented in another study for determining fragrance emissions from different toys.[Citation21] In recent years there have been many applications of emission test chambers to examine VOC emissions from 3D printed materials and during 3D printing processes.[Citation124,Citation156,Citation157] These emissions are of relevance due to the increasing use of these technologies in private households, e.g., to produce children’s toys, or are used directly by children, as in the case of 3D pens.[Citation158]
One special type of a small emission test chamber is the CLIMPAQ (Chamber for Laboratory Investigations of Materials, Pollution and Air Quality), which was introduced by Gunnarsen et al. in 1994.[Citation159] The CLIMPAQ has a volume of either 50 L or 225 L and is made of glass and stainless steel.[Citation160,Citation161] It was developed with the purpose of investigating construction products under defined climatic conditions, such as temperature, ventilation rate and air velocity, which can be adjusted independently to simulate the environmental conditions of different climatic areas.[Citation159] The incorporation of a sniffing port allows a product in the chamber to be additionally assessed for its odor emissions during testing,[Citation159,Citation160] which is especially useful for examining fragranced articles, particularly children’s toys. Until now, the CLIMPAQ has been mainly used to study VOC emissions from construction products, such as floor coverings[Citation162,Citation163] and paints.[Citation164] The latter study investigated the comparability between the field and laboratory emission cell (FLEC) (see section Field and laboratory emission cell), the CLIMPAQ and a small emission test chamber in view of determining initial VOC emission rates from paints. All three chambers were found to deliver comparable emission rates when the test parameters were adapted to the method, e.g., in terms of similar area-specific air flow rates, q.[Citation164] Considering the general experimental configuration and objectives, the CLIMPAQ system is also applicable to consumer products with appropriate sizes.
Microchambers
A subclass of emission test chambers are microchambers, which were introduced onto the market by Markes International Ltd. (Bridgend, UK). These commercial systems are available in two configurations, one with six small cylindrical stainless steel chambers of 44 cm3 each and the other with four slightly larger chambers of 114 cm³ volume. They can be heated to a maximum temperature of 120 °C and 250 °C, respectively.[Citation165] The configuration of these microchamber systems enables four or six samples to be tested in parallel, which is a significant advantage over other emission test chambers. A constant flow of clean air or inert gas is purged through the chambers, whereby the relative humidity can be adjusted by using an appropriate humidifier.[Citation165] Sampling is conducted by connecting TD tubes at the outlets of the individual chambers. The much smaller volume of microchambers compared to larger emission test chambers typically results in significantly higher loading factors, L, when samples are introduced into the chamber.[Citation146] To obtain realistic conditions and comparable area-specific air flow rates as in large-scale chambers or real indoor environments, this therefore needs to be compensated via higher air flow rates, which result in air change rates significantly exceeding 0.5/h. Importantly, due to the small size of the microchamber, it is suitable for the emission testing of small consumer products and facilitates the determination of initial emissions (as described above). Additionally, the small surface area of the chambers reduce the chamber-inherent sink-effect and the option of using higher temperatures allows for improved sampling of SVOCs.[Citation146,Citation166]
The microchamber systems were developed with the purpose of allowing a quick screening of VOC emissions from materials and products.[Citation166] Nowadays, microchambers are common devices in laboratories working in the field of emission testing, where they are often used for pretests or screenings and are helpful tools for material development processes.[Citation75,Citation151] Several standards rely on emission tests using microchambers, such as SVOC emission tests from building products, as specified in the ISO 16000-25 norm.[Citation167] Schripp et al.[Citation166] compared the microchamber (six chamber system with 44 cm3 chambers) with a 1 m3 test chamber by assessing the emissions of three different sample materials, among them polyurethane foams and granular acrylonitrile-butadiene-styrene (ABS). A good qualitative correlation between the results from both chamber types was found, and dead zones, i.e., areas in the chamber without air circulation, were not evident from the experimental data.[Citation166]
In other studies, Nohr et al.,[Citation151] as well as Mull et al.[Citation75] used the microchamber to aid in the development of reproducibly emitting reference materials for VOCs and SVOCs, whereas Marc et al.[Citation24] reported on the use of the microchamber to investigate the emissions of selected mono-aromatic hydrocarbons from children’s toys made of polyamide and ABS copolymer placed in polyethylene packaging in chocolate snacks. The emissions data from the latter experiments led the authors to conclude that the microchamber is suitable for use in the quality control of everyday objects made of polymer materials.[Citation24] In a further study by Marc and Zabiegala,[Citation168] a food contact material, in this case polystyrene lids of coffee-to-go cups, was investigated for the same class of VOCs. Experiments revealed that emission rates were higher at an applied temperature of 80 °C (representing the temperature of the freshly filled beverage) than at 40 °C (representing the cooled beverage).[Citation168]
A comparison of a microchamber with larger test chambers by Even et al.[Citation23] revealed that the SERA of a small piece of a sample in the microchamber was comparable to that of the whole sample in the larger chamber (see ) when the appropriate identical area-specific air flow rates, q, were applied. Recently, the microchamber has also been used to determine VOC emissions from polymer-based costume masks in comparison to a simulated mask-wearing scenario using a doll’s head to assess inhalation exposure. The measured gas phase concentration profiles of six different VOCs from two costume masks were found to be within the same range for both systems, although VOC-specific correction factors of twofold to ninefold were required to obtain corresponding values.[Citation45] Overall, the microchambers represent ideal emission testing systems for small consumer products and facilitate the determination of initial emission peaks.
Field and laboratory emission cell
The field and laboratory emission cell (FLEC) system was introduced in 1991.[Citation169] It consists of an almost flat stainless-steel plate with a cavity on one side, exhibiting a volume of 35 mL and is supplied with clean and humidified air.[Citation170] In addition to the air inlet at opposite sides of the cell, an outlet accommodates for the collection of VOCs by trapping on an appropriate sampling material.[Citation51,Citation169,Citation170] Due to its small size and transportability, the FLEC can be brought to the sample site (in situ sampling), which is an advantage over most other emission test chambers.[Citation51] Use of the FLEC proceeds by mounting it on the surface of the test material to seal the emission cell, covering surface areas of up to 177 cm2. This configuration leads to a high loading factor, L, and necessitates high air change rates, n.[Citation170] As with the microchambers, an advantage of the FLEC is the reduced sink-effect due to the low surface area of the cell. The FLEC was developed to allow nondestructive, in situ emission testing of VOCs from construction materials,[Citation170] such as walls and floor coverings, e.g., polyvinylchloride (PVC),[Citation171,Citation172] floor varnish or carpet,[Citation172] resins in adhesives[Citation173] and paint.[Citation164] Applications for other product categories are also imaginable, for example, VOC emission measurements on consumer products with flat surfaces, such as toys (e.g., foam puzzles), textiles (e.g., clothing, blankets), or sports mats, amongst many others.
Further sampling methods applied in other fields of VOC emissions analysis
Besides the investigations of VOC emissions from consumer products, the release of volatiles is studied in various other settings, such as in relation to building materials and furniture [Citation9,Citation174,Citation175] or from biological samples and food.[Citation176–179] This section briefly outlines sampling methods for VOC emissions measurements that are mainly applied for materials and product categories beyond consumer products, albeit with potential application for emission testing of the latter.
Headspace sorptive extraction and sorptive tape extraction
The technique of headspace sorptive extraction (headspace-SE) is broadly used in food science and biology to examine VOC emissions of the respective matrices.[Citation176–182] Although these methods have hitherto only rarely been implemented in consumer product studies, they are briefly covered in this review due to their relevance as inexpensive techniques for indicative or even quantitative measurements.
The extraction principle used in headspace-SE is similar to headspace-SPME, whereby a sorbent-coated sampling device, such as a stir bar or probe, is exposed to the sample headspace in order to absorb volatiles into its polymer phase.[Citation127,Citation179,Citation180,Citation183,Citation184] Stir-bar sorptive extraction (SBSE) was originally developed to sample volatiles from aqueous sample matrices and exhibits a sorbent volume that is usually much higher than that of typical SPME fiber coatings.[Citation180,Citation185] The most commonly used sorbent for SBSE or headspace-SE is polydimethylsiloxane (PDMS),[Citation127,Citation177,Citation179,Citation180] but further materials have also been developed and tested.[Citation182,Citation186]
Although less commonly used, sorptive tape extraction (STE) is an alternative sampling approach that utilizes a tape consisting of a thin PDMS film that is either exposed to the sample headspace or brought into direct contact with the sample matrix. In the latter approach, the degree of extraction is driven by the partitioning of volatiles between the sample and the applied polymer matrix (i.e., the tape).[Citation127,Citation187,Citation188] Accordingly, this technique is not suitable for directly estimating VOC emissions of a product into the gas phase, but represents a potential method to estimate VOC loads when appropriate mass transport models are applied and crucial parameters of the matrix and molecule are known.
Overall, headspace-SE or STE can be advantageous for in situ sampling or to increase compound recovery and sensitivity compared to classical enrichment methods, such as SPME.[Citation176,Citation180,Citation183] Non-static conditions may be achieved by applying appropriate sorbents that act as sinks. In this scenario, VOCs could be sampled with a constant mass flux from the sample toward the sorptive tape under non-static conditions, i.e., when the internal diffusion resistance within the tape is negligible and the phase volume is sufficiently large (see section Passive flux sampler).
Passive flux sampler
Passive flux samplers (PFS) represent sampling systems for niche applications but with the potential to be utilized in consumer products testing. The sampling device is comparable to a petri dish equipped with an adsorbent material on the inner surface.[Citation51,Citation74,Citation189,Citation190] The PFS is placed on a flat surface and VOCs emitted from this surface are sampled onto the adsorbent, after which they can be thermally desorbed prior to analysis. The emissions flux inside the device is based on Fick’s laws of diffusion taking into account the diffusion coefficient in the air, Da, the gas phase concentration at the adsorbent, the volatile concentration in the gas phase at the emissions source, as well as the diffusion length within the PFS.[Citation51,Citation74,Citation189] The sampling principles are, therefore, similar to those of headspace-STE. The use of PFS has been reported for the analysis of VVOCs, VOCs and SVOCs in the investigation of emissions characteristics from building materials and furniture,[Citation9,Citation74,Citation174,Citation175,Citation189,Citation191–193] although emissions from human skin have also been explored using this approach.[Citation194,Citation195]
In relation to building materials and indoor settings, Shinohara et al.[Citation74] investigated the performance of PFS to determine formaldehyde emissions from indoor surfaces, particularly focusing on the physical processes involved in passive flux sampling. The formaldehyde emissions determined via this approach were shown to be in good agreement with emission test chamber data.[Citation74] In a further study, Shinohara et al.[Citation9] investigated VOC emissions from indoor building materials and furnishings. Noguchi and Yamasaki[Citation196] used a PFS to characterize VOC emissions from polymer sheets during thermal degradation. A wide variety of different polymer sheets was selected, among them samples representing commercially available consumer products (e.g., a plastic bag, a raincoat, foam sheets). Samples were placed in a temperature-controlled chamber and stored for up to 30 days, with subsequent sampling conducted at different temperatures of up to 75 °C for 24 h. The emission rate was calculated in relation to the concentration of the compound in the sample material, the sampling time and the cross-sectional area of the sample.[Citation196] Marc et al.[Citation174] reported on a method developed for the emissions measurement of monoterpenes using a self-constructed PFS, which was used in screening studies to estimate the emissions flux of selected VOCs. In another study by Marc et al.,[Citation191] emissions of selected VOCs from building materials sampled either with a PFS or with a microchamber were compared. Although the use of PFS was deemed particularly advantageous for in situ sampling, stationary chamber approaches were noted as being beneficial when more detailed emissions data are required.[Citation191] Furthermore, it was proposed that sampling is conducted at multiple points due to the heterogeneity of some materials.[Citation74,Citation193] Considering the physical processes underlying VOC emissions, PFS may pose a promising tool to estimate VOC emissions fluxes from flat product surfaces, albeit with some limitations.[Citation74,Citation191,Citation193]
Summary and conclusion
Inhalation exposure to VOCs is significantly modulated by IAQ. The increasing efficiency of thermal insulation of indoor environments and the concomitant reduction in air exchange accounts for an accumulation of VOCs in the gas phase, some of which might negatively affect human health and wellbeing. Identifying and quantifying VOCs that are present in the air that we breathe is a prerequisite for many important processes in industry (product design and improvement), academic research (analytical method development) and regulatory authorities (compliance testing, risk assessment and consumer protection).
While extensive research has been conducted in the field of emission testing of construction products and furniture, interest in VOC emissions from everyday consumer products has grown in recent decades. The utilization and size of durable consumer goods entail that the classical emission measurement procedures applied to construction materials are not always readily applicable to those products. This review article has sought to expound and evaluate sampling methods for determining VOC emissions from consumer products.
Headspace techniques represent fast and easy methods for examining VOC emissions without extensive sample preparation or complex experimental configurations. High-throughput and process automation makes these suitable for screening approaches, delivering comprehensive VOC profiles. Most static headspace approaches (including SPME) are useful to identify VOC constituents released by consumer products, but the detected amounts do not reflect VOC emissions under realistic indoor conditions, and therefore, do not allow for a precise assessment of inhalation exposure without making major assumptions.
In contrast, emission test chamber approaches allow for the adjustment of environmental conditions, such as air exchange and humidity, and thereby deliver more realistic inhalation exposure scenarios. These systems have proven invaluable for VOC emission testing in many cases and for many products. Major disadvantages, however, are high costs and time expenditure, together with low sample throughput. The implementation of microchambers could overcome these issues, since multiple samples can be tested in parallel. Especially in relation to consumer products, the size of the individual chambers is more suitable for these typically small-sized products. The relatively high air change rates of microchamber systems can be compensated by adopting the loading factor, resulting in similar area-specific air flow rates as in large-scale chambers.
Dynamic headspace extraction approaches combine the advantages of static headspace sampling and emission test chambers, especially when using larger vessels (e.g., DHS Large). Dynamic headspace sampling can be conducted in an automated fashion when the extraction device is coupled to an analyzer, such as GC-MS, for subsequent analysis. Importantly, air change rates can be adjusted to equivalent conditions of emission test chambers. Other methods, such as headspace SE and PFS, that can also be applied as nondestrucive in-situ tools and which have hitherto not or only rarely been used for small durable consumer products, offer alternatives for quick and cost-efficient sampling of VOCs emitted from various matrices. Nevertheless, these methods do not allow for the adjustment of environmental conditions, such as air change rates, as is similarly the case for sampling bags used for passive sampling.
Beyond the application of different sampling methods, the consideration of physical mechanisms involved in VOC emissions is an advantageous tool for the evaluation of emission processes. Such considerations can be used to estimate the extent of VOC emissions depending on the compound, the sample matrix and handling or environmental conditions. Furthermore, sampling parameters can be adapted to specific needs in relation to the physical properties of the compounds and samples under consideration.
This review further explored the current lack of guidelines and standardized procedures for VOC sampling from durable consumer products, especially those of smaller sizes, which are an indispensable factor in everyday modern life, and thus, contribute to the inhalation exposure of VOCs in indoor settings. The method for exploring VOC emissions from consumer goods must be carefully chosen in order to gain the desired information, e.g., a screening for compound identification, estimation of their emissions or detailed knowledge of their emission rates. Given the considerations outlined above, it becomes obvious that the field of VOC emissions measurement for consumer products offers room for further research, method development and optimization. In this context, it might be advantageous to include the physical principles underlying VOC emissions from different consumer products in exposure estimates. The emission kinetics are determined by the physical properties of the compound and the sample matrix, as well as the environmental conditions. Therefore, mass transfer modeling can be a useful tool to gain deeper insights into the processes involved and to describe the kinetics of VOC emissions in order to optimize and adjust sampling conditions, and to draw further conclusions on inhalation exposure from the available emissions data.
| Nomenclature | ||
| Ablank | = | area of compound signal in the blank |
| AIS blank | = | area of internal standard signal in the blank |
| AIS sample | = | area of internal standard signal in the sample |
| Asample | = | area of compound signal in the sample |
| β | = | ratio between the volumes of gas phase and sample phase (dimensionless) |
| ca | = | VOC gas phase concentration around the sample surface (mass/volume) |
| cba | = | VOC concentration in the bulk air (mass/volume) |
| cca | = | VOC concentration in the chamber air (mass/volume) |
| cm | = | VOC concentration within the sample material (mass/volume) |
| cm,surface | = | VOC concentration at the material surface (mass/volume) |
| d | = | material thickness (length) |
| Dm | = | diffusion coefficient of the VOC within the sample material (area/time) |
| Da | = | diffusion coefficient of the VOC within air (area/time) |
| h | = | convective mass transfer coefficient (length/time) |
| Ka,m | = | air/sample material partition coefficient of the VOC (dimensionless) |
| Km,a | = | sample material/air partition coefficient of the VOC (dimensionless) |
| Ks,a | = | sorbent/air partition coefficient of the VOC (dimensionless) |
| L | = | loading factor (area/volume) |
| n | = | air change rate (1/time) |
| rH | = | relative humidity (percent) |
| T | = | temperature (°C) |
| t | = | time |
| q | = | area-specific air flow rate (volume/(area·time)) |
| SERA | = | area-specific emission rate (mass/(area·time)) |
| v | = | air flow rate (volume/time) |
| y | = | diffusion coordinate (length) |
Acknowledgment
We thank Dr. Christoph Hutzler for valuable discussions during the conceptualization phase of this review article.
Disclosure statement
The authors report there are no competing interests to declare.
Additional information
Funding
References
- Mitchell, C. S.; Zhang, J.; Sigsgaard, T.; Jantunen, M.; Lioy, P. J.; Samson, R.; Karol, M. H. Current State of the Science: Health Effects and Indoor Environmental Quality. Environ. Health Perspect. 2007, 115, 958–964. DOI: 10.1289/ehp.8987.
- Righi, E.; Aggazzotti, G.; Fantuzzi, G.; Ciccarese, V.; Predieri, G. Air Quality and Well-Being Perception in Subjects Attending University Libraries in Modena (Italy). Sci. Total Environ. 2002, 286, 41–50. DOI: 10.1016/S0048-9697(01)00960-3.
- Bruinen De Bruin, Y.; Koistinen, K.; Kephalopoulos, S.; Geiss, O.; Tirendi, S.; Kotzias, D. Characterisation of Urban Inhalation Exposures to Benzene, Formaldehyde and Acetaldehyde in the European Union: Comparison of Measured and Modelled Exposure Data. Environ. Sci. Pollut. Res. Int. 2008, 15, 417–430. DOI: 10.1007/s11356-008-0013-4.
- Mannan, M.; Al-Ghamdi, S. G. Indoor Air Quality in Buildings: A Comprehensive Review on the Factors Influencing Air Pollution in Residential and Commercial Structure. IJERPH. 2021, 18, 3276. DOI: 10.3390/ijerph18063276.
- Vornanen-Winqvist, C.; Järvi, K.; Andersson, M. A.; Duchaine, C.; Létourneau, V.; Kedves, O.; Kredics, L.; Mikkola, R.; Kurnitski, J.; Salonen, H. Exposure to Indoor Air Contaminants in School Buildings with and without Reported Indoor Air Quality Problems. Environ. Int. 2020, 141, 105781. DOI: 10.1016/j.envint.2020.105781.
- Billionnet, C.; Gay, E.; Kirchner, S.; Leynaert, B.; Annesi-Maesano, I. Quantitative Assessments of Indoor Air Pollution and Respiratory Health in a Population-Based Sample of French Dwellings. Environ. Res. 2011, 111, 425–434. DOI: 10.1016/j.envres.2011.02.008.
- Heeley-Hill, A. C.; Grange, S. K.; Ward, M. W.; Lewis, A. C.; Owen, N.; Jordan, C.; Hodgson, G.; Adamson, G. Frequency of Use of Household Products Containing VOCs and Indoor Atmospheric Concentrations in Homes. Environ. Sci. Process. Impacts 2021, 23, 699–713. DOI: 10.1039/D0EM00504E.
- Kotzias, D.; Geiss, O.; Tirendi, S.; Barrero-Moreno, J.; Reina, V.; Gotti, A.; Cimino-Reale, G.; Casati, B.; Marafante, E.; Sarigiannis, D. Exposure to Multiple Air Contaminants in Public Buildings, Schools and Kindergartens - the European Indoor Air Monitoring and Exposure Assessment (Airmex) Study. Fresenius Environ. Bull. 2009, 18, 670–681.
- Shinohara, N.; Kai, Y.; Mizukoshi, A.; Fujii, M.; Kumagai, K.; Okuizumi, Y.; Jona, M.; Yanagisawa, Y. On-Site Passive Flux Sampler Measurement of Emission Rates of Carbonyls and VOCs from Multiple Indoor Sources. Build. Environ. 2009, 44, 859–863. DOI: 10.1016/j.buildenv.2008.06.007.
- Wilke, O.; Horn, W.; Richter, M.; Jann, O. Volatile Organic Compounds from Building Products—Results from Six Round Robin Tests with Emission Test Chambers Conducted between 2008 and 2018. Indoor Air 2021, 31, 2049–2057. DOI: 10.1111/ina.12848.
- Yu, C.; Crump, D. A Review of the Emission of VOCs from Polymeric Materials Used in Buildings. Build. Environ. 1998, 33, 357–374. DOI: 10.1016/S0360-1323(97)00055-3.
- Wallace, L. A.; Pellizzari, E.; Leaderer, B.; Zelon, H.; Sheldon, L. Emissions of Volatile Organic Compounds from Building Materials and Consumer Products. Atmos. Environ. 1987, 21, 385–393. DOI: 10.1016/0004-6981(87)90017-5.
- Steinemann, A. Volatile Emissions from Common Consumer Products. Air Qual. Atmos. Health 2015, 8, 273–281. DOI: 10.1007/s11869-015-0327-6.
- Kwon, K.-D.; Jo, W.-K.; Lim, H.-J.; Jeong, W.-S. Characterization of Emissions Composition for Selected Household Products Available in Korea. J. Hazard Mater. 2007, 148, 192–198. DOI: 10.1016/j.jhazmat.2007.02.025.
- Lim, S. K.; Shin, H. S.; Yoon, K. S.; Kwack, S. J.; Um, Y. M.; Hyeon, J. H.; Kwak, H. M.; Kim, J. Y.; Kim, T. H.; Kim, Y. J.; et al. Risk Assessment of Volatile Organic Compounds Benzene, Toluene, Ethylbenzene, and Xylene (BTEX) in Consumer Products. J. Toxicol. Environ. Health A 2014, 77, 1502–1521. DOI: 10.1080/15287394.2014.955905.
- Yeoman, A. M.; Shaw, M.; Lewis, A. C. Estimating Person-to-Person Variability in VOC Emissions from Personal Care Products Used during Showering. Indoor Air 2021, 31, 1281–1291. DOI: 10.1111/ina.12811.
- Cheng, S.; Wang, G.; Lang, J.; Wen, W.; Wang, X.; Yao, S. Characterization of Volatile Organic Compounds from Different Cooking Emissions. Atmos. Environ. 2016, 145, 299–307. DOI: 10.1016/j.atmosenv.2016.09.037.
- Xu, M.; Tang, Z.; Duan, Y.; Liu, Y. GC-Based Techniques for Breath Analysis: Current Status, Challenges, and Prospects. Crit. Rev. Anal. Chem. 2016, 46, 291–304. DOI: 10.1080/10408347.2015.1055550.
- Tang, X.; Misztal, P. K.; Nazaroff, W. W.; Goldstein, A. H. Volatile Organic Compound Emissions from Humans Indoors. Environ. Sci. Technol. 2016, 50, 12686–12694. DOI: 10.1021/acs.est.6b04415.
- Drabińska, N.; Flynn, C.; Ratcliffe, N.; Belluomo, I.; Myridakis, A.; Gould, O.; Fois, M.; Smart, A.; Devine, T.; de Lacy Costello, B. A Literature Survey of All Volatiles from Healthy Human Breath and Bodily Fluids: The Human Volatilome. J. Breath Res. 2021, 15, 034001. DOI: 10.1088/1752-7163/abf1d0.
- Danish Environmental Protection Agency. Mapping of Perfume in Toys and Children’s Articles. Survey of Chemical Substances in Consumer Products, No. 68. 2006.
- Danish Environmental Protection Agency. Survey and Release of Chemical Substances in “Slimy” Toys. Survey of Chemical Substances in Consumer Products, No. 67. 2005.
- Even, M.; Hutzler, C.; Wilke, O.; Luch, A. Emissions of Volatile Organic Compounds from Polymer-Based Consumer Products: Comparison of Three Emission Chamber Sizes. Indoor Air 2020, 30, 40–48. DOI: 10.1111/ina.12605.
- Marć, M.; Formela, K.; Klein, M.; Namieśnik, J.; Zabiegała, B. The Emissions of Monoaromatic Hydrocarbons from Small Polymeric Toys Placed in Chocolate Food Products. Sci. Total Environ. 2015, 530-531, 290–296. DOI: 10.1016/j.scitotenv.2015.05.105.
- Kang, S.; Lee, K.; Lim, M. Estimation of Multi-Route Exposures to Various Chemicals during Children’s Clay Toy Use. Environ. Res. 2022, 212, 113500. DOI: 10.1016/j.envres.2022.113500.
- Masuck, I.; Hutzler, C.; Jann, O.; Luch, A. Inhalation Exposure of Children to Fragrances Present in Scented Toys. Indoor Air 2011, 21, 501–511. DOI: 10.1111/j.1600-0668.2011.00727.x.
- Goodman, N.; Nematollahi, N. Fragranced Consumer Products as Sources. In Handbook of Indoor Air Quality; Zhang, Y., Hopke, P. K., Mandin, C., Eds.; Springer: Singapore, 2022; pp 1–33. DOI: 10.1007/978-981-10-5155-5_14-1.
- Palmisani, J.; di Gilio, A.; Cisternino, E.; Tutino, M.; de Gennaro, G. Volatile Organic Compound (VOC) Emissions from a Personal Care Polymer-Based Item: Simulation of the Inhalation Exposure Scenario Indoors under Actual Conditions of Use. Sustainability 2020, 12, 2577. DOI: 10.3390/su12072577.
- Bundesministeriums der Justiz und für Verbraucherschutz. Lebensmittel-, Bedarfsgegenstände- Und Futtermittelgesetzbuch - LFGB. Bundesministerium der Justiz und für Verbraucherschutz: Berlin. 2005, pp 1–66.
- Holøs, S. B.; Yang, A.; Lind, M.; Thunshelle, K.; Schild, P.; Mysen, M. VOC Emission Rates in Newly Built and Renovated Buildings, and the Influence of Ventilation – A Review and Meta-Analysis. Int. J. Vent. 2019, 18, 153–166. DOI: 10.1080/14733315.2018.1435026.
- Wolkoff, P.; Wilkins, C. K.; Clausen, P. A.; Nielsen, G. D. Organic Compounds in Office Environments - Sensory Irritation, Odor, Measurements and the Role of Reactive Chemistry. Indoor Air 2006, 16, 7–19. DOI: 10.1111/j.1600-0668.2005.00393.x.
- Annesi-Maesano, I.; Hulin, M.; Lavaud, F.; Raherison, C.; Kopferschmitt, C.; de Blay, F.; Charpin, D. A.; Denis, C. Poor Air Quality in Classrooms Related to Asthma and Rhinitis in Primary Schoolchildren of the French 6 Cities Study. Thorax 2012, 67, 682–688. DOI: 10.1136/thoraxjnl-2011-200391.
- Rumchev, K.; Spickett, J.; Bulsara, M.; Phillips, M.; Stick, S. Association of Domestic Exposure to Volatile Organic Compounds with Asthma in Young Children. Thorax 2004, 59, 746–751. DOI: 10.1136/thx.2003.013680.
- Geiss, O.; Giannopoulos, G.; Tirendi, S.; Barrero-Moreno, J.; Larsen, B. R.; Kotzias, D. The AIRMEX Study - VOC Measurements in Public Buildings and Schools/Kindergartens in Eleven European Cities: Statistical Analysis of the Data. Atmos. Environ. 2011, 45, 3676–3684. DOI: 10.1016/j.atmosenv.2011.04.037.
- Hofmann, H.; Plieninger, P. Bereitstellung Einer Datenbank Zum Vorkommen Von Flüchtigen Organischen Verbindungen in Der Raumluft; Umweltbundesamt, Ed.; 2008.
- Abe, Y.; Yamaguchi, M.; Mutsuga, M.; Kawamura, Y.; Akiyama, H. Survey of Volatile Substances in Kitchen Utensils Made from Acrylonitrile–Butadiene–Styrene and Acrylonitrile–Styrene Resin in Japan. Food Sci. Nutr. 2014, 2, 236–243. DOI: 10.1002/fsn3.100.
- Abe, Y.; Yamaguchi, M.; Mutsuga, M.; Akiyama, H.; Kawamura, Y. Volatile Substances in Polymer Toys Made from Butadiene and Styrene. AJAC. 2013, 04, 229–237. DOI: 10.4236/ajac.2013.45029.
- Denk, P.; Velasco-Schön, C.; Buettner, A. Resolving the Chemical Structures of Off-Odorants and Potentially Harmful Substances in Toys—Example of Children’s Swords. Anal. Bioanal. Chem. 2017, 409, 5249–5258. DOI: 10.1007/s00216-017-0469-5.
- Wiedmer, C.; Velasco-Schön, C.; Buettner, A. Characterization of Off-Odours and Potentially Harmful Substances in a Fancy Dress Accessory Handbag for Children. Sci. Rep. 2017, 7, 1807. DOI: 10.1038/s41598-017-01720-5.
- Masuck, I.; Hutzler, C.; Luch, A. Investigations on the Emission of fragrance allergens from Scented Toys by Means of Headspace Solid-Phase Microextraction Gas Chromatography–Mass Spectrometry. J. Chromatogr. A 2010, 1217, 3136–3143. DOI: 10.1016/j.chroma.2010.02.072.
- Steinemann, A.; MacGregor, I. C.; Gordon, S. M.; Gallagher, L. G.; Davis, A. L.; Ribeiro, D. S.; Wallace, L. A. Fragranced Consumer Products: Chemicals Emitted, Ingredients Unlisted. Environ. Impact Assess. Rev. 2011, 31, 328–333. DOI: 10.1016/j.eiar.2010.08.002.
- Even, M.; Girard, M.; Rich, A.; Hutzler, C.; Luch, A. Emissions of VOCs From Polymer-Based Consumer Products: From Emission Data of Real Samples to the Assessment of Inhalation Exposure. Front. Public Health 2019, 7, 202. DOI: 10.3389/fpubh.2019.00202.
- García Ibarra, V.; Rodríguez Bernaldo de Quirós, A.; Paseiro Losada, P.; Sendón, R. Identification of Intentionally and Non-Intentionally Added Substances in Plastic Packaging Materials and Their Migration into Food Products. Anal. Bioanal. Chem. 2018, 410, 3789–3803. DOI: 10.1007/s00216-018-1058-y.
- German Federal Institute for Risk Assessment (BfR). Risk Assessment https://www.bfr.bund.de/en/risk_assessment-1833.html (accessed Aug 22, 2022).
- Even, M.; Roloff, A.; Lüttgert, N.; Beauchamp, J.; Stalter, D.; Schulte, A.; Hutzler, C.; Luch, A. Exposure Assessment of Toxicologically Relevant Volatile Organic Compounds Emitted from Polymer-Based Costume Masks. Chem. Res. Toxicol. 2021, 34, 132–143. DOI: 10.1021/acs.chemrestox.0c00414.
- Halios, C. H.; Landeg-Cox, C.; Lowther, S. D.; Middleton, A.; Marczylo, T.; Dimitroulopoulou, S. Chemicals in European Residences – Part I: A Review of Emissions, Concentrations and Health Effects of Volatile Organic Compounds (VOCs). Sci. Total Environ. 2022, 839, 156201. DOI: 10.1016/j.scitotenv.2022.156201.
- Cabanes, A.; Valdés, F. J.; Fullana, A. A Review on VOCs from Recycled Plastics. Sustain. Mater.Technol. 2020, 25, e00179. DOI: 10.1016/j.susmat.2020.e00179.
- Barro, R.; Regueiro, J.; Llompart, M.; Garcia-Jares, C. Analysis of Industrial Contaminants in Indoor Air: Part 1. Volatile Organic Compounds, Carbonyl Compounds, Polycyclic Aromatic Hydrocarbons and Polychlorinated Biphenyls. J. Chromatogr. A 2009, 1216, 540–566. DOI: 10.1016/j.chroma.2008.10.117.
- Wang, D. K. W.; Austin, C. C. Determination of Complex Mixtures of Volatile Organic Compounds in Ambient Air: An Overview. Anal. Bioanal. Chem. 2006, 386, 1089–1098. DOI: 10.1007/s00216-006-0475-5.
- Masuck, I.; Hutzler, C.; Luch, A. Screening of Fragrances in Scented Toys: A Comparative Study of Different Headspace Techniques Coupled to GC-MS. Anal. Methods 2013, 5, 508–515. DOI: 10.1039/C2AY26209F.
- Marć, M.; Zabiegała, B.; Namieśnik, J. Testing and Sampling Devices for Monitoring Volatile and Semi-Volatile Organic Compounds in Indoor Air. TrAC, Trends Anal. Chem. 2012, 32, 76–86. DOI: 10.1016/j.trac.2011.09.006.
- World Health Organization. Assessment of Exposure to Indoor Air Pollutants; WHO Regional Publications European Series, 1997.
- European Committee for Standardization. EN 16516 Construction Products - Assessment of Release of Dangerous Substances - Determination of Emissions into Indoor Air; 2017.
- International Labour Organization and World Health Organization. International Chemical Safety Cards. Hexane https://www.ilo.org/dyn/icsc/showcard.display?p_lang=en&p_card_id=0279&p_version=2 (accessed Aug 19, 2022).
- U.S. Environmental Protection Agency. Comptox Chemicals Dashboard. Hexadecane https://comptox.epa.gov/dashboard/chemical/properties/DTXSID0027195 (accessed Aug 19, 2022).
- Deng, B.; Kim, C. N. An Analytical Model for VOCs Emission from Dry Building Materials. Atmos. Environ. 2004, 38, 1173–1180. DOI: 10.1016/j.atmosenv.2003.11.009.
- Huang, H.; Haghighat, F. Modelling of Volatile Organic Compounds Emission from Dry Building Materials. Build. Environ. 2002, 37, 1127–1138. DOI: 10.1016/S0360-1323(01)00089-0.
- Little, J. C.; Hodgson, A. T.; Gadgil, A. J. Modeling Emissions of Volatile Organic Compounds from New Carpets. Atmos. Environ. 1994, 28, 227–234. DOI: 10.1016/1352-2310(94)90097-3.
- Liu, Z.; Ye, W.; Little, J. C. Predicting Emissions of Volatile and Semivolatile Organic Compounds from Building Materials: A Review. Build. Environ. 2013, 64, 7–25. DOI: 10.1016/j.buildenv.2013.02.012.
- Huang, L.; Jolliet, O. A Parsimonious Model for the Release of Volatile Organic Compounds (VOCs) Encapsulated in Products. Atmos. Environ. 2016, 127, 223–235. DOI: 10.1016/j.atmosenv.2015.12.001.
- Liu, Z.; Yan, Y.; Liu, T.; Zhao, Y.; Huang, Q.; Huang, Z. How to Predict Emissions of Volatile Organic Compounds from Solid Building Materials? A Critical Review on Mass Transfer Models. J. Environ. Manage. 2022, 302, 114054. DOI: 10.1016/j.jenvman.2021.114054.
- Cox, S. S.; Liu, Z.; Little, J. C.; Howard-Reed, C.; Nabinger, S. J.; Persily, A. Diffusion-Controlled Reference Material for VOC Emissions Testing: Proof of Concept. Indoor Air 2010, 20, 424–433. DOI: 10.1111/j.1600-0668.2010.00666.x.
- Ramachandran, P. A. Mass Transfer Processes. In Modeling, Computations, and Design; Prentice Hall: Boston, 2018.
- Kolb, B.; Ettre, L. S. Static Headspace – Gas Chromatography : Theory and Practice, 2nd ed.; Wiley-Interscience: Hoboken, NJ, 2006.
- Kolb, B.; Welter, C.; Bichler, C. Determination of Partition Coefficients by Automatic Equilibrium Headspace Gas Chromatography by Vapor Phase Calibration. Chromatographia 1992, 34, 235–240. DOI: 10.1007/BF02268351.
- Liu, Z.; Nicolai, A.; Abadie, M.; Qin, M.; Grunewald, J.; Zhang, J. Development of a Procedure for Estimating the Parameters of Mechanistic VOC Emission Source Models from Chamber Testing Data. Build. Simul. 2021, 14, 269–282. DOI: 10.1007/s12273-020-0616-3.
- Xu, Y.; Zhang, Y. An Improved Mass Transfer Based Model for Analyzing VOC Emissions from Building Materials. Atmos. Environ. 2003, 37, 2497–2505. DOI: 10.1016/S1352-2310(03)00160-2.
- Cox, S. S.; Zhao, D.; Little, J. C. Measuring Partition and Diffusion Coefficients for Volatile Organic Compounds in Vinyl Flooring. Atmos. Environ. 2001, 35, 3823–3830. DOI: 10.1016/S1352-2310(01)00175-3.
- Xiong, J.; Huang, S.; Zhang, Y. A Novel Method for Measuring the Diffusion, Partition and Convective Mass Transfer Coefficients of Formaldehyde and VOC in Building Materials. PLoS One 2012, 7, e49342. DOI: 10.1371/journal.pone.0049342.
- Xu, J.; Zhang, J. S. An Experimental Study of Relative Humidity Effect on VOCs’ Effective Diffusion Coefficient and Partition Coefficient in a Porous Medium. Build. Environ. 2011, 46, 1785–1796. DOI: 10.1016/j.buildenv.2011.02.007.
- He, G.; Yang, X.; Shaw, C. Y. Material Emission Parameters Obtained Through Regression. Indoor Built Environ. 2005, 14, 59–68. DOI: 10.1177/1420326X05050347.
- Huang, L.; Jolliet, O. A Quantitative Structure‐Property Relationship (QSPR) for Estimating Solid Material‐Air Partition Coefficients of Organic Compounds. Indoor Air 2019, 29, 79–88. DOI: 10.1111/ina.12510.
- Holmgren, T.; Persson, L.; Andersson, P. L.; Haglund, P. A Generic Emission Model to Predict Release of Organic Substances from Materials in Consumer Goods. Sci. Total Environ. 2012, 437, 306–314. DOI: 10.1016/j.scitotenv.2012.08.020.
- Shinohara, N.; Fujii, M.; Yamasaki, A.; Yanagisawa, Y. Passive Flux Sampler for Measurement of Formaldehyde Emission Rates. Atmos. Environ. 2007, 41, 4018–4028. DOI: 10.1016/j.atmosenv.2007.01.028.
- Mull, B.; Sauerwald, T.; Schultealbert, C.; Horn, W.; Brödner, D.; Richter, M. Reproducibly Emitting Reference Material for Volatile and Semi-Volatile Organic Compounds - Using Finite Element Modeling for Emission Predictions. Air Qual. Atmos. Health 2017, 10, 1237–1246. DOI: 10.1007/s11869-017-0508-6.
- Ausschuss zur gesundheitlichen Bewertung von Bauprodukten. Anforderungen an Die Innenraumluftqualität in Gebäuden: Gesundheitliche Bewertung Der Emissionen Von Flüchtigen Organischen Verbindungen (VVOC, VOC Und SVOC) Aus Bauprodukten. 2021.
- Masuck, I.; Hutzler, C.; Luch, A. Estimation of Dermal and Oral Exposure of Children to Scented Toys: Analysis of the Migration of Fragrance Allergens by Dynamic Headspace GC-MS. J. Sep. Sci. 2011, 34, 2686–2696. DOI: 10.1002/jssc.201100360.
- Schmid, P.; Welle, F. Chemical Migration from Beverage Packaging Materials—A Review. Beverages 2020, 6, 37. DOI: 10.3390/beverages6020037.
- Franz, R.; Welle, F. Migration Measurement and Modelling from Poly(Ethylene Terephthalate) (PET) into Soft Drinks and Fruit Juices in Comparison with Food Simulants. Food Addit. Contam. Part A Chem. Anal. Control Expo. Risk Assess. 2008, 25, 1033–1046. DOI: 10.1080/02652030701837381.
- The European Parliament and the Council of the European Union. Directive 2009/48/EC of the European Parliament and of the Council of 18 June 2009 on the Safety of Toys; 2009.
- The European Parliament and the Council of the European Union. Regulation (EC) No 1907/2006 of the European Parliament and of the Council of 18 December 2006 Concerning the Registration, Evaluation, Authorisation and Restriction of Chemicals (REACH); 2006.
- European Commission. Agreed EU-LCI Values https://ec.europa.eu/docsroom/documents/49239 (accessed Aug 19, 2022).
- European Commission. EU-LCI value facts and information https://single-market-economy.ec.europa.eu/sectors/construction/eu-lci-subgroup/eu-lci-values_en (accessed Aug 19, 2022).
- European Committee for Standardization. Indoor Air (ISO 16000).
- European Chemicals Agency. ANNEX XV Restriction Report - Formaldehyde and Formaldehyde Releasers; 2019.
- Scientific Committee on Health Environmental and Emerging Risks (SCHEER). Toxicological Reference Values for Certain organic chemicals emitted from Squishy Toys with Regard to Adopting Limit Values under the Toy Safety Directive 2009/48/EC “Chemicals in Squishy Toys; 2021.
- Ad hoc Working Group on Indoor Air Guide Values (IRK/AOLG). Hygienic Guide Values for TVOC in Indoor Air; 2007.
- German Committee on Indoor Air Guide Values (AIR). Indoor Air Guide Values (I and II) for the Concentration of Specific Substances in Indoor Air; 2022.
- Aragón, P.; Atienza, J.; Climent, M. D. Analysis of Organic Compounds in Air: A Review. Crit. Rev. Anal. Chem. 2000, 30, 121–151. DOI: 10.1080/10408340091164207.
- Jochmann, M. A.; Laaks, J.; Schmidt, T. C. Solvent-Free Extraction and Injection Techniques. In Practical Gas Chromatography; Dettmer-Wilde, K., Engewald, W., Eds.; Springer: Berlin, Heidelberg, 2014; pp 371–412.
- Woolfenden, E.; Thermal Desorption Gas Chromatography. In Gas Chromatography; Elsevier Inc., 2021; pp 267–323. DOI: 10.1016/B978-0-12-820675-1.00009-5.
- Kolb, B. Headspace Sampling with Capillary Columns. J. Chromatogr. A 1999, 842, 163–205. DOI: 10.1016/S0021-9673(99)00073-4.
- Bartsch, J.; Uhde, E.; Salthammer, T. Analysis of Odour Compounds from Scented Consumer Products Using Gas Chromatography-Mass Spectrometry and Gas Chromatography-Olfactometry. Anal. Chim. Acta 2016, 904, 98–106. DOI: 10.1016/j.aca.2015.11.031.
- Mametov, R.; Ratiu, I.-A.; Monedeiro, F.; Ligor, T.; Buszewski, B. Evolution and Evaluation of GC Columns. Crit. Rev. Anal. Chem. 2021, 51, 150–173. DOI: 10.1080/10408347.2019.1699013.
- Beauchamp, J.; Zardin, E. Odorant Detection by On-Line Chemical Ionization Mass Spectrometry. In Springer Handbook of Odor; Buettner, A., Ed.; Springer International Publishing: Cham, 2017; pp 49–50. DOI: 10.1007/978-3-319-26932-0_18.
- Taylor, A. J.; Beauchamp, J. D.; Vaughan, S. L. Non-Destructive and High-Throughput—APCI-MS, PTR-MS and SIFT-MS as Methods of Choice for Exploring Flavor Release. In Dynamic Flavor: Capturing Aroma Using Real-Time Mass Spectrometry; Beauchamp, J. D., Ed.; American Chemical Society, 2021; pp 1–16.
- Dodds, J. N.; Baker, E. S. Ion Mobility Spectrometry: Fundamental Concepts, Instrumentation, Applications, and the Road Ahead. J. Am. Soc. Mass Spectrom. 2019, 30, 2185–2195. DOI: 10.1007/s13361-019-02288-2.
- Armenta, S.; Alcala, M.; Blanco, M. A Review of Recent, Unconventional Applications of Ion Mobility Spectrometry (IMS). Anal. Chim. Acta 2011, 703, 114–123. DOI: 10.1016/j.aca.2011.07.021.
- Hernández-Mesa, M.; Ropartz, D.; García-Campaña, A. M.; Rogniaux, H.; Dervilly-Pinel, G.; le Bizec, B. Ion Mobility Spectrometry in Food Analysis: Principles, Current Applications and Future Trends. Molecules 2019, 24, 2706. DOI: 10.3390/molecules24152706.
- Puton, J.; Namieśnik, J. Ion Mobility Spectrometry: Current Status and Application for Chemical Warfare Agents Detection. TrAC, Trends Anal. Chem. 2016, 85, 10–20. DOI: 10.1016/j.trac.2016.06.002.
- Westhoff, M.; Litterst, P.; Freitag, L.; Urfer, W.; Bader, S.; Baumbach, J.-I. Ion Mobility Spectrometry for the Detection of Volatile Organic Compounds in Exhaled Breath of Patients with Lung Cancer: Results of a Pilot Study. Thorax 2009, 64, 744–748. DOI: 10.1136/thx.2008.099465.
- Gerhardt, N.; Birkenmeier, M.; Sanders, D.; Rohn, S.; Weller, P. Resolution-Optimized Headspace Gas Chromatography-Ion Mobility Spectrometry (HS-GC-IMS) for Non-Targeted Olive Oil Profiling. Anal. Bioanal. Chem. 2017, 409, 3933–3942. DOI: 10.1007/s00216-017-0338-2.
- Gloess, A. N.; Yeretzian, C.; Knochenmuss, R.; Groessl, M. On-Line Analysis of Coffee Roasting with Ion Mobility Spectrometry–Mass Spectrometry (IMS–MS). Int. J. Mass Spectrom. 2018, 424, 49–57. DOI: 10.1016/j.ijms.2017.11.017.
- Oleneva, E.; Kuchmenko, T.; Drozdova, E.; Legin, A.; Kirsanov, D. Identification of Plastic Toys Contaminated with Volatile Organic Compounds Using QCM Gas Sensor Array. Talanta 2020, 211, 120701. DOI: 10.1016/j.talanta.2019.120701.
- Kuchmenko, T.; Umarkhanov, R.; Lvova, L. E-Nose for the Monitoring of Plastics Catalytic Degradation through the Released Volatile Organic Compounds (VOCs) Detection. Sens. Actuators B Chem. 2020, 322, 128585. DOI: 10.1016/j.snb.2020.128585.
- Cumeras, R.; Figueras, E.; Davis, C. E.; Baumbach, J. I.; Gràcia, I. Review on Ion Mobility Spectrometry. Part 1: Current Instrumentation. Analyst 2015, 140, 1376–1390. DOI: 10.1039/C4AN01100G.
- Majchrzak, T.; Wojnowski, W.; Lubinska-Szczygeł, M.; Różańska, A.; Namieśnik, J.; Dymerski, T. PTR-MS and GC-MS as Complementary Techniques for Analysis of Volatiles: A Tutorial Review. Anal. Chim. Acta 2018, 1035, 1–13. DOI: 10.1016/j.aca.2018.06.056.
- Biasioli, F.; Gasperi, F.; Yeretzian, C.; Märk, T. D. PTR-MS Monitoring of VOCs and BVOCs in Food Science and Technology. TrAC, Trends Anal. Chem. 2011, 30, 968–977. DOI: 10.1016/j.trac.2011.03.009.
- Pathak, A. K.; Viphavakit, C. A Review on All-Optical Fiber-Based VOC Sensors: Heading towards the Development of Promising Technology. Sens. Actuators A Phys. 2022, 338, 113455. DOI: 10.1016/j.sna.2022.113455.
- Spinelle, L.; Gerboles, M.; Kok, G.; Persijn, S.; Sauerwald, T. Review of Portable and Low-Cost Sensors for the Ambient Air Monitoring of Benzene and Other Volatile Organic Compounds. Sensors 2017, 17, 1520. DOI: 10.3390/s17071520.
- Wilson, A. D. Review of Electronic-Nose Technologies and Algorithms to Detect Hazardous Chemicals in the Environment. Proc. Technol. 2012, 1, 453–463. DOI: 10.1016/j.protcy.2012.02.101.
- Schütze, A.; Sauerwald, T. Indoor Air Quality Monitoring. In Advanced Nanomaterials for Inexpensive Gas Microsensors. Synthesis, Integration and Applications; Llobet, E., Ed.; Elsevier, 2020; pp 209–234. DOI: 10.1016/B978-0-12-814827-3.00011-6.
- Schütze, A.; Baur, T.; Leidinger, M.; Reimringer, W.; Jung, R.; Conrad, T.; Sauerwald, T. Highly Sensitive and Selective VOC Sensor Systems Based on Semiconductor Gas Sensors: How To? Environments 2017, 4, 20. DOI: 10.3390/environments4010020.
- Dettmer-Wilde, K., Engewald, W., Eds.; Practical Gas Chromatography; Springer: Berlin, Heidelberg, 2014. DOI: 10.1007/978-3-642-54640-2.
- Koning, S.; Janssen, H.-G.; Brinkman, U. A. T. Modern Methods of Sample Preparation for GC Analysis. Chroma 2009, 69, 33–78. DOI: 10.1365/s10337-008-0937-3.
- Kloskowski, A.; Chrzanowski, W.; Pilarczyk, M.; Namiesnik, J. Modern Techniques of Sample Preparation for Determination of Organic Analytes by Gas Chromatography. Crit. Rev. Anal. Chem. 2007, 37, 15–38. DOI: 10.1080/10408340600976663.
- Sajid, M.; Khaled Nazal, M.; Rutkowska, M.; Szczepańska, N.; Namieśnik, J.; Płotka-Wasylka, J. Solid Phase Microextraction: Apparatus, Sorbent Materials, and Application. Crit. Rev. Anal. Chem. 2019, 49, 271–288. DOI: 10.1080/10408347.2018.1517035.
- Danish Environmental Protection Agency. Survey, Emission and Evaluation of Volatile Organic Chemicals in Printed Matter. Survey of Chemical Compounds in Consumer Products, No. 36. 2003.
- Zhang, Z.; Pawliszyn, J. Headspace Solid-Phase Microextraction. Anal. Chem. 1993, 65, 1843–1852. DOI: 10.1021/ac00062a008.
- Dodson, R. E.; Bessonneau, V.; Udesky, J. O.; Nishioka, M.; McCauley, M.; Rudel, R. A. Passive Indoor Air Sampling for Consumer Product Chemicals: A Field Evaluation Study. J. Expo. Sci. Environ. Epidemiol. 2019, 29, 95–108. DOI: 10.1038/s41370-018-0070-9.
- Bartkow, M. E.; Booij, K.; Kennedy, K. E.; Müller, J. F.; Hawker, D. W. Passive Air Sampling Theory for Semivolatile Organic Compounds. Chemosphere 2005, 60, 170–176. DOI: 10.1016/j.chemosphere.2004.12.033.
- Partyka, M.; Zabiegała, B.; Namiésnik, J.; Przyjazny, A. Application of Passive Samplers in Monitoring of Organic Constituents of Air. Crit. Rev. Anal. Chem. 2007, 37, 51–78. DOI: 10.1080/10408340600976523.
- Nematollahi, N.; Doronila, A.; Mornane, P. J.; Duan, A.; Kolev, S. D.; Steinemann, A. Volatile Chemical Emissions from Fragranced Baby Products. Air Qual. Atmos. Health 2018, 11, 785–790. DOI: 10.1007/s11869-018-0593-1.
- Wojtyła, S.; Klama, P.; Śpiewak, K.; Baran, T. 3D Printer as a Potential Source of Indoor Air Pollution. Int. J. Environ. Sci. Technol. 2020, 17, 207–218. DOI: 10.1007/s13762-019-02444-x.
- Snow, N. H.; Slack, G. C. Head-Space Analysis in Modern Gas Chromatography. TrAC, Trends Anal. Chem. 2002, 21, 608–617. DOI: 10.1016/S0165-9936(02)00802-6.
- Kremser, A.; Jochmann, M. A.; Schmidt, T. C. Systematic Comparison of Static and Dynamic Headspace Sampling Techniques for Gas Chromatography. Anal. Bioanal. Chem. 2016, 408, 6567–6579. DOI: 10.1007/s00216-016-9843-y.
- Liberto, E.; Bicchi, C.; Cagliero, C.; Cordero, C.; Rubiolo, P.; Sgorbini, B. Headspace Sampling: An “Evergreen” Method in Constant Evolution to Characterize Food Flavors through Their Volatile Fraction. In Food Chemistry, Function and Analysis. Advanced Gas Chromatography in Food Analysis; Tranchida, P. Q., Ed.; The Royal Society of Chemistry, 2019; pp 3–37.
- Soria, A. C.; García-Sarrió, M. J.; Sanz, M. L. Volatile Sampling by Headspace Techniques. TrAC, Trends Anal. Chem. 2015, 71, 85–99. DOI: 10.1016/j.trac.2015.04.015.
- Lancioni, C.; Castells, C.; Candal, R.; Tascon, M. Headspace Solid-Phase Microextraction: Fundamentals and Recent Advances. Adv. Sample Prepar. 2022, 3, 100035. DOI: 10.1016/j.sampre.2022.100035.
- Ai, J. Headspace Solid Phase Microextraction. Dynamics and Quantitative Analysis before Reaching a Partition Equilibrium. Anal. Chem. 1997, 69, 3260–3266. DOI: 10.1021/ac970024x.
- Danish Environmental Protection Agency. Survey of Allergenic Substances in Products Targeted Children – Toys and Cosmetic Products. Survey of Chemical Substances in Consumer Products, No. 148. 2016.
- Lattuati-Derieux, A.; Bonnassies-Termes, S.; Lavédrine, B. Identification of Volatile Organic Compounds Emitted by a Naturally Aged Book Using Solid-Phase Microextraction/Gas Chromatography/Mass Spectrometry. J. Chromatogr. A 2004, 1026, 9–18. DOI: 10.1016/j.chroma.2003.11.069.
- Lattuati-Derieux, A.; Egasse, C.; Thao-Heu, S.; Balcar, N.; Barabant, G.; Lavédrine, B. What Do Plastics Emit? HS-SPME-GC/MS Analyses of New Standard Plastics and Plastic Objects in Museum Collections. J. Cult. Herit. 2013, 14, 238–247. DOI: 10.1016/j.culher.2012.06.005.
- Curran, K.; Underhill, M.; Gibson, L. T.; Strlic, M. The Development of a SPME-GC/MS Method for the Analysis of VOC Emissions from Historic Plastic and Rubber Materials. Microchem. J. 2016, 124, 909–918. DOI: 10.1016/j.microc.2015.08.027.
- Cavalli, J.-F.; Fernandez, X.; Lizzani-Cuvelier, L.; Loiseau, A.-M. Comparison of Static Headspace, Headspace Solid Phase Microextraction, Headspace Sorptive Extraction, and Direct Thermal Desorption Techniques on Chemical Composition of French Olive Oils. J. Agric. Food Chem. 2003, 51, 7709–7716. DOI: 10.1021/jf034834n.
- Flórez Menéndez, J. C.; Fernández Sánchez, M. L.; Sánchez Urı́a, J. E.; Fernández Martı́nez, E.; Sanz-Medel, A. Static Headspace, Solid-Phase Microextraction and Headspace Solid-Phase Microextraction for BTEX Determination in Aqueous Samples by Gas Chromatography. Anal. Chim. Acta 2000, 415, 9–20. DOI: 10.1016/S0003-2670(00)00862-X.
- Wojnowski, W.; Majchrzak, T.; Dymerski, T.; Gębicki, J.; Namieśnik, J. Dynamic Headspace Sampling as an Initial Step for Sample Preparation in Chromatographic Analysis. J. AOAC. Int. 2017, 100, 1599–1606. DOI: 10.5740/jaoacint.17-0206.
- Elmore, J. S.; Erbahadir, M. A.; Mottram, D. S. Comparison of Dynamic Headspace Concentration on Tenax with Solid Phase Microextraction for the Analysis of Aroma Volatiles. J. Agric. Food Chem. 1997, 45, 2638–2641. DOI: 10.1021/jf960835m.
- Salthammer, T., Uhde, E., Eds.; Organic Indoor Air Pollutants, 2nd ed.; Wiley-VCH: Weinheim, 2009.
- Nie, Y.; Lerch, O.; Kleine-Benne, E. Determination of Formaldehyde and VOCs in Wood-Based Products Using an Automated Micro-Scale Chamber. GERSTEL Appl. Note 2017, 1–12.
- Norwegian Institute for Air Research. Survey of Emissions of Volatile Organic Chemicals from Handheld Toys for Children above 3 Years. NILU Report 12/2020. In Bohlin-Nizzetto, P., Schmidbauer, N., Eds.; Norwegian Environment Agency, 2020.
- Danish Environmental Protection Agency. Odour from Energy-Saving Light Bulbs. Survey of Chemical Substances in Consumer Products No. 140; 2015.
- European Committee for Standardization. Interior Air of Road Vehicles - Part 2: Screening Method for the Determination of the Emissions of Volatile Organic Compounds from Vehicle Interior Parts and Materials - Bag Method (ISO 12219-2:2012); 2012.
- Beauchamp, J.; Herbig, J.; Gutmann, R.; Hansel, A. On the Use of Tedlar® Bags for Breath-Gas Sampling and Analysis. J. Breath Res. 2008, 2, 046001. DOI: 10.1088/1752-7155/2/4/046001.
- European Committee for Standardization. Indoor Air - Part 9: Determination of the Emission of Volatile Organic Compounds from Building Products and Furnishing - Emission Test Chamber Method (ISO 16000-9:2006); 2006.
- Salthammer, T. Environmental Test Chambers and Cells. In Organic Indoor Air Pollutants; Uhde, E., Salthammer, T., Eds.; Wiley-VCH: Weinheim, 2009.
- Uhde, E.; Salthammer, T. Influence of Molecular Parameters on the Sink Effect in Test Chambers. Indoor Air 2006, 16, 158–165. DOI: 10.1111/j.1600-0668.2005.00412.x.
- Zhao, D.; Little, J. C.; Hodgson, A. T. Modeling the Reversible, Diffusive Sink Effect in Response to Transient Contaminant Sources. Indoor Air 2002, 12, 184–190. DOI: 10.1034/j.1600-0668.2002.01116.x.
- Wei, W.; Zhang, Y.; Xiong, J.; Li, M. A Standard Reference for Chamber Testing of Material VOC Emissions: Design Principle and Performance. Atmos. Environ. 2012, 47, 381–388. DOI: 10.1016/j.atmosenv.2011.10.051.
- Wei W.; Xiong J.; Zhao W.; Zhang Y. A Framework and Experimental Study of an Improved VOC/Formaldehyde Emission Reference for Environmental Chamber Tests. Atmos. Environ. 2014, 82, 327–334. DOI: 10.1016/j.atmosenv.2013.10.038.
- Nohr, M.; Horn, W.; Wiegner, K.; Richter, M.; Lorenz, W. Development of a Material with Reproducible Emission of Selected Volatile Organic Compounds – μ-Chamber Study. Chemosphere 2014, 107, 224–229. DOI: 10.1016/j.chemosphere.2013.12.047.
- Nohr, M.; Horn, W.; Jann, O.; Richter, M.; Lorenz, W. Development of a Multi-VOC Reference Material for Quaity Assurance in Material Emission Testing. Anal. Bioanal. Chem. 2015, 407, 3231–3237. DOI: 10.1007/s00216-014-8387-2.
- Richter, M.; Mull, B.; Horn, W.; Brödner, D.; Mölders, N.; Renner, M. Reproducibly Emitting Reference Material on Thermoplastic Polyurethane Basis for Quality Assurance/Quality Control of Emission Test Chamber Measurements. Build. Eviron. 2017, 122, 203–236.
- Danish Environmental Protection Agency. Analysis and Risk Assessment of Fragrances and Other Organic Substances in Squishy Toys. Survey of Chemical Substances in Consumer Products, No. 165; 2018.
- Derudi, M.; Gelosa, S.; Sliepcevich, A.; Cattaneo, A.; Rota, R.; Cavallo, D.; Nano, G. Emissions of Air Pollutants from Scented Candles Burning in a Test Chamber. Atmos. Environ. 2012, 55, 257–262. DOI: 10.1016/j.atmosenv.2012.03.027.
- Azimi, P.; Zhao, D.; Pouzet, C.; Crain, N. E.; Stephens, B. Emissions of Ultrafine Particles and Volatile Organic Compounds from Commercially Available Desktop Three-Dimensional Printers with Multiple Filaments. Environ. Sci. Technol. 2016, 50, 1260–1268. DOI: 10.1021/acs.est.5b04983.
- Wojtyła, S.; Klama, P.; Baran, T. Is 3D Printing Safe? Analysis of the Thermal Treatment of Thermoplastics: ABS, PLA, PET, and Nylon. J. Occup. Environ. Hyg. 2017, 14, D80–D85. DOI: 10.1080/15459624.2017.1285489.
- Yi, J.; Duling, M. G.; Bowers, L. N.; Knepp, A. K.; LeBouf, R. F.; Nurkiewicz, T. R.; Ranpara, A.; Luxton, T.; Martin, S. B.; Burns, D. A.; et al. Particle and Organic Vapor Emissions from Children ’ s 3-D Pen and 3-D Printer Toys. Inhal. Toxicol. 2019, 31, 432–445. DOI: 10.1080/08958378.2019.1705441.
- Gunnarsen, L.; Nielsen, P. A.; Wolkoff, P. Design and Characterization of the CLIMPAQ, Chamber for Laboratory Investigations of Materials, Pollution and Air Quality. Indoor Air 1994, 4, 56–62. DOI: 10.1111/j.1600-0668.1994.t01-3-00007.x.
- Climtech. Test Chambers https://climtech.dk/products.html (accessed Apr 24, 2021).
- NORDTEST. Building Materials: Emissions Testing Using the CLIMPAQ. NT Build 482; 1998.
- Fang, L.; Clausen, G.; Fanger, P. O. Impact of Temperature and Humidity on Chemical and Sensory Emissions from Building Materials. Indoor Air 1999, 9, 193–201. DOI: 10.1111/j.1600-0668.1999.t01-1-00006.x.
- Knudsen, H. N.; Kjaer, U. D.; Nielsen, P. A.; Wolkoff, P. Sensory and Chemical Characterization of VOC Emissions from Building Products: Impact of Concentration and Air Velocity. Atmos. Environ. 1999, 33, 1217–1230. DOI: 10.1016/S1352-2310(98)00278-7.
- Afshari, A.; Lundgren, B.; Ekberg, L. E. Comparison of Three Small Chamber Test Methods for the Measurement of VOC Emission Rates from Paint. Indoor Air 2003, 13, 156–165. DOI: 10.1034/j.1600-0668.2003.00146.x.
- Markes International Ltd. Micro-Chamber/Thermal Extractor https://markes.com/shop/products/micro-chamberthermal-extractor (accessed Aug 19, 2022).
- Schripp, T.; Nachtwey, B.; Toelke, J.; Salthammer, T.; Uhde, E.; Wensing, M.; Bahadir, M. A Microscale Device for Measuring Emissions from Materials for Indoor Use. Anal. Bioanal. Chem. 2007, 387, 1907–1919. DOI: 10.1007/s00216-006-1057-2.
- European Committee for Standardization. Indoor Air- Part 25: Determination of the Emission of Semi-Volatile Organic Compounds by Building Products - Micro-Chamber Method (ISO 16000-25:2011); 2011.
- Marć, M.; Zabiegała, B. An Investigation of Selected Monoaromatic Hydrocarbons Released from the Surface of Polystyrene Lids Used in Coffee-to-Go Cups. Microchem. J. 2017, 133, 496–505. DOI: 10.1016/j.microc.2017.04.015.
- Wolkoff, P.; Clausen, P. A.; Nielsen, P. A.; Gustafsson, H.; Jonsson, B.; Rasmusen, E. Field and Laboratory Emission Cell: FLEC. In IAQ ’91 Healthy Buildings; American Society of Heating, Refrigerating and Air Conditioning Engineers, Inc, 1991; pp 160–165.
- Uhde, E.; Borgschulte, A.; Salthammer, T. Characterization of the Field and Laboratory Emission Cell - FLEC: Flow Field and Air Velocities. Atmos. Environ. 1998, 32, 773–781. DOI: 10.1016/S1352-2310(97)00345-2.
- Clausen, P. A.; Liu, Z.; Xu, Y.; Kofoed-Sørensen, V.; Little, J. C. Influence of Air Flow Rate on Emission of DEHP from Vinyl Flooring in the Emission Cell FLEC: Measurements and CFD Simulation. Atmos. Environ. 2010, 44, 2760–2766. DOI: 10.1016/j.atmosenv.2010.04.020.
- Wolkoff, P. Impact of Air Velocity, Temperature, Humidity, and Air on Long-Term VOC Emissions from Building Products. Atmos. Environ. 1998, 32, 2659–2668. DOI: 10.1016/S1352-2310(97)00402-0.
- Kim, S.; Kim, J. A.; An, J. Y.; Kim, H. J.; Kim, S. D.; Park, J. C. TVOC and Formaldehyde Emission Behaviors from Flooring Materials Bonded with Environmental-Friendly MF/PVAc Hybrid Resins. Indoor Air 2007, 17, 404–415. DOI: 10.1111/j.1600-0668.2007.00488.x.
- Marć, M.; Namieśnik, J.; Zabiegała, B. The Home-Made in Situ Passive Flux Sampler for the Measurement of Monoterpene Emission Flux: Preliminary Studies. Anal. Bioanal. Chem. 2015, 407, 6879–6884. DOI: 10.1007/s00216-015-8859-z.
- Plaisance, H.; Blondel, A.; Desauziers, V.; Mocho, P. Characteristics of Formaldehyde Emissions from Indoor Materials Assessed by a Method Using Passive Flux Sampler Measurements. Build. Environ. 2014, 73, 249–255. DOI: 10.1016/j.buildenv.2013.12.011.
- Bicchi, C.; Cordero, C.; Liberto, E.; Rubiolo, P.; Sgorbini, B.; Sandra, P. Sorptive Tape Extraction in the Analysis of the Volatile Fraction Emitted from Biological Solid Matrices. J. Chromatogr. A 2007, 1148, 137–144. DOI: 10.1016/j.chroma.2007.03.007.
- Barba, C.; Thomas-Danguin, T.; Guichard, E. Comparison of Stir Bar Sorptive Extraction in the Liquid and Vapour Phases, Solvent-Assisted Flavour Evaporation and Headspace Solid-Phase Microextraction for the (Non)-Targeted Analysis of Volatiles in Fruit Juice. LWT - Food Sci. Technol. 2017, 85, 334–344. DOI: 10.1016/j.lwt.2016.09.015.
- Bicchi, C.; Iori, C.; Rubiolo, P.; Sandra, P. Headspace Sorptive Extraction (HSSE), Stir Bar Sorptive Extraction (SBSE), and Solid Phase Microextraction (SPME) Applied to the Analysis of Roasted Arabica Coffee and Coffee Brew. J. Agric. Food Chem. 2002, 50, 449–459. DOI: 10.1021/jf010877x.
- Cheng, Z.; Mannion, D. T.; O’Sullivan, M. G.; Miao, S.; Kerry, J. P.; Kilcawley, K. N. Comparison of Automated Extraction Techniques for Volatile Analysis of Whole Milk Powder. Foods 2021, 10, 2061. DOI: 10.3390/foods10092061.
- Bicchi, C.; Cordero, C.; Iori, C.; Rubiolo, P.; Sandra, P. Headspace Sorptive Extraction (HSSE) in the Headspace Analysis of Aromatic and Medicinal Plants. J. High Resol. Chromatogr. 2000, 23, 539–546. DOI: 10.1002/1521-4168(20000901)23:9 < 539::AID-JHRC539 > 3.0.CO;2-3.
- Maruti, A.; Durán-Guerrero, E.; Barroso, C. G.; Castro, R. Optimization of a Multiple Headspace Sorptive Extraction Method Coupled to Gas Chromatography-Mass Spectrometry for the Determination of Volatile Compounds in Macroalgae. J. Chromatogr. A 2018, 1551, 41–51. DOI: 10.1016/j.chroma.2018.04.011.
- Hearn, L.; Cole, R.; Spadafora, N. D.; Szafnauer, R. Volatile and Semi-Volatile Compounds in Flavoured Hard Seltzer Beverages: Comparison of High-Capacity Sorptive Extraction (HiSorb) Methods. Adv. Sample Prepar. 2022, 3, 100032. DOI: 10.1016/j.sampre.2022.100032.
- Tienpont, B.; David, F.; Bicchi, C.; Sandra, P. High Capacity Headspace Sorptive Extraction. J. Micro. Sep. 2000, 12, 577–584. DOI: 10.1002/1520-667X(2000)12:11 < 577::AID-MCS30 > 3.0.CO;2-Q.
- Prieto, A.; Basauri, O.; Rodil, R.; Usobiaga, A.; Fernández, L. A.; Etxebarria, N.; Zuloaga, O. Stir-Bar Sorptive Extraction: A View on Method Optimisation, Novel Applications, Limitations and Potential Solutions. J. Chromatogr. A 2010, 1217, 2642–2666. DOI: 10.1016/j.chroma.2009.12.051.
- Baltussen, E.; Sandra, P.; David, F.; Cramers, C. Stir Bar Sorptive Extraction (SBSE), a Novel Extraction Technique for Aqueous Samples: Theory and Principles. J. Micro. Sep. 1999, 11, 737–747. DOI: 10.1002/(SICI)1520-667X(1999)11:10 < 737::AID-MCS7 > 3.0.CO;2-4.
- Sgorbini, B.; Cagliero, C.; Cordero, C.; Liberto, E.; Rubiolo, P.; Ruosi, M. R.; Bicchi, C. New Medium-to-High Polarity Twister Coatings for Liquid and Vapour Phase Sorptive Extraction of Matrices of Vegetable Origin. J. Chromatogr. A 2012, 1265, 39–45. DOI: 10.1016/j.chroma.2012.09.097.
- Boggia, L.; Sgorbini, B.; Bertea, C. M.; Cagliero, C.; Bicchi, C.; Maffei, M. E.; Rubiolo, P. Direct Contact – Sorptive Tape Extraction Coupled with Gas Chromatography – Mass Spectrometry to Reveal Volatile Topographical Dynamics of Lima Bean (Phaseolus Lunatus L.) upon Herbivory by Spodoptera Littoralis Boisd. BMC Plant Biol. 2015, 15, 102. DOI: 10.1186/s12870-015-0487-4.
- Sandra, P.; Lebel, M.; Sisalli, S.; Isabelle, L. F.; Adao, A. Sorptive Tape Extraction - A Novel Sampling Method for the in Vivo Study of Skin. LCGC Europe 2006, 19, 33–39.
- Noguchi, M.; Yamasaki, A. Passive Flux Sampler Measurements of Emission Rates of Phthalates from Poly(Vinyl Chloride) Sheets. Build. Environ. 2016, 100, 197–202. DOI: 10.1016/j.buildenv.2016.02.019.
- Marć, M.; Zabiegała, B.; Namieśnik, J. Miniaturized Passive Emission Chambers for In Situ Measurement of Emissions of Volatile Organic Compounds. Crit. Rev. Anal. Chem. 2013, 43, 55–61. DOI: 10.1080/10408347.2012.744888.
- Marć, M.; Namieśnik, J.; Zabiegała, B. The Miniaturised Emission Chamber System and Home-Made Passive Flux Sampler Studies of Monoaromatic Hydrocarbons Emissions from Selected Commercially-Available Floor Coverings. Build. Environ. 2017, 123, 1–13. DOI: 10.1016/j.buildenv.2017.06.035.
- Yamashita, S.; Kume, K.; Horiike, T.; Honma, N.; Fusaya, M.; Ohura, T.; Amagai, T. A Simple Method for Screening Emission Sources of Carbonyl Compounds in Indoor Air. J. Hazard Mater. 2010, 178, 370–376. DOI: 10.1016/j.jhazmat.2010.01.089.
- Ni, Y.; Kumagai, K.; Yanagisawa, Y. Measuring Emissions of Organophosphate Flame Retardants Using a Passive Flux Sampler. Atmos. Environ. 2007, 41, 3235–3240. DOI: 10.1016/j.atmosenv.2006.10.080.
- Kimura, K.; Sekine, Y.; Furukawa, S.; Takahashi, M.; Oikawa, D. Measurement of 2-Nonenal and Diacetyl Emanating from Human Skin Surface Employing Passive Flux Sampler—GCMS System. J. Chromatogr. B Analyt. Technol. Biomed. Life Sci. 2016, 1028, 181–185. DOI: 10.1016/j.jchromb.2016.06.021.
- Sekine, Y.; Toyooka, S.; Watts, S. F. Determination of Acetaldehyde and Acetone Emanating from Human Skin Using a Passive Flux Sampler—HPLC System. J. Chromatogr. B Analyt. Technol. Biomed. Life Sci. 2007, 859, 201–207. DOI: 10.1016/j.jchromb.2007.09.033.
- Noguchi, M.; Yamasaki, A. Volatile and Semivolatile Organic Compound Emissions from Polymers Used in Commercial Products during Thermal Degradation. Heliyon 2020, 6, e03314. DOI: 10.1016/j.heliyon.2020.e03314.
- U.S. Environmental Protection Agency. Comptox Chemicals Dashboard. Toluene https://comptox.epa.gov/dashboard/chemical/properties/DTXSID7021360 (accessed Aug 19, 2022).
- Lugg, G. A. Diffusion Coefficients of Some Organic and Other Vapors in Air. Anal. Chem. 1968, 40, 1072–1077. DOI: 10.1021/ac60263a006.
- International Labour Organization and World Health Organization. International Chemical Safety Cards. Phenol https://www.ilo.org/dyn/icsc/showcard.display?p_lang=en&p_card_id=0070&p_version=2 (accessed Aug 19, 2022).
- U.S. Environmental Protection Agency. Comptox Chemicals Dashboard. 1,2,4-Trimethylbenzene https://comptox.epa.gov/dashboard/chemical/properties/DTXSID6021402 (accessed Aug 19, 2022).
- U.S. Environmental Protection Agency. Comptox Chemicals Dashboard. n-Butanol https://comptox.epa.gov/dashboard/chemical/properties/DTXSID1021740 (accessed Aug 19, 2022).