Abstract
Advances in inductively coupled plasma mass spectrometry and the methods used to prepare isotopically enriched standards, allow for the high accuracy measurement of metalloproteins by isotope dilution mass spectrometry. This technique has now reached a level of maturity whereby a step change in the accuracy, precision, and traceability of, in particular, clinical, and biomedical measurements is achievable. Current clinical measurements, which require low limits of detection in the presence of complex sample matrices, use indirect methods based on immunochemistry for the study of human disease. However, this approach suffers from poor traceability, requiring comparisons based on provision of matrix-based reference materials, used as analytical standards. This leads to difficulty when changes in the reference material are required, often resulting in a lack of interlaboratory and temporal comparability in clinical results and reference ranges. In this review, we focus on the most important metalloproteins for clinical studies, to illustrate how the attributes of chromatography coupled to inorganic mass spectrometry can be used for the direct measurement of metalloproteins such as hemoglobin, transferrin, and ceruloplasmin. By using this approach, we hope to demonstrate how isotope dilution analysis can be used as a reference method to improve traceability and underpin clinical, biomedical, and other biological measurements.
Introduction part 1: metalloproteins
Metals are essential to life, with over a third of the known human proteome associated with a metal co-factor,[Citation1] which are classified as metalloproteins. A systematic review of enzyme structural databases showed that metalloenzymes are found in all six Enzyme Commission classes, including: hydrolases; isomerases; ligases; lyases; oxidoreductases; transferases; and lyases,[Citation2] with some estimates suggesting that up to 50% of all proteins may have metal binding affinity. Therefore, the significance of metalloproteins in biological systems, biomedical science and human health cannot be underestimated. In the case of zinc, about 10% of the proteome is thought to contain in vivo Zn binding affinity, with functions ranging from redox regulation, DNA synthesis (Zn-finger proteins) and intracellular signaling, to possible contributions to the progression of Alzheimer’s disease.[Citation3] Many oxidase and oxygenase enzymes are copper or iron metalloproteins,[Citation4] and the iron-containing metalloprotein Hb is the principle oxygen carrier in humans. Magnesium, the most common metal in metalloenzymes, is sometimes interchangeable with manganese, and hence the quantity of Mn metalloenzymes in vivo may be overestimated,[Citation5] though Mn is a notable co-factor in manganese superoxide dismutase (Mn-SOD).[Citation6] Proteins with the metalloid containing amino acid selenocysteine, are often found in oxidoreductase enzymes.[Citation7]
To avoid displacement or loss of metal cofactors, metalloproteins must be studied under non-denaturing and often physiological conditions,[Citation5] limiting the number of available analytical preparation and measurement techniques that can be used. Clinical measurements require a high degree of traceability, meaning that they “can be related to stated references through an unbroken chain of comparisons all having stated uncertainties.”[Citation8] Traditional biochemical techniques and also the newer tagging methods,[Citation9] which are based on immunochemistry, often suffer from a limited linear range, a lack of traceability, or phenomena such as the Hook effect, whereby falsely low results are caused by the presence of excess antigen compared to antibody. Such factors can alter reference ranges when the calibration materials are changed and highlights the requirement for new approaches to standardization, which can be facilitated by the use of traceable inorganic standards. In this approach, after separation from the sample matrix and other proteins using liquid chromatography, metalloproteins can be quantified using elemental mass spectrometry.
Introduction part 2: isotope dilution mass spectrometry
Analytical measurements using calibration procedures based on IDMS offer the possibility of high accuracy results, with low values of measurement uncertainty and clear traceability to the SI unit for amount of substance, the mole.[Citation10,Citation11] The basic principle of IDMS is the addition of an isotopic internal standard to the sample, which changes the natural isotopic composition of the analyte under investigation. By measurement of the isotope ratio of the sample and the spike isotopes using mass spectrometry, the concentration of the analyte can be determined. In practice[Citation12] a sample with a known isotopic composition of analyte, but unknown analyte concentration, is mixed with a known amount of internal standard, with known isotopic enrichment, termed the spike. The spike contains the analyte being measured, but with a different isotopic composition, ideally the least abundant isotope is enriched compared to how the element is present in nature. Complete mixing of the sample and the spike, such that the two isotopes being measured reach equilibrium, produces a sample blend. The isotope ratio of the sample and spike isotopes in the blend then directly reflects the analyte concentration in the sample.
If carried out correctly, a significant advantage of IDMS is that any loss of sample blend will not affect the isotopic ratios being measured and so will not affect the accuracy of the result. In conventional calibration approaches a loss of the analyte would result in an under recovery and a low result. However, in a similar way to conventional ICP-MS measurements, accurate calibration in IDMS requires both isotopes being measured to be interference free, either through judicial use of the parameters for the ICP-MS collision/reaction cell or higher resolution ICP-MS to remove the interference, or by choice of two interference free isotopes. The equations used for the calculation of the concentration of the unknown analyte are well established[Citation10] and relate the analyte concentration to the known or measured abundances of the 2 isotopes, their measured isotopic ratio in the blend and the mass of sample and spike used.
In practice, there have been four approaches used for such calibration: single IDMS; double IDMS; triple IDMS; and exact matching IDMS,[Citation10,Citation11] each offering different degrees of complexity and levels of measurement uncertainty. Briefly, in single IDMS the spike material used to produce the sample blend has already been characterized in terms of concentration and isotopic abundance, so can effectively be used as an internal standard without further analysis. In double IDMS the spike material needs to be characterized using reverse IDMS, whereby a well-characterized analyte standard (this is termed the back-spike) with natural isotopic abundance and known concentration is added to the spike and the isotope ratio determined. Once characterized in terms of concentration the spike can be used to determine the concentration in a similar way to single IDMS. Triple IDMS[Citation13] has been developed to deliver the highest metrological requirements and to overcome problems related to contamination of the instrument by highly enriched spike materials and elements with significant memory effects. To do this, a third isotopic blend containing the spike and the back-spike but in a different ratio compared to the blend required for double IDMS, is used. Despite the higher workload required in triple IDMS, it has the advantage that the isotope ratio of the spike does not need to be determined and this approach provides the lowest relative expanded uncertainty of all the IDMS methods.[Citation13] The exact matching calibration approach was initially developed to reduce systematic errors in the measurement of organic compounds[Citation14] and was then adapted for use with inorganic species. It is a form of double IDMS which involves matching the isotope ratio of the sample-spike and back spike-spike blends and their signal intensities, by sequentially adjusting their composition. As such it overcomes some of the uncertainties involved in the measurement, such as for detector dead-time, but it can be time consuming to perform. For this reason the “approximate matching” approach was developed[Citation12,Citation15] whereby the same improvements are made but the agreement between the different blends is set to be acceptable at ±5%. All of these spiking methods can be employed for the measurement of metalloproteins, as discussed below.
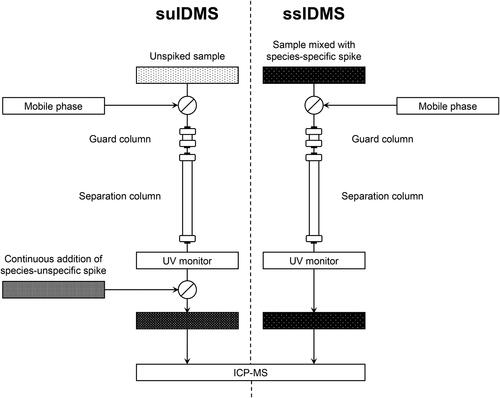
In relation to IDMS for elemental speciation analysis, two operational approaches have been developed for performing the isotope ratio measurements, species specific spiking (ssIDMS) and species unspecific spiking (suIDMS),[Citation16] which are still in use and the practical aspects are illustrated in . The former method requires that the structure of the chemical species in the sample is known and that a suitable isotopically enriched molecular spike material is available, the latter method is used where the species of interest is unidentified or an exact standard containing an enriched isotope is not available, so uses an enriched elemental spike. Both approaches were effectively developed in response to the availability of the necessary isotopic materials, in particular suIDMS was proposed because of the lack of suitable isotopically enriched molecular analogues for the measurands being studied. At the time these two approaches were instigated, the majority of spike materials consisted of isotopically enriched elemental solutions, which led to the adoption and use of post-column infusion of the spike as seen in suIDMS. Subsequently, as molecular standards containing enriched isotopes were synthesized, it became possible to undertake ssIDMS, mainly with covalently bound organometallic compounds, which were relatively straightforward to prepare, but potentially hazardous.[Citation17,Citation18]
Figure 1. Work-flow diagram for species-unspecific isotope dilution mass spectrometry (SU-IDMS, left) compared with species-specific isotope dilution mass spectrometry (SS-IDMS, right) using a single separation column with UV-visible monitoring and online ICP-MS elemental quantitation. In species-unspecific IDMS, the isotopically enriched spike is continuously added post-separation, whereas in species-specific IDMS, the sample is mixed with an isotopically enriched species-specific spike before chromatographic separation.
The use of IDMS for biomolecular determinations was limited in the early work,[Citation16,Citation19] to quantifying environmental heavy metals bound to humic substances, using enriched isotopes added post separation in the suIDMS approach. However, species-specific spiking is superior to the use of species-unspecific spiking because the spike is added at the earliest stages of the analytical workflow, such that any chemical or physical losses of the analyte, or of the metal center, during the analytical procedure will be corrected for in the final IDMS measurement. This is a major advantage over the suIDMS approach. The caveat in ssIDMS is that both the spike and the analyte need to have reached chemical equilibrium prior to extraction, otherwise any changes are left unaccounted for by the IDMS procedure.
To show the potential for using the ssIDMS approach for the measurement of metalloproteins, the first isotopically enriched metalloprotein, rusticyanin (Rc) was prepared in 2005 using a recombinant protein system.[Citation20] This involved ligating the DNA encoding for Rc into bacterial cells, to be expressed in a suitable quantity and then extracted for use. The apo-protein generated was metalated using an enriched 65Cu isotopic solution (95% abundance) followed by purification via dialysis. The structure and isotopic content of the enriched metalloprotein was confirmed using electrospray mass spectrometry. It was most important in these initial studies to demonstrate that the non-covalently bound metal was not subject to isotopic exchange during the procedure, in particular the chromatographic separation. Stability to exchange of isotopes under different chromatographic conditions was tested and the metal center of this protein was found to be stable, meaning that ssIDMS of metalloproteins was possible. In practice, it is essential that the enriched isotope in the spike protein does not undergo rapid exchange reactions either by loss from the protein, or by scavenging of free natural-abundance metal ions during preparation. A possible loss of metal from the protein spike, with the potential of reacquiring free metal would lead to a change in the isotopic signature of the spike. Isotope dilution would not correct for this because the isotopic content of the enriched protein would be altered. The use of IDMS calibration approaches in speciation and metalloproteomic applications have been reviewed and describe a significant body of work in the measurement of simple organometallic compounds and peptides (including selenomethione),[Citation11] the application of IDMS to quantitative proteomics[Citation21] and the use of IDMS for metalloproteins and the multi-elemental analysis of organometallic compounds.[Citation22]
The two main advantages of using a recombinant cell system to produce enriched metalloprotein spikes for use in IDMS, are that a specific protein standard can be prepared, thus ensuring excellent measurement traceability and it is not necessary to denature it to remove the metal center prior to remetallation with the enriched isotope, as it is produced as an apo-protein. Most commercially available metalloprotein standards which have been used to produce spike materials in subsequent work, are not well-characterized, lack appropriate traceability, can contain different isoforms of the protein being studied and are often of low purity. This can lead to poor chromatographic peak shapes and problems with extra peaks due to impurities. For example, in subsequent work on the metalloprotein SOD[Citation23] one of the problems encountered was that it is not easy to fully demetallate the metalloprotein prior to incorporation of the enriched isotope. In this case demetallation involved lowering the pH significantly to pH 4, which would have a significant denaturing effect on the protein structure. This approach led to only partial replacement of the metals and the presence of some apo-form of the protein in the standard, resulting in a drop in enzymatic activity of 30% compared to the wild-type metalloprotein. However, the advantages[Citation24] of using measurements based on the response of the metal isotopes to determine the amount of the metalloprotein, rather than using a molecular standard, are that the calibration standard used is an elemental solution with high traceability. It is then a relatively simple matter to convert the response for the metal to the concentration of the molecule by using the stoichiometry of the compound.
The issues of standardization of metalloprotein and selenoprotein quantification has been the focus of clinical chemists and metrologists for the past decade. Because some metalloproteins are important biomarkers (for details the reader is referred to the sections below) there is a dire need for traceable methods, particularly for the quality assurance purposes of routinely used clinical methods. This issue is being addressed in several publications considered below as well as in large-scale research projects initiated by the national metrology authorities. For example, a number of different metal-containing proteins were studied in a European Metrology Research Programme (EMRP) project related to metallomics,[Citation25] with a particular focus on the measurement of metalloproteins using ssIDMS. This project was undertaken because there are so few standardized techniques available for the measurement of metalloproteins, and a general lack of primary reference methods. Hence results of inter-laboratory comparisons and evaluations of different diagnostic kits for measuring metalloprotein concentrations are often inconsistent and as noted above, lack strong metrological traceability. The EMRP project developed primary reference measurement procedures for the quantification of metalloproteins, traceable to international measurement standards, including methods to separate, identify and detect: Cp; Tf; Tf-vanadium complex; Hb; Cu/Zn superoxide dismutase (SOD) and the selenoproteins SELENOP and glutathione peroxidase-3. Such major research projects indicate the importance of standardization to achieve accuracy and traceability in modern clinical chemistry ensuring the traceability of the measurements.
Classic proteomics using IDMS for the quantification of metalloproteins
Classically, the quantification of proteins has extensively used IDMS calibration by means of an isotope-labeled (2H, 13C, and 15N) protein as internal standard and analysis by LC coupled to MS/MS.[Citation26–28] Because IDMS can provide absolute quantitation, and thus improve traceability, it is frequently used for the development of CRMs, an example of which was reported by Bi et al.[Citation29] during the characterization of a hemoglobin A1c (HbA1c) reference material. Peptides were separated using reversed phase chromatography (C18 column), followed by ssIDMS using electrospray ionization (ESI) mass spectrometry with deuterium-labeled (2H) amino acids. This gave an expanded uncertainty (k = 2) of 1.9%. In a later study, HbA1c from lyophilized human hemolysate samples were subject to similar enzymatic proteolysis followed by reversed phase HPLC,[Citation30] again using ssIDMS with isotopically (2H, 13C, and 15N) labeled peptides measured by LC-ESI-MS/MS, and provided an expanded uncertainty (k = 2) of 2.6–2.8%. It is likely that the metal and/or heme group were lost during the proteolysis step, highlighting why the enriched 2H, 13C, and 15N were used and not enriched Fe. In 2016, Li et al. described a SI-traceable IDMS method to quantify human Tf using tandem mass tags (TMT).[Citation2] Isotope-labeled Tf was obtained using different TMTs. After digestion, peptides were separated by nano-liquid chromatography and fractions were automatically collected on MALDI targets for subsequent analysis by MALDI-TOF-MS. This approach, using ssIDMS with TMT peptides achieved a detection limit (LOD) of 17.1 µg g−1, the LOQ was 56.9 µg g−1 and the expanded uncertainty (k = 2) was 4.7%. Mean recoveries were between 97.15% and 105.10%. These examples demonstrate how proteomic techniques have been applied to the characterization of metalloproteins, thus demonstrating how classical methods have facilitated the trend for using IDMS in their study. Such an approach is particularly beneficial for apo- (metal-free) form metalloprotein quantitation and is therefore highly complementary to IDMS measurements of the heteroatom itself.
Sulfur-based analysis as a development of 2H/13C/15N-IDMS for metalloprotein analysis
Two works describe the species-unspecific characterization of MT using 34S suIDMS. In the first example, MT was obtained from human brain samples (temporal, occipital, parietal, cerebellum), and included comparison of MT expression between patients with Alzheimer’s disease and an age-matched control population.[Citation31] After tissue homogenization and de-fatting, separation was achieved using either capillary electrophoresis (fused silica, 75 µm i.d., 30 kV) or SEC (Superdex 75 PG) coupled to elemental detection by ICP-MS. With sulfur stoichiometries of MTs already known, quantities of MT isoforms were readily calculated. Similar precision in MT measurements were achieved for MT from brain cytosols compared to MT standards (peak area RSD (n = 5) 4.8% and 9.5%, respectively). However, no recoveries were determined.[Citation31] In the second example, rabbit liver MT was investigated with suIDMS expanded to include 65Cu, 68Zn, and 116Cd in addition to 34S[Citation32] – for more detail the reader is referred to Zn section. Using a natural isotopic sulfur isotopic RM (IRMM-644) and human serum protein CRM (ERM-DA470k/IFCC), recoveries of between 101.7% (Cu) and 106.6% (Zn) were reported with an expanded uncertainty (k = 4) of approximately 15%. For more information on MTs, the reader is referred to the Section “Copper- and Zinc-containing metalloproteins.”
In a similar study, Tf, and Alb in human serum protein CRMs of the same origin (ERM-DA470k/IFCC) were separately quantified using post-column infusion of 34S (suIDMS).[Citation33] Proteins were first separated using non-denaturating (native conditions, i.e., in the absence of sodium dodecyl sulfate, SDS) polyacrylamide gel electrophoresis (PAGE), followed by laser ablation (LA) coupled to ICP-MS detection. Detection limits for Tf and Alb were 0.55 and 2.68 mg mL−1, respectively, with an expanded uncertainty (k = 2) of 2–3%.
In 2016, an example of ssIDMS for sulfur was reported by Hermann et al.[Citation34] whereby 34S-enriched amino acid standards were obtained via in vivo protein synthesis in yeast. The oxidized products of 34S-labeled Cys and Met (cysteic acid and methionine sulfone, respectively) were obtained after oxidative treatment and protein hydrolysis. Hydrophilic interaction liquid chromatography (HILIC) was coupled to ESI-MS/MS to characterize the amino acids after hydrolysis, which were quantified using SAX chromatography coupled to triple quadrupole ICP-MS, with a reported detection limit of 0.6 µmol L−1 and expanded uncertainty (k = 2) of 13–14%. In vivo 34S enrichments achieved 96.3 ± 0.4% (n = 3) and 98.5 ± 0.4% (n = 3) recovery for cysteic acid and methionine sulfone, respectively. The enriched amino acid derivatives were then applied for the IDMS quantitation of Cp, achieving a relative standard uncertainty of 5% (irrespective of whether 34S-labeled Cys or 34S-labeled Met was used).
Iron-containing metalloproteins
Iron is an essential trace metal for the human body. The most well-known iron function is its presence in Hb molecules, facilitating oxygen transport. However, there are also a number of iron-containing enzymes, which are mainly involved in redox metabolic pathways due to the redox properties of Fe ions.[Citation35] Metalloproteins utilizing iron as a prosthetic group are referred to as ferroproteins, which can be divided into two major groups depending on the chemical surroundings of the iron atoms. Hemoproteins,[Citation36] contain hem structures, and non-hemo ferroproteins contain iron in a different chemical environment such as iron-sulfur clusters.[Citation37,Citation38]
A strict redox balance and highly regulated homeostasis of iron in the body is mandatory.[Citation39,Citation40] In particular, ferrous iron Fe(II) exhibits a pronounced pro-oxidant effect because in the cells they tend to be present in free ionic form in relatively higher extent compared to ferric Fe(III) ions, which are mostly tightly bound to proteins and other molecules;[Citation41,Citation42] thus, ferrous iron actively forms reactive oxygen species (ROS) via Fenton reaction.[Citation43] It is noteworthy, that the majority of ferroproteins are membrane-bound or intracellularly located, including respiratory chain proteins, myoglobin, and different Fe-dependent oxidases. Those proteins are mostly not present in the circulation of the bloodstream and are not widely used as biomarkers in clinical practice. Thus, only a limited number of ferroproteins are within the scope of clinical chemistry.[Citation44] These include Tf, Fer, and Hb, which will be discussed in terms of IDMS calibration. Iron is the most well explored element in terms of production and implementation of isotopically enriched standards of metalloproteins, some of these standards became rather commonly used, particularly for Tf and Hb measurements. Thus, in the current paper the production of the spikes is summarized in for easier comparison between methodologies.
Table 1. Isotopic spikes for species-specific IDMS used for the quantification of iron-containing metalloproteins – tabulated for easier comparison of spike manufacturing techniques.
Transferrin
Transferrin (Tf) is an iron transporting protein synthesized in the liver to distribute Fe into peripheral (non-hepatic) tissue, particularly into the bone marrow for hemopoiesis. In humans, Tf is a glycoprotein consisting of 679 amino acids that binds a maximum of two Fe(III) ions. Any disturbance of the regulated balance between different Fe species leads to detrimental cellular outcomes[Citation45] so the body tends to always bind Fe to proteins. Iron binds to Tf to ensure safe transport across the body without inducing Fe toxicity. The cells take up Tf after binding to the Tf receptor via receptor-mediated endocytosis and Fe is released from Tf intracellularly to be stored by another ferroprotein, Fer. Apo-Tf is returned into the circulation via exocytosis.[Citation46] The concentration of Tf and the Tf iron saturation are important clinical biomarkers of body iron status. Increased levels of Tf correspond to iron deficiency or pregnancy, whereas low levels correspond to infection (negative acute phase protein), liver disease or hemochromatosis.[Citation44] Thus, the development of reference methods using IDMS approaches to underpin traceability of Tf measurements is a significant improvement in clinical chemistry.
Feng et al. determined Tf and Alb in the serum CRM ERM-DA470/IFCC using size SEC separation for standard protein mixtures and SAX chromatography for serum proteins.[Citation47] Gradient elution with ammonium formate (0–500 mM) in 20 mM Tris-HAc (pH 8.6) was used for separation; flow rate was 0.7 mL min−1; separation time was 30 minutes. Species unspecific IDMS with 34S and 54Fe was employed for quantification (the exact chemical nature of the post column spike was not disclosed, isotopic abundances were 98 and 10.1% for 34S and 54Fe, respectively). Sector field (SF) ICP-MS at medium resolution (m/Δm = 4000) was used to detect the following isotopes: 13C, 32S, 34S, 54Fe, and 56Fe. The authors reported an RSD of 1–2%; however, no real samples were tested and other analytical performance parameters such as the expanded uncertainty or LOD/LOQ were not included.
A more perspective approach in respect of accuracy and traceability may be related to the ssIDMS quantification of Tf. Because Tf is a glycoprotein its degree of glycosylation can be used as a biomarker per se, including for: alcohol abuse;[Citation48] and also some cancers and genetic conditions related to the distortion of protein glycosylation.[Citation49,Citation50] Del Castillo Busto et al. designed a method for the quantification of Tf and the study of its glycosylation using ssIDMS.[Citation51] Saturation of Tf with 57Fe was used for ssIDMS and the spike material was characterized by reverse suIDMS with iron-citrate with natural abundance Fe (). Serum proteins were separated using an anion exchange column Mono-Q HR 5/5 and collision cell ICP-MS was used for detection. Sialoforms of Tf were investigated by electrospray mass spectrometry to study Tf glycosylation and Tf saturated with enriched 57Fe (abundance 92.41%) was used in ssIDMS; 10 serum samples were analyzed to demonstrate the feasibility of the method and the sum of the Tf sialoforms were compared suIDMS to total Tf.[Citation51] Species-specific method showed 17% higher results for the total (although the results were statistically comparable). This may indicate that for suIDMS there could be unaccounted protein loses, which is not the case for the ssIDMS.
Konz et al.[Citation52] used non-denaturating gel electrophoresis (1-PAGE) and LA-ICP-MS for the ssIDMS quantification of Tf. The 57Fe-Tf spike (94.42% abundance) was prepared as indicated in . SF-ICP-MS at medium resolution (m/Δm = 4000) was used for detection. The proteins were separated on vertical gel at 300 V for 20 minutes and submitted to LA-ICP-MS analysis. The method was tested in human serum samples. The Tf LOD was 0.2 g L−1 and a serum CRM ERMDA470k/IFCC was employed for the validation. The reported uncertainty for the IDMS quantification was 1.7% as opposed to external calibration yielding 13.4% (coverage factor k was not reported).[Citation52]
Frank et al. developed standardized protocols to study Tf iron saturation, using ssIDMS and Raman spectroscopy.[Citation53] For the IDMS method, the isotope spike (see ), the separation using SAX and detection via quadrupole ICP-MS were performed similarly to the study of del Castillo Busto et al.[Citation51] A human serum CRM ERM-DA470k/IFCC certified for Tf was used for validation and the expanded uncertainty of 4% (k = 2.3) was reported for ssIDMS measurements. In a follow-up study by the same group,[Citation54] the approach was further developed into a triple IDMS method. For triple IDMS, the determination of the isotope ratio of the spike was no longer necessary for the quantitation. The authors stated that compared to double IDMS, although the measurement time increased, the preparation for triple IDMS was comparable to double IDMS in respect of complexity. As a result the expanded uncertainty was reduced[Citation54] from 4.0% to 3.6% (based on the reference material used) for the concentration level of ca. 2 g/kg, compared to the previous study.[Citation53]
A recent publication by Brauckmann et al. summarized the combination of IDMS and standard addition method for element quantitation in different complex matrices.[Citation55] In particular, the authors tested the applicability for silicon in aqueous tetramethylammonium hydroxide; sulfur in biodiesel; and Tf-bound iron in human serum. For Tf-bound iron quantitation in serum, lipoprotein precipitation was performed by magnesium chloride and sodium dextran sulfate solution after the gravimetric sample and blend preparation. The mixtures were incubated for 30 minutes at 4 °C and centrifuged at 12,000 g for 10 minutes. The supernatant was purified with desalting gel filtration PD MidiTrap™ columns. The solutions obtained were used for the HPLC-ICP-MS analysis using SAX column MonoQ® GL 5/50 and mobile phases containing Tris buffer and NH4Ac at pH 6.4. Isotopic spike was prepared as shown in . Reference material Seronorm™ Immunoprotein Lyo L-1 was analyzed to test the method’s accuracy, while reference material ERM®-DA470k/IFCC “Human Serum” was used as a standard addition. An expanded uncertainty (k = 1) of 2.2–3.5% was reported.[Citation55]
Ferritin
Ferritin (Fer) is the main iron storage protein in the human body,[Citation56] which keeps a reserve of this essential metal in a soluble, nontoxic and usable form inside the cytoplasm.[Citation57] It is built up from two subunits, H-Fer and L-Fer; Fe2+ is oxidized to Fe3+ by the H-Fer subunit, maintaining the labile Fe2+ pool and Fer at equilibrium.[Citation43]
Some glycosylated Fer is present in the blood, showing low iron content compared to intracellular Fer.[Citation57] Circulating Fer and its iron saturation (up to 4500 iron atoms per molecule) are important biomarkers of iron-related disorders.[Citation58] A crude estimation of Fer-associated iron in blood serum/plasma may be undertaken by measuring the so-called non-Tf bound iron. For instance, Yang et al.[Citation59] designed an IDMS protocol for non-Tf bound iron quantification, whereby non-Tf Fe was converted into nitrilotriacetic acid (NTA) complex by treatment with pH 7.4 buffered NTA and ultrafiltration at 4500 g for 30 minutes and spiked with 57Fe-NTA complex, 57Fe abundance 96.2% (). Ultrafiltration with 30 kDa cutoff filters was used to separate Tf-bound iron. Spiked serum filtrate was dried and then mineralized in a microwave digestion system using HNO3/H2O2 mixture and Fe was purified by AEC and ammonium hydroxide precipitation. Negative ionization mode thermal ionization mass spectrometry (TIMS) was used for the detection of Fe as FeF4− molecular ions.[Citation59] The authors reported a LOD (3σ) of 32 µg L−1 and expanded uncertainty (k = 1) of 13.5%. Previously, a similar negative ionization mode TIMS approach with IDMS was demonstrated to be applicable to the determination of Fer-bound iron in plant seeds.[Citation60] The seeds were spiked with recombinant 57Fe-Fer, abundance 95.07%[Citation61] (see ) and the plant samples were extracted by grinding followed by suspension in ice-cold 20 mM Tris buffer, containing 1 mM EDTA, 1 mM phenylmethylsulfonyl fluoride (PMSF) and 1% polyvinylpolypyrrolidone (PVPP) at pH 7.4, and centrifugated at 5000 g for 20 minutes at 4 °C. The extracts of plant Fer were purified by ion-exchange chromatography on diethyl aminoethyl (DEAE) sepharose chromatography columns, followed by 100 kDa cutoff ultrafiltration spin columns. Collected Fer fractions were mineralized using HNO3/H2O2 mixture in a microwave system. Iron was isolated by preparative SAX and further purified by extraction into diethyl ether. The absolute LOD (3σ) of Fer-bound iron was 60 ng. The expanded uncertainty was not evaluated, a repeatability of <5% RSD was reported.
Direct measurement of Fer-bound iron poses a higher interest for Clinical Chemistry, first of all, due to their greater traceability, compared to non-strictly defined and protocol-dependent, non-Tf bound iron fractions. Ren and Walczyk used ssIDMS with TIMS detection (negative mode as FeF4−) for the quantification of Fer-bound Fe in serum from a healthy volunteer.[Citation62] Each serum aliquot was spiked with recombinant plant Phaseolus vulgaris (common bean) 57Fe-Fer containing 5 mg Fe (see ); serum Fer was isolated by ultrafiltration (4500 rpm for 20 minutes six times) and mineralized with HNO3/H2O2. Iron was separated from the sample matrix by preparative SAX (Dowex AG-1 × 8) and further purified by ammonium hydroxide precipitation. Absolute LOD (3σ) of Fer-bound Fe was 18 ng and combined uncertainty (k = 1) was 7–8%.[Citation62] Unfortunately, although Fer is a rather conserved protein among different domains of life, the authors did not consider potential sequence and structural discrepancies between human and Phaseolus vulgaris Fer.
A different ssIDMS approach was used by Konz et al. for the measurement of iron: serum Fer ratio.[Citation58] The methodology involved two commercial anti-Fer monoclonal antibodies, one of which was biotinylated and the other one was labeled with a ruthenium chelate [Ru(2,2′-bipyridine)3]2+. The complex formed between Fer and the two antibodies was isolated using streptavidin-coated magnetic microparticles and directly introduced into SF-ICP-MS for Ru monitoring (medium resolution, m/Δm = 4000). Blood serum from 40 healthy individuals was analyzed and Fer was isolated by protein precipitation with methanol, followed by heat precipitation, and ultrafiltration (100 kDa cutoff). 99Ru isotopically labeled (abundance 85.90%) tag antibody was used for Fer quantitation. Also, the authors used ssIDMS with 57Fe (abundance 94.82%) combined with monitoring of Ru to study iron Fer saturation using SEC-ICP-MS. The recovery of 85–109% was obtained for the Fer reference material (NIBSC 94/572) with repeatability RSD of ≤5% and LOD of Fer of ca. 0.5 µg L−1.[Citation58] Certainly, tagging methods offer a powerful technique for protein quantitation using IDMS, but it is outside the scope of the current review; the reader is referred to Ref.[Citation63–65]
In 2020, Tchaikovsky et al. presented a protocol for Fer isolation and ssIDMS quantification (57Fe, abundance 95.08%) in murine brain tissue and blood serum.[Citation66] In the protocol, murine serum was applied to membrane filters (100 kDa cutoff), centrifuged (15,000 g, 1 hour, 4 °C) and washed with 50 mM ammonium acetate buffer at pH 6.8. Brain hemispheres (ca. 200 mg) were extracted in duplicate, by mixing with 1 mL of freshly prepared ice-cold lysis buffer, then homogenized manually and the extracts centrifuged (15,000 g, 20 minutes, 4 °C). All samples were measured within 24 hours after the harvest using SEC-ICP-MS/MS (O2 mode) with a capillary MAbPac™ reversed phase column. Importantly, the authors pointed out the splitting of the Fer peak, due to potential protein oligomerization. For the real samples of murine serum, ultrafiltration was required to remove co-elution prior to SEC, even so, a low recovery (40%) was obtained, but for the brain sample extracts, the authors indicated no such problems. Expanded uncertainty (k = 2) of 11% and the LOD of 2.2 ng g−1 were reported.[Citation66]
Hemoglobin
Hemoglobin (Hb) is an oxygen-carrying iron-containing protein found in red blood cells. It consists of four subunits (dimer of alpha and beta-Hb chains); each chain has an iron-containing hem prosthetic group, directly responsible for oxygen and CO2 transport in the blood stream.[Citation67] The HbAo Hb form is the most abundant in adult humans (96–98%) and contains two α-chains and two β-chains; a minor Hb form (1–3%) is HbA2, which contains two α-chains and two δ-chains.[Citation44] In newborns, fetal HbF dominates (60–80%) whereas in the sickle cell phenotype HbS is present.[Citation68] Finally, HbA1c is a glycated form of HbA0, which is an important biomarker of diabetes mellitus.[Citation69]
Blood Hb is one of the most common parameters to be assessed clinically and HbA1c is also very widely measured as part of routine diabetes control monitoring. The quantification of Hb in the clinical setting is widely undertaken according to standardized protocols. However, these routine protocols are not truly traceable to the SI unit of measurement.
One of the first ICP-MS based IDMS protocol for Hb quantification was proposed by del Castillo Busto et al.[Citation70] They used suIDMS for absolute and relative quantification of glycated Hb (HbA1c) in human blood. A cation exchange column Mono S 4.6/100 PE was used for the separation under gradient elution with ammonium malonate and ammonium acetate. The calibrant spike material was 57Fe in the form of citrate, which was used for suIDMS measurement using collision cell ICP-MS. Molecular mass spectrometry was used to complement the identification of the different Hb isoforms and the potential interferences from Hb carbamylation and acetylation were investigated. The protocol was tested in 11 patients and glycated Hb reference materials. The reported coefficients of variations were 1.7% and 3.7% as short and intermediate precision.[Citation70]
Frank et al. compared the following methods of Hb quantification: spectrophotometric cyanmethemoglobin reference method (HiCN); spectrophotometric cyanide free assay with alkaline hematin detergent[Citation71,Citation72]; ICP-MS, including single, double and triple ssIDMS; and Raman spectrometry with ID. Different forms of Hb, i.e., HbA0, HbA2, HbF, and HbS were tested. The purity of HbA1 was determined by amino acid analysis.[Citation73] The species-specific spike was prepared in accordance with Brauckmann et al.[Citation74] (see ). The expanded uncertainty for IDMS quantification of Hb (k = 2) was 3.0%, 1.6%, and 2.2% for single, double and triple ssIDMS, respectively.[Citation73]
For clinically relevant iron-containing proteins, including Hb, Tf and especially Fer, studies striving to design SI traceable protocols for metalloprotein quantification have been published. Iron being a multi-isotope element (a natural mixture of 54Fe, 56Fe, 57Fe, and 58Fe) offers diverse possibilities for the use of IDMS approaches, including double and triple IDMS, with the isotopic standards available. Mostly 57Fe (natural isotopic abundance of 2.119%) is currently used for ID spikes. Technical challenges for iron quantification when using ICP-MS, include, spectral interferences in ICP, which require the use of collision or reaction, cell technology or at least medium resolution (m/Δm 4000) in SF-ICP-MS, the possibility of species redistribution (e.g., due to oxidation) and to a lesser extent, contamination causing high blank values. Although more studies are focused on Fer rather than Tf or Hb, the authors of the current review attribute that to the more “problematic” nature of Fer as a non-hemoprotein as an analyte and spike for IDMS because Fer-related studies seem not to evolve into IDMS reference methods, as is the case for Hb or Tf. These problems are related to the instability of iron-binding, peak splitting and tailing in chromatography as reported, e.g., by Tchaikovsky et al.[Citation66] The reference techniques for Hb and Tf quantification, used before the advancement of ID protocols also seem more reliable than those of Fer quantification. Finally, although Fer, Hb, and Tf are the most relevant clinical biomarkers amongst ferroproteins, the diversity of iron-containing proteins in the human body is significantly larger. One may expect that with the advancement of biomarker research more of these will be incorporated into the lists of clinically assessed parameters, particularly as the state-of-art analytical techniques are capable of providing the new methods required.
Copper- and zinc-containing metalloproteins
Both Cu and Zn are co-factors and stabilizing ions for a number of important metalloproteins, including some metalloenzymes and as such, both elements are essential for life. In the case of Zn, about 10% of the proteome is thought to contain in vivo Zn binding affinity and it is present in all classes of enzyme.[Citation3] Its functions range from redox regulation, DNA synthesis via Zn-finger proteins and intracellular signaling, to possible contributions to the progression of Alzheimer’s disease.[Citation3] As a result of its wide-ranging functionality, deficiency in humans can lead to a failure to thrive and so it is routinely measured in a clinical scenario. Although less common in those living in developed nations, Zn deficiency has been described in individuals consuming diets with low Zn bioavailability and it can also be low in those with extensive burns, during systemic inflammatory conditions, chronic disease, and genetic disorders such as acrodermatitis enteropathica.
Like Zn, Cu is an essential element and also commonly measured clinically, both to determine the possibility of nutritional deficiency, but also in the diagnosis and management of inherited metabolic metal conditions such as Wilson or Menkes disease, which are disorders of Cu uptake and metabolism. Deficiency of Cu is prevalent in some populations and can lead to hematological disorders such as anemia, as well as neurological complications, in particular a myelopathy similar to that caused by vitamin B12 deficiency (2). From a clinical perspective, Cu is increased in inflammatory states, due to up-regulation of the ferroxidase enzyme Cp, the main Cu-containing metalloprotein in circulation.[Citation75]
Whilst there are a wide range and diversity of Zn and Cu containing metalloproteins of varying importance in the biosphere, the majority of work utilizing IDMS measurements has focused on the Zn/Cu containing proteins, SOD and MT, both important in the protection of cells against oxidative stress. In particular, the SOD family of metalloenzymes convert the superoxide free radical into oxygen and hydrogen peroxide. This function is facilitated by the redox cycle of Cu(II)/Cu(I), whilst the presence of Zn maintains the structural integrity of the protein. Other classes of SOD can contain Fe, Mn or Ni and perform the dismutase function in various cellular compartments, although only the Zn/Cu and Mn forms are present in humans; it is not possible to measure the Mn type by IDMS because Mn is mono-isotopic.
Following on from the earliest work on the characterization of rusticyanin as an IDMS metalloprotein spike material,[Citation20], initial studies on the measurement of SOD by ssIDMS,[Citation23] focused on the preparation and characterization of the isotopically enriched material from a commercially available standard. Both the Cu and Zn centers were isotopically altered using inorganic metal solutions where the lower abundance isotopes, 65Cu and 68Zn, were enriched. The wild-type SOD starting material was demetallated to form the apo-protein, by lowering the pH of the protein solutions below 4 using 1 M HCl, followed by extensive dialysis against a 20 mM Tris or acetate solution held at the same pH with and without EDTA solutions. For incorporation of the enriched isotopes into the apo-protein, an excess of the isotopically enriched standards 65Cu (99.2% abundance) and 68Zn (99.0% abundance) were added. The metals were either added sequentially at different pH values or together at pH 7.4 and gave variable results depending on the conditions. The isotopically enriched solutions were then allowed to stir for at least 24 hours followed by a final 24 hours dialysis, both steps at room temperature. The total SOD-metal recovery was between 33.4% and 137.4% for Cu and 31.4% and 106.7% for Zn and compared with the wild type-SOD, the enzyme activity for the enriched analogues was between 35.7% and 70.2%.[Citation23]
The resulting isotopically enriched holo-proteins were characterized using SEC-ICP-MS, native 1D-PAGE and enzymatic activity measurements. The last approach being a useful method to determine if the enriched Cu isotope was successfully re-incorporated into the protein, as the activity of the metalloenzyme is dependent on the Cu center being correctly bound within the protein. The highest enzyme activity for the isotopically enriched SOD was 70.2% of the activity of the wild-type naturally abundant metalloprotein. This was thought to be because the enriched SOD was a mixture of a remetallated form containing the 65Cu isotope with activity and the apo-protein, where Cu re-incorporation was unsuccessful. Spiking with naturally abundant Cu and Zn as well as EDTA was used to determine whether the enriched SOD was stable under SEC conditions, with respect to exchange of the metal center. It was found that the enriched material was stable and consequently it was used in an ssIDMS experiment to measure wild type SOD in a gravimetrically prepared stock standard. The results showed a recovery of 109 ± 4% compared to external calibration.[Citation23]
Subsequently, this approach to the preparation of SOD was used to prepare isotopically enriched materials to investigate the extent of orthogonal diffusion in 1D gel electrophoresis,[Citation76] which could interfere with the correct determination of the isotope ratios necessary in IDMS measurements using LA-ICP-MS. The matrix effect of a cytosolic liver extract on the non-covalently bound Cu and Zn in SOD was also evaluated and no significant metal loss from the SOD spike was observed. This study represents the first step necessary for establishing and evaluating the use of a ssIDMS approach for the absolute quantification of SOD in real samples based on the combination of gel electrophoresis and LA-ICP-MS.[Citation76] Unfortunately, it seems that this approach has only limited take up by the scientific community, even though it offers an excellent calibration approach, with the potential to overcome many of the drawbacks of sequential calibration methods used in LA-ICP-MS.
IDMS SOD traceable measurement was designed within the framework of the aforementioned EMRP project (see, introduction). The methods used to prepare the isotopically enriched spike material for SOD were developed from the procedures reported in the earlier work mentioned,[Citation76] and the results relating to SOD were further disseminated in a peer-reviewed paper.[Citation77] The identity of the starting protein was confirmed using molecular ESI-TOF-MS after reversed phase separation. The IDMS measurements, as well as the characterization of the potential enriched spike material, was achieved using a strong anion exchange column (MonoQ™ 5/50 GL) coupled to ICP-MS using a PEEK capillary. By using double and triple spiking ssIDMS measurements the concentration of SOD was quantified in human erythrocytes and showed a calculated mass fraction and expanded uncertainty of 63.94 ± 0.93 µg g−1 (n = 30) for double and 64.02 ± 0.96 µg g−1 (n = 30) for triple IDMS. Clearly, this level of accuracy, precision and traceability are a significant improvement and establishes the advantage of ssIDMS over other routinely used calibration approaches.
The metallothioneins (MTs) are a large group of comparatively small (24–308 amino acids), cysteine rich (13–38%) metalloproteins, that lack aromatic amino acid residues and can bind 7–12 metal atoms per molecule.[Citation78] They bind both essential (Zn and Cu) and toxic (Cd, Hg, etc.) metals, are widely distributed, particularly in the Eukaryota domain, and are also present in a few bacterial groups. They are classified according to either their metal preference or their amino acid sequence similarities, resulting in a number of families of very different MT isoforms. These MT consist of multiple isoforms classified into four groups (MT1 to MT4; MT1 is made up of 8 functional subgroups), which share a high degree of homology at the nucleotide and amino acid levels. The functions of MT relate in many ways to their ability to bind metals and include transport, storage, and detoxification, by virtue of their role in the protection of cells by neutralizing reactive oxygen species. Unsurprisingly, given the diverse nature of the MTs that have been classified, they have been associated with several diseases, including cancer, circulatory and septic shock, coronary and Alzheimer’s disease. However, the primary function of MT remains to be elucidated and whilst a number of MT genetic polymorphisms have been associated with human disease, the measurement of the protein has not yet been routinely used clinically as a biomarker.
A high prevalence of S-containing amino acids in the primary structure of the MT protein and its propensity to bind a large number of metal atoms in comparison to some other proteins, means that it has been widely studied analytically.[Citation79] The presence of a high concentration of S and metal atoms makes the measurement of MTs amenable to the use of IDMS calibration methods to provide high accuracy and traceability. The measurement of MTs has included both the use of isotopically enriched 34S (see section on S) and also the different bound metals, most notably Cd, Cu and Zn. In all cases this has been via suIDMS measurements where the enriched isotope is added post-column, whereas ssIDMS, has not been demonstrated.
The measurement of MT in ocular tissues by HPLC-ICP-MS[Citation80] used isotopically enriched 68Zn as a tracer in cell-line studies to investigate the stoichiometry of Zn and Cu in MT after treatment of the cells under different conditions, to determine the effect of Zn and cytokines on the gene-expression of MT isoforms. The cytosolic fraction was analyzed using an orthogonal approach, whereby the extracted proteins were first isolated using SEC (Superdex200 10/300GL) and the collected fractions relating to the MW of the MTs were then separated with greater resolution using AEC (MonoQ™ 5/50 GL). A metal scavenger column containing Chelex-100 impregnated with a C18 material was placed between the LC pump and the injector, in a bid to lower the background metal signal. To confirm the identity of the isolated MTs (7–14 kDa) from the SEC column, a tryptic digest was prepared and analyzed using a molecular MS method (MALDI-TOF-MS). A survey of the Swiss-Prot protein data base using MASCOT showed the main peptide mass mapping analysis corresponded to MT2A, with the highest sequence coverage (65%) and a score of 52, indicating that the isolated protein fraction predominately contained MT2A, but with other proteins present including other MT isoforms. The stoichiometry of the metals in the different MT fractions was determined by suIDMS using post-column addition of isotopically enriched 34S (99.61% abundance), 65Cu (90.03% abundance) and 111Cd (96.25% abundance). The Zn binding proteins, including the MTs, were quantified using a mathematical approach termed Isotope Pattern Deconvolution (IPD), which is based on linear least squares analysis to deconvolute the isotopic signals for all of the Zn isotopes. The IPD approach used enriched isotopes to: determine the stoichiometry of the Zn binding sites per MT molecule; follow the metabolism of Zn in MT using a tracer isotope (68Zn) added to the cell line; and quantify (67Zn) MT and the Zn bound to MT. Multiple MT isoforms were expressed in different tissues of the eye, with native MTZn6Cu1 predominant in the steady state.[Citation80] In a subsequent study,[Citation81] the same suIDMS quantification approach with IPD was used to quantify MTs in various ocular tissues, in particular retinal and retinal pigment epithelia material. The cytosolic water-soluble proteins (1–7 kDa) were separated on the same type of SEC column as before and the S-, Cu-, and Zn- binding proteins quantified using post-column addition of an isotopically enriched solution containing 34S (99.6% abundance), 67Zn (88.6% abundance), and 65Cu (99.0% abundance). To quantify S and Cu, IDMS methodology was employed. In the case of Zn, as the cells contained both naturally abundance Zn and an isotopically enriched 68Zn tracer isotope, Zn quantification was carried out by IPD. In addition, a LA-ICP-MS method was used to determine the spatial distribution of MT, which was present predominantly in the retinal tissues, possibly to protect against oxidative damage.[Citation80]
Various chromatographic approaches have been used with IDMS calibration for metalloprotein analysis, in particular HPLC specifically using SEC and AEC modes of separation. Capillary electrophoresis (CE) coupled to ICP-MS has also been successfully used with suIDMS. This method offers high separation efficiency, requires only small sample sizes and is complementary to HPLC. However, interfacing the method with ICP-MS can be problematic, due to the requirement to sustain electrical connectivity to the end of the capillary, but suitable make-up solutions and low-flow interfaces have been successfully developed to do this.[Citation82] The characterization of MT isoforms in a commercially available rabbit liver material and purified MT1 has used CE coupled to a SF-ICP-MS instrument, with suIDMS calibration.[Citation32] A specially designed low flow nebulizer (8 µL min−1) was used and a makeup liquid (ammonium nitrate at pH 7.4) was added post-separation to maintain electrical conductivity. This was spiked with the isotopic solution containing the enriched isotopes 65Cu (99.7% abundance), 68Zn (91.0% abundance), 116Cd (83.4% abundance) and 34S (85.9% abundance), prior to nebulization and isotope ratio measurement (see also section S). By adding the enriched spike material in this way, the authors reported that sufficient equilibration of the isotopes was possible for the IDMS measurement to be made. Medium resolution (m/Δm = 3000) was required to overcome the interference of 16O2 on 32S and 16O18O on 34S, however this resulted in poor LODs of 6.8 mg L−1 for S and 72.6 mg L−1 for MT1 (coefficient of variation, CV 11.3%).[Citation32]
With the more recent introduction of triple quadrupole ICP-MS instrumentation, it is now possible to overcome these interferences using oxygen gas in the collision cell, without the requirement for expensive SF instrumentation and possibly with better LODs, as ion transmission is less impacted using triple quadrupole instruments. The main source of error was thought to be related to the injection step and the CE separation, whereas the isotope ratio measurement contributed only a small amount to the error. The authors went on to use the same instrumentation and calibration method via suIDMS to measure MT1, MT2, and MT3 isoforms in human brain cytosol samples taken from patients with Alzheimer’s disease and from a control group.[Citation31] Each isoform was quantified using suIDMS using the isotope ratio measurement between 32S and 34S (see S section), after post-column addition of an enriched 34S isotopic spike solution and measurement by SF-ICP-MS in medium resolution mode (m/Δm = 3000).[Citation31]
The ferroxidase enzyme, Cp is involved in the conversion of Fe2+ to Fe3+, which facilitates the incorporation of iron into Tf, which only binds Fe3+.[Citation83,Citation84] It contains between 6 and 8 atoms of Cu per molecule and as such, accounts for approx. 95% of the Cu in human serum. Clinically this protein is important in the diagnosis and monitoring of patients with Wilson disease, a rare inherited disorder of Cu metabolism. It is also low in two further rare inherited diseases, Menkes disease and aceruloplasminemia. In the previously mentioned EMRP project,[Citation25] the preparation and use of Cp was investigated, with a view to preparing a species-specific spike material containing isotopically enriched 65Cu. However, preparation of the spike material was problematic because after successful demetallation of the protein, remetallation with the enriched 65Cu isotope was only partially successful, with only 50% incorporating the Cu atoms successfully. The authors suggested this was because a portion remained in the unfolded state containing no Cu. Unfortunately, no results were included for the quantification of Cp by ssIDMS using the spike material that was prepared, so it is not possible to establish any improvements in standardization of Cp that could be achieved using this approach. It would be useful to other workers in this area, if a fuller account of the methods that were tried but were unsuccessful, was published, so that this valuable and costly investigation could be of benefit to future attempts to facilitate production of an enriched Cp material.
Another clinical study into Wilson disease[Citation85] has used double ssIDMS to determine the amount of Alb-bound copper as a means to measure the so-called "exchangeable copper" fraction, an operationally defined component of serum which can be raised in untreated Wilson disease patients. An Alb spike material containing an enrichment of 65Cu (99.60% abundance) was prepared from the same source and lot number as the natural Alb standard, by adding an appropriate amount of 65Cu-enriched spike (∼500 mg kg−1 Cu in water, abundance 99.60%) to a solution of Alb (50 mg g−1) to achieve an optimal ratio of ∼0.75–1.0 (65Cu/Alb). The solution was gently vortex-mixed for 30 seconds and left at room temperature for 2 hours to assure the isotopic enrichment of Alb and kept at 4 °C until analysis. The characterization of the 65Cu-Alb spike for its total Cu content was determined by HPLC-ICP-MS during at least three independent days over 1 year and its mass fraction was also monitored by reverse HPLC-ICP-IDMS. After the synthesis and characterization of calibrant and spike Cu-Alb solutions, the determination of Cu-Alb was conducted in three human serum materials (LGC8211, ERM®-DA250a and Seronorm™ Human). The method accuracy of the HPLC-ICP-ssIDMS, assessed on sample blends spiked with Cu-ALB, ranged from 90% to 107%, and relative expanded uncertainties (k = 2) of 3% and 7% for Cu-Cp and Cu-Alb, respectively. The method was found to be able to discriminate between healthy and Wilson disease populations in terms of Cu-Alb content.
Selenoproteins
The metalloid selenium is required for diverse physiological functions in mammals, including immunity, fertility, antioxidant defense, brain function and thyroid hormone metabolism.[Citation86–90] Although Se is an essential trace element for the human body, it has a small range of adequacy, so can become toxic depending on its intake and speciation.[Citation45,Citation91,Citation92] The chemical properties of Se resemble those of sulfur, but with considerably higher nucleophilicity and electron transfer capacities[Citation93,Citation94] and, contrary to –SH, –SeH groups are ionized at physiological pH.[Citation95,Citation96] In humans, the biological activity of Se is mainly realized through 25 selenoproteins[Citation97–99] that contain the selenoamino acid selenocysteine (Sec), a 21st proteinogenic amino acid, at their active center.[Citation100,Citation101] Another selenoamino acid, selenomethionine (SeMet) is incorporated into proteins unspecifically, competing with its S analogue, Met, since the ribosome cannot properly distinguish them, ensuring the presence of Se in many different proteins.[Citation102–104]
A number of selenoproteins counteract oxidative stress in the body via their reductive enzymatic activity.[Citation105,Citation106] These selenoproteins include: glutathione peroxidases (GPX) types I–VI and VI, thioredoxin reductases type I–III, methionine sulfoxide reductase B1 and other less studied selenoproteins, including selenoprotein P (SELENOP, also abbreviated as SelP, SePP, SePP1 in previous studies), selenoprotein W, etc. Selenoproteins are mostly involved in redox pathways, for instance, GPXs are a group of enzymatically active selenoproteins capable of reducing hydrogen peroxide (and organic hydroperoxides in the case of GPX4 96), counteracting oxidative stress and ROS-associated cellular damage.[Citation105,Citation107]
Selenium and selenoproteins are implicated in a number of human diseases such as neurological and neurodegenerative diseases, metabolic disorders including diabetes mellitus type II as well as endemic deficiency diseases such as Keshan disease and Kashin-Beck disease.[Citation91] The human organism maintains a hierarchy of Se tissue distribution and selenoprotein expression.[Citation108] The organs and tissues requiring a stable supply of selenium, such as the brain, rank high in the hierarchy and are able to maintain stable levels of this element intake under selenium deficiency.[Citation99,Citation109,Citation110] Different biomarkers including total selenium in blood serum/plasma, toenail selenium, serum GPX3, serum SELENOP, red blood cell GPX1, etc. are used to evaluate individual or population selenium status.[Citation104]
One of the pioneering studies on IDMS quantification of selenocompounds in human serum was undertaken by Encinar et al.[Citation111] in 2004. They submitted serum proteins to enzymatic hydrolysis after treatment with urea, dithiothreitol and iodoacetamide to reduce Cys and Sec residues and prevent their further oxidation. A species-specific isotopic spike, 77SeMet, was isolated from selenized yeast and used for both SeMet- and Sec-containing proteins. Selenoamino acids were separated using a 2D size exclusion - capillary С18 HPLC with collision cell ICP-MS detection.[Citation111] The drawback was related to the use of SeMet spike for the quantification of Sec. SeMet has rather different chemical properties compared to Sec, being less prone to oxidation, releasing inorganic Se. Besides, SeMet is also present in general body proteins (e.g., Alb), which usually have significantly higher concentrations in biological samples over Sec-containing selenoproteins. Jitaru et al. further evolved this approach by designing a protocol capable of measuring selenoproteins GPX and SELENOP as well as selenized human serum Alb (SeAlb) in pooled human serum and reference materials BCR-637 and Seronorm™ level 1 and 2 using suIDMS.[Citation112] SeAlb was enzymatically hydrolyzed and the resulting SeMet was quantified using C18 HPLC-ICP-MS. In this case, 76SeMet was used to assess the hydrolysis yield, SeAlb was determined in intact SeAlb by affinity-HPLC coupled to quadrupole ICP-MS. GPX and SELENOP were quantified in the same samples as intact proteins, using external calibration with SeMet standards. The reported LOD of SeMet was 3.5 ng g−1; with repeatability RSD of 3.3% (n = 15).[Citation112]
Gómez-Espina et al. introduced a similar approach for the determination of selenoprotein GPX1 in red blood cells, in this case, based on Sec quantification with suIDMS.[Citation113] The proteins were separated by SEC and the fraction corresponding to GPX1 was collected after the elution, preconcentrated by freeze-drying and submitted to trypsinization. The resulting peptides were analyzed using capillary C18 reversed-phase electrospray ionization-ICP-MS (HPLC-ESI-ICP-MS) and electrospray ionization quadrupole-time of flight mass spectrometry (ESI-QTOF-MS). Recoveries of about 90 ± 20% (mean ± SD, n = 3) were obtained. However, in this case, suIDMS with 74Se was used for quantification, which reduces the traceability benefits of the IDMS. The LOD was 1.5 µg L−1 as Se.[Citation113]
A selenium transporting protein SELENOP[Citation109,Citation114] with multiple functions,[Citation115] contains multiple Sec residues, including ten in humans,[Citation91,Citation116] which considerably differs from the other selenoproteins of this group. Deitrich et al. designed a protocol for SELENOP quantification in human blood serum using ssIDMS.[Citation117] Serum proteins were trypsinized (24 hours, 37 °C), the peptides separated by C18 reversed phase HPLC and detected using triple quadrupole ICP-MS in oxygen mode (78/76Se and 82/76Se ratios were monitored as Se16O+ species). Characteristic 76Se-enriched peptides ENLPSLCSUQGLR and AEENITESCQUR (U stands for Sec) were chemically synthesized and used as ID spikes. The peptides were also analyzed by electrospray ESI-QTOF-MS to ensure full proteolysis and equilibration with the spike. The authors reported the expanded uncertainty (k = 2) of 5% and LODs of 1.38 and 2.74 µg kg−1 Se, depending on the peptide used for spiking.[Citation117]
An alternative approach for SELENOP IDMS quantification was used by del Castillo Busto et al.[Citation118] The ID spike material consisted of modified SELENOP whereby the Sec residues were replaced by the S analogue Cys, which was produced by cell-free Escherichia coli protein synthesis. Sec codons in human SELENOP gene were replaced with Cys codons by point mutations. Se (ICP tag) was introduced in the form of 76SeMet, supplemented as a source of Met to be introduced at 4 usual Met sites in a SELENOP molecule. The product was characterized by Orbitrap ultra-performance liquid chromatography (UPLC) coupled to ESI MS/MS. For the quantification, double-affinity HPLC involving simultaneous fractionation of the selected selenoproteins, GPX3, SELENOP and SeAlb, was used for separation, coupled to single quadrupole ICP-MS (77/76Se isotope ratio was monitored). The stability of the blends was tested within one month. NIST SRM 1950 metabolites in human plasma and human serum CRM BCR-637 were used to test the expanded uncertainty (k = 2); the values of 5.7–7.7% were reported.[Citation118]
The analysis of the published literature on the accurate and traceable quantification using IDMS of Se-containing proteins (SeAlb) and selenoproteins (i.e., GPX and SELENOP) indicates that this field is still under development and requires further insight. The majority of selenoproteins (25 in humans) are currently not covered, which may partially be attributed to their intracellular localization.[Citation91] Importantly, the production of the isotopically enriched spikes for selenoproteins is somewhat more problematic compared to other metalloproteins (e.g., containing Fe, Cu, Zn, etc.). The reason being the presence of Se atoms in the polypeptide chains per se, rather than being a part of a prosthetic group. Thus, it is impossible to introduce isotopically labeled Se through conventional means such as dialysis and ultrafiltration. That considerably complicates the production of isotopic spikes for IDMS to the use of synthetic peptides[Citation118] or protein biosynthesis by genetically manipulated organisms.[Citation118] Importantly, popular cell lines used for recombinant protein production, first of all yeast or bacterial cells, lack the required biochemical machinery and specific regulation mechanisms[Citation7] required to produce native selenoproteins (i.e., SECIS-binding proteins, Sec-tRNA, selenophosphate synthase, etc.). Although the replacement of Sec with Cys should considerably stabilize the resulting protein, the chemical behavior of the spike may change considerably, compared to the native selenoprotein present in the sample. Besides, due to the low redox stability of some selenoproteins, e.g., SELENOP,[Citation119] isotopic spikes should be properly tested for their storage stability even under low temperatures. These difficulties in full protein spike generation result in the use of isotopically labeled selenoamino acids as an indirect way to quantify the proteins after their digestion.[Citation111,Citation113] Notably, such an approach, at least partially, reduces the benefits of IDMS in the case of analysis of protein mixtures such as body fluids because the IDMS spike does not account for the proteolysis stage. That is especially critical if SeMet is used as a spike since it is randomly distributed in all Met-containing body proteins. Also, a preliminary protein separation and proteolysis are not accounted for by the use of selenoamino acid isotopic spikes. From this perspective, the use of authentic selenoproteins with transgenic modifications (e.g., Sec replacement with Cys or Met) may be considered a major advancement toward accuracy and traceability in IDMS measurements. The production of native selenoproteins via cell cultures or cell-free biosynthesis is highly challenging due to the necessity to reproduce a sophisticated mechanism behind Sec introduction into the proteins on the ribosome.[Citation99] The limitation here is that the use of isotopically labeled authentic selenoproteins imposes high costs even compared to other metalloproteins.
Another important problem, specific for Se-containing proteins and selenoproteins, is the problematic nature of Se as an analyte for inorganic MS by ICP-MS. Accurate and sufficiently precise measurement of isotopic ratios of Se by ICP-MS is seriously hampered by spectral interferences,[Citation119–122] which befall all 6 natural Se isotopes (74Se, 76Se, 77Se, 78Se, 80Se, and 82Se). All these isotopes are overlapping with different argon dimers and related polyatomic species in the plasma. The matrices of biological samples such as blood serum, urine, tissue, etc. may impose strong ionization interferences in the plasma and are rich in elements, which may further worsen spectral interferences for selenium. Accurate quantification of selenium requires the use of MS systems with the chemical resolution,[Citation121,Citation123] including collision/dynamic reaction cell/triple quadrupole technologies or higher resolution sector field ICP-MS for Se quantitation. Additionally, Se demonstrates low sensitivity in the ICP-MS, due to relatively high ionization energy (9.75 eV), the scatter of the sensitivity across a number of isotopes (the most abundant Se isotope 80Se has an abundance of 49.61%) and spectral interferences (first of all, Ar dimers for m/z 76, 78, and 80). With the further evolving of chemical resolution techniques as well as wider distribution of higher resolution ICP-MS equipment, we may anticipate further development in the field of accurate and traceable selenoprotein quantification.
Protein-bound xenobiotic metal elements
Xenobiotic elements are non-native to humans and are of particular interest for the study and development of metal-based therapeutics. The field remains predominated by research into the biological interactions of the platinum(II) anticancer complex, cisplatin [PtCl2(NH3)2)] though many groups are now exploring the biological properties of other metal complexes; including ruthenium, rhodium, iridium or osmium.[Citation124] Though many xenobiotic analytes have been studied by ICP-MS, only a limited number utilize IDMS. Though this may be due to the inherently low background concentrations of these analytes, which do not suffer significant polyatomic or isobaric interference, there is also a notable lack of spike materials and a considerable cost associated with enriched isotopes for the platinum group elements.
However, in some cases, enriched stable isotopes are available. In 2019, Larios et al. synthesized carboplatin and cisplatin using 194Pt to investigate adducts with Alb, Tf, and IgG by ssIDMS.[Citation125] Sera were prepared using clinically relevant concentrations of 194Pt or 195Pt carboplatin (1 mg g−1) for the spike and natural calibrant, respectively. Separations were achieved using a combination of Convective Interaction Media (CIM) monolithic disks, weak anion exchange-based disks (containing diethylamino groups) and affinity-based disks containing protein G (for the retention of IgG) coupled to ultraviolet-visible spectroscopy (UV-Vis). Complementary separation was achieve using an AF2000 series multi-flow system to characterize calibrants. Double ssIDMS achieved similar Pt-Alb LODs of 0.005 and 0.003 ng g−1 for 194Pt and 195Pt, respectively, with an average Pt recovery of 101.6 ± 2.5% and expanded uncertainty (k = 2) of 4.7%. Approximately 83% of total platinum in blood was found to be associated with plasma/serum proteins, of which 96% was bound to Alb, and the remaining 4% equally distributed between Tf and IgG.
As research efforts continue to pursue both extracellular and sub-cellular investigations of xenobiotic elements, in some cases as therapies with low-nanomolar potencies, concerns of traceability and accuracy are likely to increase. As IDMS techniques become more conventional, driven by investigations of complex analytes like sulfur, we believe IDMS will also play an important role in future xenobiotic biochemical studies, particularly as next-generation xenobiotic therapies move ever closer to clinical evaluation.
Conclusions and perspectives
Though significant efforts have been made toward greater traceability in the quantification of metalloproteins and selenoproteins, there is still a long road ahead to see the implementation of the approaches described in this review being adopted sufficiently to have a real impact. In general, there has been a tendency by instrument manufacturers and academic researchers to focus on achieving lower and lower LODs, at the expense of improvements in accuracy, precision and traceability. In clinical science, because of the often-low analyte concentration in the presence of a complex matrix, there has been a reliance on immunochemical methods to ensure suitable LODs/LOQs. However the nature of this approach results in the poorly traceable methods that are in use. In reality there is a requirement for both improved LODs/LOQs and for greater traceability. Fundamentally, the methods covered in this review fulfill this goal for the important metalloproteins discussed and can form the basis of providing better characterized and more widely impactful matrix based reference materials and standards. Subsequently these can be used as part of the traceability chain and improve the methods used in routine clinical and biomedical laboratories.
The importance of accurate quantification with its associated improvements in traceability, should also apply to researchers developing novel metallodrugs based on xenobiotic elements. Techniques including ssIDMS and suIDMS are often overlooked in this area; we believe in part due to efforts by instrumentation manufacturers to make ICP techniques accessible to a more general user group, and a lack of advanced quantitative techniques being taught in undergraduate/postgraduate programs. There also appears to be a lack of concerted effort on the part of some National Metrology Institutes, especially in relation to the availability of suitable isotopically enriched metalloprotein standards, but also the software to make the IDMS procedures more user friendly. Together these factors have resulted in fewer available standards for use in clinical diagnostics and research activities.
From a technical perspective, the analysis of the published data indicates that in the majority of cases, transmetallation approaches, e.g., isolation of the protein, leaching the native metal from its moiety using a chelator, typically followed by ultrafiltration, and reconditioning with isotopically enriched metal, are used. Transmetallation has certain limitations, notably the potential denaturation of the protein and a distinct lack of suitable characterization of the product in terms of conformation, metal binding sites, and purity. The authors of this review consider biotechnological approaches may be more suitable to afford isotopically enriched standards, especially to produce highly redox sensitive proteins such as Cp and Fer. Several studies discussed in this review describe various transmetallation approaches which did not result in suitable enriched materials or certified reference materials. Biochemically manufactured proteins do not suffer from such problems, but their design and production may be more expensive, which limits their implementation. At the same time, biotechnological production of some proteins may be very challenging due to the absence of the required biochemical machinery, e.g., selenoproteins cannot be prepared in Saccharomyces cerevisiae and other popular bioreactor cultures. However, those obstacles should not be impermeable but require more collaborative efforts from biotechnologist and analytical scientists.
| Abbreviation | ||
| AEC | = | anion exchange chromatography |
| Alb | = | human serum albumin |
| CE | = | capillary electrophoresis |
| Cp | = | ceruloplasmin |
| CRM | = | certified reference material |
| CV | = | coefficient of variation |
| Cys | = | cysteine |
| DEAE | = | diethyl aminoethyl |
| EDTA | = | ethylene diamine tetraacetic acid |
| ESI | = | electrospray ionization |
| Fer | = | ferritin |
| GPX | = | glutathione peroxidase |
| Hb | = | hemoglobin |
| HbA | = | hemoglobin A |
| HbA1c | = | hemoglobin A1c |
| HILIC | = | hydrophilic interaction liquid chromatography |
| HPLC | = | high-performance liquid chromatography |
| ICP | = | inductively coupled plasma |
| ICP-MS/MS | = | triple quadrupole inductively coupled plasma mass spectrometry |
| IDMS | = | isotope dilution mass spectrometry |
| IS | = | internal standard |
| LA | = | laser ablation |
| LC | = | liquid chromatography |
| LOD | = | limit of detection |
| LOQ | = | limit of quantification |
| Met | = | methionine |
| MS | = | mass spectrometry |
| MS/MS | = | tandem mass spectrometry |
| MALDI | = | matrix assisted laser induced desorption ionization |
| MT | = | metallothionein |
| NTA | = | nitrilotriacetic acid |
| PAGE | = | polyacrylamide gel electrophoresis |
| PMSF | = | phenylmethylsulfonyl fluoride |
| PVPP | = | polyvinylpolypyrrolidone |
| RSD | = | relative standard deviation |
| SAX | = | strong anion exchange chromatography |
| SeAlb | = | selenised albumin |
| Sec | = | selenocysteine |
| SEC | = | size exclusion chromatography |
| SDS | = | sodium dodecyl sulfate |
| SELENOP | = | selenoprotein P |
| SeMet | = | selenomethionine |
| SF | = | sector field |
| ssIDMS | = | species specific isotope dilution mass spectrometry |
| suIDMS | = | species unspecific isotope dilution mass spectrometry |
| SOD | = | super oxide dismutase |
| Tf | = | transferrin |
| TIMS | = | thermal ionization mass spectrometry |
| TMT | = | tandem mass tag |
| TOF | = | time of flight |
| Tris | = | tris(hydroxymethyl)aminoethane |
Disclosure statement
The authors report there are no competing interests to declare.
Data availability statement
There are no data association with this publication.
Additional information
Funding
References
- Hu, C.; Chan, S. I.; Sawyer, E. B.; Yu, Y.; Wang, J. Metalloprotein Design Using Genetic Code Expansion. Chem. Soc. Rev. 2014, 43, 6498–6510. DOI: 10.1039/c4cs00018h.
- Li, J.; Wu, L.; Jin, Y.; Su, P.; Yang, B.; Yang, Y. A Universal SI-Traceable Isotope Dilution Mass Spectrometry Method for Protein Quantitation in a Matrix by Tandem Mass Tag Technology. Anal. Bioanal. Chem. 2016, 408, 3485–3493. DOI: 10.1007/s00216-016-9424-0.
- Fu, D.; Finney, L. Metalloproteomics: Challenges and Prospective for Clinical Research Applications. Expert Rev. Proteomics. 2014, 11, 13–19. DOI: 10.1586/14789450.2014.876365.
- Frieden, E. Copper and Iron Metalloproteins. Trends Biochem. Sci. 1976, 1, 273–274. DOI: 10.1016/S0968-0004(76)80131-4.
- Waldron, K. J.; Rutherford, J. C.; Ford, D.; Robinson, N. J. Metalloproteins and Metal Sensing. Nature 2009, 460, 823–830. DOI: 10.1038/nature08300.
- Holley, A. K.; Bakthavatchalu, V.; Velez-Roman, J. M.; St Clair, D. K. Manganese Superoxide Dismutase: Guardian of the Powerhouse. Int. J. Mol. Sci. 2011, 12, 7114–7162. DOI: 10.3390/ijms12107114.
- Labunskyy, V. M.; Hatfield, D. L.; Gladyshev, V. N. Selenoproteins: Molecular Pathways and Physiological Roles. Physiol. Rev. 2014, 94, 739–777. DOI: 10.1152/physrev.00039.2013.
- Vesper, H. W.; Thienpont, L. M. Traceability in Laboratory Medicine. Clin. Chem. 2009, 55, 1067–1075. DOI: 10.1373/clinchem.2008.107052.
- Van Gool, A.; Corrales, F.; Čolović, M.; Krstić, D.; Oliver-Martos, B.; Martínez-Cáceres, E.; Jakasa, I.; Gajski, G.; Brun, V.; Kyriacou, K.; et al. Analytical Techniques for Multiplex Analysis of Protein Biomarkers. Expert Rev. Proteomics. 2020, 17, 257–273. DOI: 10.1080/14789450.2020.1763174.
- Vogl, J. Characterisation of Reference Materials by Isotope Dilution Mass Spectrometry. J. Anal. At. Spectrom. 2007, 22, 475. DOI: 10.1039/b614612k.
- Sargent, M.; Goenaga-Infante, H.; Inagaki, K.; Ma, L.; Meija, J.; Pramann, A.; Rienitz, O.; Sturgeon, R.; Vogl, J.; Wang, J.; Yang, L. The Role of ICP-MS in Inorganic Chemical Metrology. Metrologia 2019, 56, 034005. DOI: 10.1088/1681-7575/ab0eac.
- Sargent, M.; Harrington, C.; Harte, R. Guidelines for Achieving High Accuracy in Isotope Dilution Mass Spectrometry; Royal Society of Chemistry: Cambridge, UK, 2002.
- Vogl, J. Measurement Uncertainty in Single, Double and Triple Isotope Dilution Mass Spectrometry. Rapid Commun. Mass Spectrom. 2012, 26, 275–281. DOI: 10.1002/rcm.5306.
- Henrion, A. Reduction of Systematic Errors in Quantitative Analysis by Isotope Dilution Mass Spectrometry (IDMS): An Iterative Method. Fresenius. J. Anal. Chem. 1994, 350, 657–658. DOI: 10.1007/BF00323658.
- Catterick, T.; Fairman, B.; Harrington, C. A Structured Approach to Achieving High Accuracy Measurements with Isotope Dilution Inductively Coupled Plasma Mass Spectrometry. J. Anal. At. Spectrom. 1998, 13, 1009–1013. DOI: 10.1039/a801233d.
- Heumann, K. G.; Rottmann, L.; Vogl, J. Elemental Speciation with Liquid Chromatography-Inductively Coupled Plasma Isotope Dilution Mass Spectrometry. J. Anal. At. Spectrom. 1994, 9, 1351–1355. DOI: 10.1039/JA9940901351.
- Sutton, P.; Harrington, C.; Fairman, B.; Evans, H.; Ebdon, L.; Catterick, T. The Small-Scale Synthesis and NMR Characterisation of Isotopically Enriched Organotin Compounds. Appl. Organometal. Chem. 2000, 14, 691–700. DOI: 10.1002/1099-0739(200011)14:11<691::AID-AOC62>3.0.CO;2-L.
- Clough, R.; Belt, S.; Evans, E. H.; Sutton, P.; Fairman, B.; Catterick, T. Uncertainty Contributions to Species Specific Isotope Dilution Analysis. Part 1. Characterisation and Stability of 199Hg and13C Isotopically Enriched Methylmercury by 1H NMR. J. Anal. At. Spectrom. 2003, 18, 1033–1038. DOI: 10.1039/B302880C.
- Vogl, J.; Heumann, K. Determination of Heavy Metal Complexes with Humic Substances by HPLC/ICP-MS Coupling Using on-Line Isotope Dilution Technique. Fresenius J. Anal. Chem. 1997, 359, 438–441. DOI: 10.1007/s002160050606.
- Harrington, C.; Vidler, D.; Watts, M.; Hall, J. Potential for Using Isotopically Altered Metalloproteins in Species-Specific Isotope Dilution Analysis of Proteins by HPLC Coupled to Inductively Coupled Plasma Mass Spectrometry. Anal. Chem. 2005, 77, 4034–4041. DOI: 10.1021/ac050256t.
- Bettmer, J. Application of Isotope Dilution ICP–MS Techniques to Quantitative Proteomics. Anal. Bioanal. Chem. 2010, 397, 3495–3502. DOI: 10.1007/s00216-010-3861-y.
- Rodrıguez-Gonzalez, P.; Garcia Alonso, J. Recent Advances in Isotope Dilution Analysis for Elemental Speciation. J. Anal. At. Spectrom. 2010, 25, 239.
- Deitrich, C. L.; Raab, A.; Pioselli, B.; Thomas-Oates, J. E.; Feldmann, J. Chemical Preparation of an Isotopically Enriched Superoxide Dismutase and Its Characterization as a Standard for Species-Specific Isotope Dilution Analysis. Anal. Chem. 2007, 79, 8381–8390. DOI: 10.1021/ac071397t.
- Sargent, M. Traceability in Analytical Atomic Spectrometry: Elemental Analysis Comes Full Circle. J. Anal. At. Spectrom. 2020, 35, 2479–2486. DOI: 10.1039/D0JA00236D.
- Swart, C. HLT05 European Metrology Research Programme. Metrology for Metalloproteins - Final Project Report; PTB: Braunschweig, 2015. https://www.euramet.org/research-innovation/search-research-projects/details/project/metrology-for-metalloproteins/?tx_eurametctcp_project%5Baction%5D=show&tx_eurametctcp_project%5Bcontroller%5D=Project&cHash=18c6aa719cf6caf10c8a66f7136c9910 (accessed May 29, 2022).
- Muñoz, A.; Kral, R.; Schimmel, H. Quantification of Protein Calibrants by Amino Acid Analysis Using Isotope Dilution Mass Spectrometry. Anal. Biochem. 2011, 408, 124–131. DOI: 10.1016/j.ab.2010.08.037.
- Arsene, C. G.; Ohlendorf, R.; Burkitt, W.; Pritchard, C.; Henrion, A.; O'Connor, G.; Bunk, D. M.; Güttler, B. Protein Quantification by Isotope Dilution Mass Spectrometry of Proteolytic Fragments: Cleavage Rate and Accuracy. Anal. Chem. 2008, 80, 4154–4160. DOI: 10.1021/ac7024738.
- Mayya, V.; K. Han, D. Proteomic Applications of Protein Quantification by Isotope-Dilution Mass Spectrometry. Expert Rev. Proteomics. 2006, 3, 597–610. DOI: 10.1586/14789450.3.6.597.
- Bi, J.; Wu, L.; Yang, B.; Yang, Y.; Wang, J. Development of Hemoglobin A1c Certified Reference Material by Liquid Chromatography Isotope Dilution Mass Spectrometry. Anal. Bioanal. Chem. 2012, 403, 549–554. DOI: 10.1007/s00216-012-5834-9.
- Liu, H.; Wong, L.; Yong, S.; Liu, Q.; Lee, T. K. Achieving Comparability with IFCC Reference Method for the Measurement of Hemoglobin A1c by Use of an Improved Isotope-Dilution Mass Spectrometry Method. Anal. Bioanal. Chem. 2015, 407, 7579–7587. DOI: 10.1007/s00216-015-8961-2.
- Prange, A.; Schaumlöffel, D.; Brätter, P.; Richarz, A.-N.; Wolf, C. Species Analysis of Metallothionein Isoforms in Human Brain Cytosols by Use of Capillary Electrophoresis Hyphenated to Inductively Coupled Plasma–Sector Field Mass Spectrometry. Fresenius. J. Anal. Chem. 2001, 371, 764–774. DOI: 10.1007/s002160101019.
- Schaumlöffel, D.; Prange, A.; Marx, G.; Heumann, K. G.; Brätter, P. Characterization and Quantification of Metallothionein Isoforms by Capillary Electrophoresis–Inductively Coupled Plasma–Isotope-Dilution Mass Spectrometry. Anal. Bioanal. Chem. 2002, 372, 155–163. DOI: 10.1007/s00216-001-1164-z.
- Feng, L.; Zhang, D.; Wang, J.; Shen, D.; Li, H. A Novel Quantification Strategy of Transferrin and Albumin in Human Serum by Species-Unspecific Isotope Dilution Laser Ablation Inductively Coupled Plasma Mass Spectrometry (ICP-MS). Anal. Chim. Acta. 2015, 884, 19–25. DOI: 10.1016/j.aca.2015.05.009.
- Hermann, G.; Møller, L. H.; Gammelgaard, B.; Hohlweg, J.; Mattanovich, D.; Hann, S.; Koellensperger, G. In Vivo Synthesized 34S Enriched Amino Acid Standards for Species Specific Isotope Dilution of Proteins. J. Anal. At. Spectrom. 2016, 31, 1830–1835. DOI: 10.1039/C6JA00039H.
- Anderson, C. P.; Shen, M.; Eisenstein, R. S.; Leibold, E. A. Mammalian Iron Metabolism and Its Control by Iron Regulatory Proteins. Biochim. Biophys. Acta. 2012, 1823, 1468–1483. DOI: 10.1016/j.bbamcr.2012.05.010.
- Bilska-Wilkosz, A.; Iciek, M.; Górny, M.; Kowalczyk-Pachel, D. The Role of Hemoproteins: Hemoglobin, Myoglobin and Neuroglobin in Endogenous Thiosulfate Production Processes. Int. J. Mol. Sci. 2017, 18, 1315. DOI: 10.3390/ijms18061315.
- Johnson, D. C.; Dean, D. R.; Smith, A. D.; Johnson, M. K. Structure, Function, and Formation of Biological Iron-Sulfur Clusters. Annu. Rev. Biochem. 2005, 74, 247–281. DOI: 10.1146/annurev.biochem.74.082803.133518.
- Faller, P.; Hureau, C. A Bioinorganic View of Alzheimer’s Disease: When Misplaced Metal Ions (Re)Direct the Electrons to the Wrong Target. Chemistry 2012, 18, 15910–15920. DOI: 10.1002/chem.201202697.
- Thompson, J. W.; Bruick, R. K. Protein Degradation and Iron Homeostasis. Biochim. Biophys. Acta. 2012, 1823, 1484–1490. DOI: 10.1016/j.bbamcr.2012.02.003.
- Sousa, L.; Oliveira, M. M.; Pessôa, M. T. C.; Barbosa, L. A. Iron Overload: Effects on Cellular Biochemistry. Clin. Chim. Acta. 2020, 504, 180–189. DOI: 10.1016/j.cca.2019.11.029.
- Philpott, C. C.; Jadhav, S. The Ins and Outs of Iron: Escorting Iron through the Mammalian Cytosol. Free Radic. Biol. Med. 2019, 133, 112–117. DOI: 10.1016/j.freeradbiomed.2018.10.411.
- Hider, R. C.; Kong, X. Iron Speciation in the Cytosol: An Overview. Dalton Trans. 2013, 42, 3220–3229. DOI: 10.1039/c2dt32149a.
- Joppe, K.; Roser, A.-E.; Maass, F.; Lingor, P. The Contribution of Iron to Protein Aggregation Disorders in the Central Nervous System. Front. Neurosci. 2019, 13, 15. DOI: 10.3389/fnins.2019.00015.
- Swart, C. Metrology for Metalloproteins–Where Are we Now, Where Are we Heading? Anal. Bioanal. Chem. 2013, 405, 5697–5723. DOI: 10.1007/s00216-013-6933-y.
- Michalke, B.; Willkommen, D.; Drobyshev, E.; Solovyev, N. The Importance of Speciation Analysis in Neurodegeneration Research. Trends Anal. Chem. 2018, 104, 160–170. DOI: 10.1016/j.trac.2017.08.008.
- Silva, A. M. N.; Moniz, T.; de Castro, B.; Rangel, M. Human Transferrin: An Inorganic Biochemistry Perspective. Coord. Chem. Rev. 2021, 449, 214186. DOI: 10.1016/j.ccr.2021.214186.
- Feng, L.; Zhang, D.; Wang, J.; Li, H. Simultaneous Quantification of Proteins in Human Serum via Sulfur and Iron Using HPLC Coupled to Post-Column Isotope Dilution Mass Spectrometry. Anal. Methods. 2014, 6, 7655–7662. DOI: 10.1039/C4AY00907J.
- Bortolotti, F.; Paoli, G. D.; Tagliaro, F. Carbohydrate-Deficient Transferrin (CDT) as a Marker of Alcohol Abuse: A Critical Review of the Literature 2001–2005. J. Chromatogr. B Analyt. Technol. Biomed. Life Sci. 2006, 841, 96–109. DOI: 10.1016/j.jchromb.2006.05.005.
- Jou, Y.-J.; Lin, C.-D.; Lai, C.-H.; Chen, C.-H.; Kao, J.-Y.; Chen, S.-Y.; Tsai, M.-H.; Huang, S.-H.; Lin, C.-W. Proteomic Identification of Salivary Transferrin as a Biomarker for Early Detection of Oral Cancer. Anal. Chim. Acta. 2010, 681, 41–48. DOI: 10.1016/j.aca.2010.09.030.
- Babovic-Vuksanovic, D.; O'Brien, J. F. Laboratory Diagnosis of Congenital Disorders of Glycosylation Type I by Analysis of Transferrin Glycoforms. Mol. Diagn. Ther. 2007, 11, 303–311. DOI: 10.1007/BF03256251.
- del Castillo Busto, M. E.; Montes-Bayón, M.; Sanz-Medel, A. Accurate Determination of Human Serum Transferrin Isoforms: Exploring Metal-Specific Isotope Dilution Analysis as a Quantitative Proteomic Tool. Anal. Chem. 2006, 78, 8218–8226. DOI: 10.1021/ac060956d.
- Konz, I.; Fernández, B.; Fernández, M. L.; Pereiro, R.; Sanz-Medel, A. Absolute Quantification of Human Serum Transferrin by Species-Specific Isotope Dilution Laser Ablation ICP-MS. Anal. Chem. 2011, 83, 5353–5360. DOI: 10.1021/ac200780b.
- Frank, C.; Rienitz, O.; Jahrling, R.; Schiel, D.; Zakel, S. Reference Measurement Procedures for the Iron Saturation in Human Transferrin Based on IDMS and Raman Scattering. Metallomics 2012, 4, 1239–1244. DOI: 10.1039/c2mt20183f.
- Frank, C.; Rienitz, O.; Swart, C.; Schiel, D. Improving Species-Specific IDMS: The Advantages of Triple IDMS. Anal. Bioanal. Chem. 2013, 405, 1913–1919. DOI: 10.1007/s00216-012-6315-x.
- Brauckmann, C.; Pramann, A.; Rienitz, O.; Schulze, A.; Phukphatthanachai, P.; Vogl, J. Combining Isotope Dilution and Standard Addition-Elemental Analysis in Complex Samples. Molecules 2021, 26, 2649. DOI: 10.3390/molecules26092649.
- Lynch, S.; Pfeiffer, C. M.; Georgieff, M. K.; Brittenham, G.; Fairweather-Tait, S.; Hurrell, R. F.; McArdle, H. J.; Raiten, D. J. Biomarkers of Nutrition for Development (BOND)—Iron Review. J. Nutr. 2018, 148, 1001S–1067S. DOI: 10.1093/jn/nxx036.
- Massover, W. H. Ultrastructure of Ferritin and Apoferritin: A Review. Micron 1993, 24, 389–437. DOI: 10.1016/0968-4328(93)90005-L.
- Konz, T.; Anon Alvarez, E.; Montes-Bayon, M.; Sanz-Medel, A. Antibody Labeling and Elemental Mass Spectrometry (Inductively Coupled Plasma-Mass Spectrometry) Using Isotope Dilution for Highly Sensitive Ferritin Determination and Iron-Ferritin Ratio Measurements. Anal. Chem. 2013, 85, 8334–8340. DOI: 10.1021/ac401692k.
- Yang, D.; Ng, X. Q.; Walczyk, T. Quantification of Non-Transferrin Bound Iron (NTBI) in Human Serum by Isotope Dilution Mass Spectrometry (IDMS). J. Anal. At. Spectrom. 2019, 34, 1988–1997. DOI: 10.1039/C9JA00142E.
- Hoppler, M.; Zeder, C.; Walczyk, T. Quantification of Ferritin-Bound Iron in Plant Samples by Isotope Tagging and Species-Specific Isotope Dilution Mass Spectrometry. Anal. Chem. 2009, 81, 7368–7372. DOI: 10.1021/ac900885j.
- Hoppler, M.; Meile, L.; Walczyk, T. Biosynthesis, Isolation and Characterization of 57Fe-Enriched Phaseolus vulgaris Ferritin after Heterologous Expression in Escherichia coli. Anal. Bioanal. Chem. 2008, 390, 53–59. DOI: 10.1007/s00216-007-1691-3.
- Ren, Y.; Walczyk, T. Quantification of Ferritin Bound Iron in Human Serum Using Species-Specific Isotope Dilution Mass Spectrometry. Metallomics 2014, 6, 1709–1717. DOI: 10.1039/c4mt00127c.
- Konz, I.; Fernández, B.; Fernández, M. L.; Pereiro, R.; Sanz-Medel, A. Laser Ablation ICP-MS for Quantitative Biomedical Applications. Anal. Bioanal. Chem. 2012, 403, 2113–2125. DOI: 10.1007/s00216-012-6023-6.
- Calderon-Celis, F.; Encinar, J. R.; Sanz-Medel, A. Standardization Approaches in Absolute Quantitative Proteomics with Mass Spectrometry. Mass Spectrom. Rev. 2018, 37, 715–737. DOI: 10.1002/mas.21542.
- Kretschy, D.; Koellensperger, G.; Hann, S. Elemental Labelling Combined with Liquid Chromatography Inductively Coupled Plasma Mass Spectrometry for Quantification of Biomolecules: A Review. Anal. Chim. Acta. 2012, 750, 98–110. DOI: 10.1016/j.aca.2012.06.040.
- Tchaikovsky, A.; Schoeberl, A.; Schueffl, H.; Raab, A.; Emin, S.; Slany, A.; Heffeter, P.; Koellensperger, G.; Swart, C. Quantification of Ferritin-Bound Iron in Murine Samples for Alzheimer’s Disease Studies Using Species-Specific Isotope Dilution Mass Spectrometry. Metrologia 2020, 57, 042101. DOI: 10.1088/1681-7575/ab8c9f.
- Hsia, C. C. W. Respiratory Function of Hemoglobin. N. Engl. J. Med. 1998, 338, 239–247. DOI: 10.1056/NEJM199801223380407.
- Akinsheye, I.; Alsultan, A.; Solovieff, N.; Ngo, D.; Baldwin, C. T.; Sebastiani, P.; Chui, D. H. K.; Steinberg, M. H. Fetal Hemoglobin in Sickle Cell Anemia. Blood 2011, 118, 19–27. DOI: 10.1182/blood-2011-03-325258.
- Soros, A. A.; Chalew, S. A.; McCarter, R. J.; Shepard, R.; Hempe, J. M. Hemoglobin Glycation Index: A Robust Measure of Hemoglobin A1c Bias in Pediatric Type 1 Diabetes Patients. Pediatr. Diabetes. 2010, 11, 455–461. DOI: 10.1111/j.1399-5448.2009.00630.x.
- del Castillo Busto, M. E.; Montes-Bayón, M.; Añón, E.; Sanz-Medel, A. Simultaneous Determination of Glycated Haemoglobin, a Long Term Biomarker of Diabetes Mellitus, and Total Haemoglobin by Isotope Dilution and HPLC-ICP-MS. J. Anal. At. Spectrom. 2008, 23, 758. DOI: 10.1039/b718008j.
- Heuck, C. C.; Reinauer, H.; Wood, W. G. The Alkaline Haematin Detergent (AHD575) Method for the Determination of Haemoglobin in Blood–A Candidate Reference Measurement Procedure. Clin. Lab. 2008, 54, 255–272.
- Wolf, H. U.; Lang, W.; Zander, R. Alkaline Haematin D-575, a New Tool for the Determination of Haemoglobin as an Alternative to the Cyanhaemiglobin Method. II. Standardisation of the Method Using Pure Chlorohaemin. Clin. Chim. Acta. 1984, 136, 95–104. DOI: 10.1016/0009-8981(84)90251-1.
- Frank, C.; Brauckmann, C.; Palos, M.; Arsene, C. G.; Neukammer, J.; Del Castillo Busto, M. E.; Zakel, S.; Swart, C.; Guttler, B.; Stosch, R. Comparison of Potential Higher Order Reference Methods for Total Haemoglobin Quantification-An Interlaboratory Study. Anal. Bioanal. Chem. 2017, 409, 2341–2351. DOI: 10.1007/s00216-016-0176-7.
- Brauckmann, C.; Frank, C.; Schulze, D.; Kaiser, P.; Stosch, R.; Swart, C. Preparation and Characterisation of an 57Fe Enriched Haemoglobin Spike Material for Species-Specific Isotope Dilution Mass Spectrometry. J. Anal. At. Spectrom. 2016, 31, 1846–1857. DOI: 10.1039/C6JA00028B.
- Hellman, N. E.; Gitlin, J. D. Ceruloplasmin Metabolism and Function. Annu. Rev. Nutr. 2002, 22, 439–458. DOI: 10.1146/annurev.nutr.22.012502.114457.
- Deitrich, C. L.; Braukmann, S.; Raab, A.; Munro, C.; Pioselli, B.; Krupp, E. M.; Thomas-Oates, J. E.; Feldmann, J. Absolute Quantification of Superoxide Dismutase (SOD) Using Species-Specific Isotope Dilution Analysis. Anal. Bioanal. Chem. 2010, 397, 3515–3524. DOI: 10.1007/s00216-010-3680-1.
- Gleitzmann, J.; Raab, A.; Schulze, D.; Wätzig, H.; Feldmann, J.; Swart, C. Accurate and Precise Quantification of Cu,Zn-SOD in Human Red Blood Cells Using Species-Specific Double and Triple IDMS. J. Anal. At. Spectrom. 2016, 31, 1922–1928. DOI: 10.1039/C5JA00459D.
- Ziller, A.; Fraissinet-Tachet, L. Metallothionein Diversity and Distribution in the Tree of Life: A Multifunctional Protein. Metallomics 2018, 10, 1549–1559. DOI: 10.1039/c8mt00165k.
- Ryvolova, M.; Krizkova, S.; Adam, V.; Beklova, M.; Trnkova, L.; Hubalek, J.; Kizek, R. Analytical Methods for Metallothionein Detection. CAC. 2011, 7, 243–261. DOI: 10.2174/1573411011107030243.
- Alvarez, L.; Gonzalez-Iglesias, H.; Garcia, M.; Ghosh, S.; Sanz-Medel, A.; Coca-Prados, M. The Stoichiometric Transition from Zn6Cu1-Metallothionein to Zn7-Metallothionein Underlies the up-Regulation of Metallothionein (MT) Expression: Quantitative Analysis of MT-Metal Load in Eye Cells. J. Biol. Chem. 2012, 287, 28456–28469. DOI: 10.1074/jbc.M112.365015.
- Rodriguez-Menendez, S.; Fernandez, B.; Garcia, M.; Alvarez, L.; Fernandez, M. L.; Sanz-Medel, A.; Coca-Prados, M.; Pereiro, R.; Gonzalez-Iglesias, H. Quantitative Study of Zinc and Metallothioneins in the Human Retina and RPE Cells by Mass Spectrometry-Based Methodologies. Talanta 2018, 178, 222–230. DOI: 10.1016/j.talanta.2017.09.024.
- Timerbaev, A. R. Capillary Electrophoresis Coupled to Mass Spectrometry for Biospeciation Analysis: Critical Evaluation. Trends Anal. Chem. 2009, 28, 416–425. DOI: 10.1016/j.trac.2009.02.001.
- Solovyev, N.; Ala, A.; Schilsky, M.; Mills, C.; Willis, K.; Harrington, C. F. Biomedical Copper Speciation in Relation to Wilson’s Disease Using Strong Anion Exchange Chromatography Coupled to Triple Quadrupole Inductively Coupled Plasma Mass Spectrometry. Anal. Chim. Acta. 2020, 1098, 27–36. DOI: 10.1016/j.aca.2019.11.033.
- Ala, A.; Walker, A. P.; Ashkan, K.; Dooley, J. S.; Schilsky, M. L. Wilson’s Disease. Lancet 2007, 369, 397–408. DOI: 10.1016/S0140-6736(07)60196-2.
- Del Castillo Busto, M. E.; Cuello-Nunez, S.; Ward-Deitrich, C.; Morley, T.; Goenaga-Infante, H. A Fit-for-Purpose Copper Speciation Method for the Determination of Exchangeable Copper Relevant to Wilson’s Disease. Anal. Bioanal. Chem. 2022, 414, 561–573. DOI: 10.1007/s00216-021-03517-y.
- Hadaszadeh, B. M.; Beggs, A. H. Selenoproteins and Their Impact on Human Health through Diverse Physiological Pathways. Physiology (Bethesda) 2006, 21, 307–315. DOI: 10.1152/physiol.00021.2006.
- Youn, H. S.; Lim, H. J.; Choi, Y. J.; Lee, J. Y.; Lee, M. Y.; Ryu, J. H. Selenium Suppresses the Activation of Transcription Factor NF-Kappa B and IRF3 Induced by TLR3 or TLR4 Agonists. Int. Immunopharmacol. 2008, 8, 495–501. DOI: 10.1016/j.intimp.2007.12.008.
- Tondo, M.; Moreno, J.; Casado, M.; Brandi, N.; Sierra, C.; Vilaseca, M. A.; Ormazabal, A.; Artuch, R. Selenium Concentration in Cerebrospinal Fluid Samples from a Paediatric Population. Neurochem. Res. 2010, 35, 1290–1293. DOI: 10.1007/s11064-010-0182-7.
- Schomburg, L. Selenium, Selenoproteins and the Thyroid Gland: Interactions in Health and Disease. Nat. Rev. Endocrinol. 2011, 8, 160–171. DOI: 10.1038/nrendo.2011.174.
- Solovyev, N.; Drobyshev, E.; Blume, B.; Michalke, B. Selenium at the Neural Barriers: A Review. Front. Neurosci. 2021, 15, 630016. DOI: 10.3389/fnins.2021.630016.
- Rayman, M. P. Selenium and Human Health. Lancet 2012, 379, 1256–1268. DOI: 10.1016/S0140-6736(11)61452-9.
- Vinceti, M.; Mandrioli, J.; Borella, P.; Michalke, B.; Tsatsakis, A.; Finkelstein, Y. Selenium Neurotoxicity in Humans: Bridging Laboratory and Epidemiologic Studies. Toxicol. Lett. 2014, 230, 295–303. DOI: 10.1016/j.toxlet.2013.11.016.
- Weekley, C. M.; Harris, H. H. Which Form Is That? The Importance of Selenium Speciation and Metabolism in the Prevention and Treatment of Disease. Chem. Soc. Rev. 2013, 42, 8870–8894. DOI: 10.1039/c3cs60272a.
- Ingold, I.; Berndt, C.; Schmitt, S.; Doll, S.; Poschmann, G.; Buday, K.; Roveri, A.; Peng, X.; Porto Freitas, F.; Seibt, T.; et al. Selenium Utilization by GPX4 is Required to Prevent Hydroperoxide-Induced Ferroptosis. Cell 2018, 172, 409–422.e21. DOI: 10.1016/j.cell.2017.11.048.
- Stadtman, T. C. Selenocysteine. Annu. Rev. Biochem. 1996, 65, 83–100. DOI: 10.1146/annurev.bi.65.070196.000503.
- Arner, E. S. Selenoproteins-What Unique Properties Can Arise with Selenocysteine in Place of Cysteine? Exp. Cell. Res. 2010, 316, 1296.
- Savaskan, N. E.; Brauer, A. U.; Kuhbacher, M.; Eyupoglu, I. Y.; Kyriakopoulos, A.; Ninnemann, O.; Behne, D.; Nitsch, R. Selenium Deficiency Increases Susceptibility to Glutamate-Induced Excitotoxicity. FASEB J. 2003, 17, 112–114. DOI: 10.1096/fj.02-0067fje.
- Zhang, S.; Rocourt, C.; Cheng, W. H. Selenoproteins and the Aging Brain. Mech. Ageing Dev. 2010, 131, 253–260. DOI: 10.1016/j.mad.2010.02.006.
- Solovyev, N. D. Importance of Selenium and Selenoprotein for Brain Function: From Antioxidant Protection to Neuronal Signalling. J. Inorg. Biochem. 2015, 153, 1–12. DOI: 10.1016/j.jinorgbio.2015.09.003.
- Kryukov, G. V.; Castellano, S.; Novoselov, S. V.; Lobanov, A. V.; Zehtab, O.; Guigo, R.; Gladyshev, V. N. Characterization of Mammalian Selenoproteomes. Science 2003, 300, 1439–1443. DOI: 10.1126/science.1083516.
- Weekley, C. M.; Aitken, J. B.; Vogt, S.; Finney, L. A.; Paterson, D. J.; de Jonge, M. D.; Howard, D. L.; Musgrave, I. F.; Harris, H. H. Uptake, Distribution, and Speciation of Selenoamino Acids by Human Cancer Cells: X-Ray Absorption and Fluorescence Methods. Biochemistry 2011, 50, 1641–1650. DOI: 10.1021/bi101678a.
- Gammelgaard, B.; Gabel-Jensen, C.; Sturup, S.; Hansen, H. R. Complementary Use of Molecular and Element-Specific Mass Spectrometry for Identification of Selenium Compounds Related to Human Selenium Metabolism. Anal. Bioanal. Chem. 2008, 390, 1691–1706. DOI: 10.1007/s00216-007-1788-8.
- Köhrl, J.; Brigelius-Flohé, R.; Böck, A.; Gärtner, R.; Meyer, O.; Flohé, L. Selenium in Biology: Facts and Medical Perspectives. Biol. Chem. 2000, 381, 849–864.
- Combs, G. F. Jr., Biomarkers of Selenium Status. Nutrients 2015, 7, 2209–2236. DOI: 10.3390/nu7042209.
- Brigelius-Flohe, R.; Flohe, L. Selenium and Redox Signaling. Arch. Biochem. Biophys. 2017, 617, 48.
- Solovyev, N. Selenoprotein P and Its Potential Role in Alzheimer’s Disease. Hormones (Athens) 2020, 19, 73–79. DOI: 10.1007/s42000-019-00112-w.
- Brigelius-Flohe, R.; Maiorino, M. Glutathione Peroxidases. Biochim. Biophys. Acta. 2013, 1830, 3289–3303. DOI: 10.1016/j.bbagen.2012.11.020.
- Steinbrenner, H.; Brigelius-Flohé, R. Das Essenzielle Spurenelement Selen: Selenbedarf in Gesundheit Und Krankheit. Aktuel. Ernahrungsmed. 2015, 40, 368–378. DOI: 10.1055/s-0035-1552774.
- Solovyev, N.; Drobyshev, E.; Bjørklund, G.; Dubrovskii, Y.; Lysiuk, R.; Rayman, M. P. Selenium, Selenoprotein P, and Alzheimer’s Disease: Is There a Link? Free Radic. Biol. Med. 2018, 127, 124–133. DOI: 10.1016/j.freeradbiomed.2018.02.030.
- Burk, R. F.; Hill, K. E. Selenoprotein P-Expression, Functions, and Roles in Mammals. Biochim. Biophys. Acta. 2009, 1790, 1441–1447. DOI: 10.1016/j.bbagen.2009.03.026.
- Encinar, J. R.; Schaumlöffel, D.; Ogra, Y.; Lobinski, R. Determination of Selenomethionine and Selenocysteine in Human Serum Using Speciated Isotope Dilution-Capillary HPLC − Inductively Coupled Plasma Collision Cell Mass Spectrometry. Anal. Chem. 2004, 76, 6635–6642. DOI: 10.1021/ac049280h.
- Jitaru, P.; Goenaga-Infante, H.; Vaslin-Reimann, S.; Fisicaro, P. A Systematic Approach to the Accurate Quantification of Selenium in Serum Selenoalbumin by HPLC-ICP-MS. Anal. Chim. Acta. 2010, 657, 100–107. DOI: 10.1016/j.aca.2009.10.037.
- Gómez-Espina, J.; Blanco-González, E.; Montes-Bayón, M.; Sanz-Medel, A. Elemental Mass Spectrometry for Se-Dependent Glutathione Peroxidase Determination in Red Blood Cells as Oxidative Stress Biomarker. J. Anal. At. Spectrom. 2012, 27, 1949. DOI: 10.1039/c2ja30115f.
- Lobanov, A. V.; Hatfield, D. L.; Gladyshev, V. N. Eukaryotic Selenoproteins and Selenoproteomes. Biochim. Biophys. Acta. 2009, 1790, 1424–1428. DOI: 10.1016/j.bbagen.2009.05.014.
- Schweizer, U.; Schomburg, L.; Köhrle, J. Selenoprotein P and Selenium Distribution in Mammals. In Selenium: Its Molecular Biology and Role in Human Health, 4th ed.; Hatfield, D.L., Schweizer, U., Tsuji, P.A., Gladyshev, V.N. Eds.; Springer International Publishing: Cham, 2016; pp. 261.
- Chen, J.; Berry, M. J. Selenium and Selenoproteins in the Brain and Brain Diseases. J. Neurochem. 2003, 86, 1–12. DOI: 10.1046/j.1471-4159.2003.01854.x.
- Deitrich, C.L.; Cuello-Nuñez, S.; Kmiotek, D.; Torma, F.A.; del Castillo Busto, M.E.; Fisicaro, P.; Goenaga-Infante, H. Accurate Quantification of Selenoprotein P (SEPP1) in Plasma Using Isotopically Enriched Seleno-peptides and Species-Specific Isotope Dilution with HPLC Coupled to ICP-MS/MS. Analytical Chemistry, 2016, 88, 6357–6365. DOI: 10.1021/acs.analchem.6b00715
- Castillo Busto, M. E. d.; Oster, C.; Cuello-Nuñez, S.; Deitrich, C. L.; Raab, A.; Konopka, A.; Lehmann, W. D.; Goenaga-Infante, H.; Fisicaro, P. Accurate Quantification of Selenoproteins in Human Plasma/Serum by Isotope Dilution ICP-MS: Focus on Selenoprotein P. J. Anal. At. Spectrom. 2016, 31, 1904–1912. DOI: 10.1039/C6JA00122J.
- Solovyev, N.; Berthele, A.; Michalke, B. Selenium Speciation in Paired Serum and Cerebrospinal Fluid Samples. Anal. Bioanal. Chem. 2013, 405, 1875–1884. DOI: 10.1007/s00216-012-6294-y.
- Featherstone, A. M.; Townsend, A. T.; Jacobson, G. A.; Peterson, G. M. Comparison of Methods for the Determination of Total Selenium in Plasma by Magnetic Sector Inductively Coupled Plasma Mass Spectrometry. Anal. Chim. Acta. 2004, 512, 319–327. DOI: 10.1016/j.aca.2004.02.058.
- Elwaer, N.; Hintelmann, H. Comparing the Precision of Selenium Isotope Ratio Measurements Using Collision Cell and Sector Field Inductively Coupled Plasma Mass Spectrometry. Talanta 2008, 75, 205–214. DOI: 10.1016/j.talanta.2007.10.046.
- Solovyev, N.; Vanhaecke, F.; Michalke, B. Selenium and Iodine in Diabetes Mellitus with a Focus on the Interplay and Speciation of the Elements. J. Trace Elem. Med. Biol. 2019, 56, 69–80. DOI: 10.1016/j.jtemb.2019.07.005.
- Bolea-Fernandez, E.; Balcaen, L.; Resano, M.; Vanhaecke, F. Interference-Free Determination of Ultra-Trace Concentrations of Arsenic and Selenium Using Methyl Fluoride as a Reaction Gas in ICP-MS/MS. Anal. Bioanal. Chem. 2015, 407, 919–929. DOI: 10.1007/s00216-014-8195-8.
- Carter, O. W. L.; Xu, Y.; Sadler, P. J. Minerals in Biology and Medicine. RSC Adv. 2021, 11, 1939–1951. DOI: 10.1039/d0ra09992a.
- Larios, R.; Del Castillo Busto, M. E.; Garcia-Sar, D.; Ward-Deitrich, C.; Goenaga-Infante, H. Accurate Quantification of Carboplatin Adducts with Serum Proteins by Monolithic Chromatography Coupled to ICPMS with Isotope Dilution Analysis. J. Anal. At. Spectrom. 2019, 34, 729–740. DOI: 10.1039/C8JA00409A.