
Abstract
Prior to 1985 the Food and Agriculture Organization (FAO) estimated global food crop contamination with mycotoxins to be 25%. The origin of this statement is largely unknown. To assess the rationale for it, the relevant literature was reviewed and data of around 500,000 analyses from the European Food Safety Authority and large global survey for aflatoxins, fumonisins, deoxynivalenol, T-2 and HT-2 toxins, zearalenone and ochratoxin A in cereals and nuts were examined. Using different thresholds, i.e. limit of detection, the lower and upper regulatory limits of European Union (EU) legislation and Codex Alimentarius standards, the mycotoxin occurrence was estimated. Impact of different aspects on uncertainty of the occurrence estimates presented in literature and related to our results are critically discussed. Current mycotoxin occurrence above the EU and Codex limits appears to confirm the FAO 25% estimate, while this figure greatly underestimates the occurrence above the detectable levels (up to 60–80%). The high occurrence is likely explained by a combination of the improved sensitivity of analytical methods and impact of climate change. It is of immense importance that the detectable levels are not overlooked as through diets, humans are exposed to mycotoxin mixtures which can induce combined adverse health effects.
Introduction
Occurrence of mycotoxins is widespread throughout the world. Their acute and chronic dietary exposures can induce a variety of adverse health effects in humans and animals, making these chemically diverse substances highly relevant agricultural contaminants. They typically co-occur in agricultural crops and through diversified diets, exposure to mixtures of mycotoxins is common. Many fungal species produce them as a defense against their changing environmental growing conditions; Aspergillus, Fusarium and Penicillium regarded as the most important producers. Despite many years of research, and the introduction of good agricultural and manufacturing practices in the food chain, mycotoxin occurrence remains to be a global problem. Significant economic losses are associated with the impact of mycotoxins on human health, animal welfare and productivity, and both domestic and international trade (Pitt and Miller Citation2017; Wu and Mitchell Citation2016). Combined toxicological effects from the mycotoxin co-exposure are increasingly studied (Alassane-Kpembi et al. Citation2017; Grenier and Oswald Citation2011; EFSA Citation2016, Citation2017a, Citation2017b, Citation2017c, Citation2017d, Citation2018a, Citation2018b; JECFA Citation2011; Lee and Ryu Citation2017). Currently, aflatoxins (AFs), deoxynivalenol (DON), T-2 toxin (T-2), HT-2 toxin (HT-2), zearalenone (ZEN), fumonisins (FBs), ochratoxin A (OTA), ergot alkaloids (EAs), patulin and citrinin are considered to be the mycotoxins of the greatest importance from food safety and regulatory viewpoints. This is evident not only because of the large number of published research, and the many international and national toxicity and exposure assessment reports, but also due to the extensive standards and legislation, which have been in place for many years to safeguard public and animal health at the world, European Union (EU) and national levels (Eskola et al. Citation2018; EUR-Lex Citation2018; WHO Citation2018).
AFs B1, B2, G1, G2 and M1 can be regarded as the most important mycotoxins owing to their genotoxic carcinogenic properties. In fact, AFs are amongst the most potent mutagenic and carcinogenic substances known. AFB1 is the most potent followed by AFG1 and AFM1 (JECFA Citation1999, Citation2017). The chronic AF-exposure induces liver cancer, infections and growth impairment in humans, while high exposures cause acute symptoms, even a death (EFSA Citation2004a, Citation2007, Citation2012a, Citation2018c; IARC Citation1993, Citation2002, Citation2012, Citation2015; JECFA Citation1997, Citation1998, Citation1999, Citation2002, Citation2008, Citation2017). Sterigmatocystin, a genotoxic-carcinogen, shares its biosynthetic pathway with aflatoxins and has the same target organ (liver) with AFB1 (JECFA Citation2018). Cereals and different types of nuts and their products are the main exposure sources. The contribution of maize, peanuts, rice, sorghum and wheat each make more than 10% to the global exposure to AFs (JECFA Citation2017). The AFB1-metabolite AFM1 may be present in milk (EFSA Citation2004a, Citation2007; IARC Citation2002; JECFA Citation1997, Citation1999; Shephard Citation2008). Co-exposure to genotoxic AFB1 and FBs, which may induce regenerative cell proliferation, is of health concern, but due to the marked differences in their modes of action the combined effects are unlikely additive (IARC Citation2015; JECFA Citation2012, Citation2017). Of the FB-analogues, FB1 is the most predominant, comprising about 70% of the total FB-contamination. FB2 and FB3 co-occur with FB1 but with lower concentrations (IARC Citation2015; JECFA Citation2012, Citation2017). Oral exposure to FBs induces a wide range of adverse effects, with notable species differences (Deepa and Sreenivasa Citation2017; EFSA Citation2005a, Citation2014, Citation2018a; IARC Citation2002, Citation2015; JECFA Citation2001, Citation2002, Citation2012, Citation2017; WHO Citation2000). Liver is the target organ for FB-mediated toxicity in mice and kidney in rats, while in horses equine leukoencephalomalacia and in pigs porcine pulmonary edema with signs of liver toxicity can occur. FB1, FB2, FB3 and FB4 and their modified forms have similar toxicological profiles, but the potencies of the modified forms are lower (EFSA Citation2018a). FB1 is possibly carcinogenic to humans, and an association between chronic dietary exposure and human esophageal and liver cancer has been claimed, but causality has not been confirmed (EFSA Citation2018a; IARC Citation2002; JECFA Citation2001, Citation2012, Citation2017).
DON occurs in cereal grains alone or in combination with its most relevant forms 3-acetyl-DON, 15-acetyl-DON and DON-3-glucoside (10–20% of the DON-levels) (EFSA Citation2011, Citation2017d; JECFA Citation2001, Citation2011; McCormick et al. Citation2011; Nathanail et al. Citation2015; Vanheule et al. Citation2014). The exposure is mainly from cereals and cereal-based foods, wheat making the highest proportion (56–100%) (EFSA Citation2004b, Citation2011, Citation2017d; JECFA Citation2001, Citation2011). High exposure mediates acute gastrointestinal symptoms in humans (e.g. vomiting) but the effects from the chronic human exposure are unknown (EFSA Citation2004b, Citation2011, Citation2017d; IARC Citation1993; JECFA Citation2001, Citation2011; SCF Citation1999). Weight gain suppression and anorexia are the most common chronic effects in animals (JECFA Citation2001, Citation2011; EFSA Citation2017d). T-2 and HT-2 are also regularly found in cereal grains, but with lower frequency and levels than DON. Their chronic exposure induces general toxicity, hemato- and immunotoxicity and high exposure vomiting in animals (EFSA Citation2011, Citation2017b). Both DON and T-2 appear not to be carcinogenic (EFSA Citation2011, Citation2017b, Citation2017d; IARC Citation1993; JECFA Citation2002). ZEN is a common contaminant in maize and other grains making the cereal-based food its main source of exposure (EFSA Citation2011, Citation2014, Citation2016, Citation2017c; JECFA Citation2000; Nathanail et al. Citation2015; Vanheule et al. Citation2014). Female pigs are the most sensitive species (including human) towards its estrogenic activity (EFSA Citation2011, Citation2014, Citation2016, Citation2017c; IARC Citation1993; JECFA Citation2000; SCF Citation2000a). Relative estrogenic potencies show that some modified ZEN forms are markedly more estrogenic than ZEN itself (EFSA Citation2016). No definite link of a high ZEN-exposure with negative health effects in humans has been concluded. Nor ZEN was classifiable as to its carcinogenicity in humans, although some data are available (EFSA Citation2011, Citation2017c; IARC Citation1993).
Although OTA is present in variety of foods (e.g. cereals, pulses, coffee beans, grapes, cacao beans, nuts, spices and animal-based foods), 60% of its total exposure is from cereals (EFSA Citation2006; IARC Citation1983, Citation1993; JECFA Citation1996, Citation2001, Citation2007, Citation2008; Marin et al., Citation2013). Kidney is the main target, OTA exposure exhibiting nephrotoxicity in animals (EFSA Citation2006; IARC Citation1983, Citation1993; JECFA Citation1996, Citation2001, Citation2007, Citation2008). Species-differences exist and pigs, poultry and dogs seem to be the most sensitive (EFSA Citation2004c, Citation2006; JECFA Citation1996, Citation2001, Citation2002, Citation2007, Citation2008). The causality of OTA inducing human nephropathy remains unclear but OTA appears to be one cause of the endemic Balkan nephropathy (Bui-Klimke and Wu Citation2014; EFSA Citation2006, Citation2010; JECFA Citation1996, Citation2001, Citation2002, Citation2007, Citation2008; Stiborová et al. Citation2016). In rodents OTA is a potent renal carcinogen, and it is possibly carcinogenic to humans (IARC Citation1993). Other regulated mycotoxins are patulin, EAs and citrinin, but based on the published assessments and other relevant data they appear to be less relevant from the food safety viewpoint (Diana Di Mavungu et al. Citation2011; EC Citation2006a; EFSA Citation2005b, Citation2012b, Citation2012c, Citation2017e; FDA Citation2001a; IARC Citation1986; Iqbal et al. Citation2018; JECFA Citation1996; Krska and Crews Citation2008; López Sánchez et al. Citation2017; Mornar et al. Citation2013; Pleadin et al. Citation2018; Puel et al. Citation2010; SCF Citation2000b; SCOOP Citation2002; Topi et al. Citation2017; WHO Citation1990). There are also several mycotoxins not included in any legislation or standards due to their apparent minor relevance (Eskola et al, Citation2018; JECFA Citation2017; WHO Citation1990). These mycotoxins are excluded from this paper.
Widely cited estimate of 25% world’s food crops contaminated with mycotoxins
Over the years, published mycotoxin papers and reports have aimed at estimating the overall global prevalence of mycotoxins in agricultural crops. In this context, authors have often referred to an estimate of 25%, supposedly by Food and Agriculture Organization (FAO), published by Park and coauthors in the FAO Food, Nutrition and Agriculture Journal, number 23 in 1999. The second sentence states that ‘According to FAO, at least 25 percent of the world’s food crops are contaminated with mycotoxins, at a time when the production of agricultural commodities is barely sustaining the increasing population (Boutrif and Canet Citation1998)’. However, further evidence of the background for the figure of 25% is not provided by Park et al. (Citation1999). Looking more in detail into the paper by Boutrif and Canet (Citation1998) published in Revue de médecine vétérinaire, to which Park et al. (Citation1999) refers, no figure or mention of 25% of food crops contaminated with mycotoxins can be found in this paper. It is also noted that on 28 February 1985 in the journal of New Scientist, Mannon and Johnson write in their article on mycotoxin contamination that according to the FAO, mycotoxins contaminate some 25% of the world’s food crop, and later in the article they state that ‘FAO has estimated that 25% of the world’s food crops are ruined by mycotoxins’ (Mannon and Johnson Citation1985). The authors do not give any other references, except FAO, to the information of 25% contamination rate.
Thus, to best of our knowledge, it seems that there is no accurate published reference available for the figure of 25% world’s food crop mycotoxin-contaminated. Nor there is any information on which dataset this estimate was based on or how it was calculated. Following the exchange of views with the FAO officials in spring 2017, it turned out that neither them were able to trace back the origin of the estimate. However, it could be reasonable to presume that the estimate of FAO stems from the proportion of the mycotoxin-contaminated food crops exceeding the Codex standards in place at the time, rather than from the contaminated food crops above the limits of detection (LODs)/limits of quantification (LOQs) of the analytical methods used back then. The estimate of 25% presented in the FAO journal back in 1999 has been widely cited since then in many publications. Over the years it has therefore become ‘THE’ reference value for the mycotoxin incidence in food crops at the global level. This can be evidenced for example by carrying out a search for key words ‘FAO 25%, mycotoxins’ through the Google search engine (19 August 2019) resulting in thousands of citations varying from the citations in the documents of the public national and international food safety organizations (including FAO) to the citations in research papers and in industry documents. For these aforementioned reasons, it is therefore highly important to discuss where this decades old FAO estimate for the world’s mycotoxin-contaminated food crops stands today.
Notably in the recent past, data on large surveys on mycotoxin occurrence across the world have been released suggesting higher mycotoxin prevalence than 25% stated by FAO. Streit et al. (Citation2013) reported that overall 72% of the around 17,300 feed samples origin from different parts of the world collected over eight years contained mycotoxins. Also, Kovalsky et al. (Citation2016) reported that mycotoxin contamination in feeds could be up to 79% or even above in about 2000 samples from 52 countries. The authors noted that the observed frequency is considerably higher than FAO’s 25% and concluded that the outcome of their study is a starting point for a more detailed investigation of mycotoxin contamination rates at the global level. They further emphasized that more data should be included in such an investigation. Similar high frequencies of mycotoxins in feed were recently published by Biomin (Citation2017) (see also below) in a large survey comprising 72 countries across the globe. Although in these surveys mainly animal feed samples have been studied, they point to the direction that the prevalence of mycotoxin-contaminated food crops could also be higher than the 25%-estimation of FAO.
The aim of this paper is to provide a compilation of the most recent and most relevant published information on the estimated global prevalence of mycotoxins in food crops, in particular. Mainly food-grade cereals and nuts are considered. However, no large harmonized global-level mycotoxin occurrence surveys for food crops were identified in the literature, while for feed they are accessible. Therefore, the relevant data on mycotoxin-contaminated feed are also noted in this paper although in general prevalence is assumed to be higher in feed crops than in food crops. Only those mycotoxins which are included in the standards of Codex Alimentarius and/or in the regulations of the EU are addressed in this review.
The World Health Organization (WHO) collects global food occurrence data on mycotoxins from the published literature and through its call for data. As these data are carefully scrutinized and cleaned by the WHO/FAO experts, the authors considered that the risk assessments of the Joint FAO/WHO Expert Committee on Food Additives (JECFA) represent currently the best available literature source for the global-level estimates of mycotoxin prevalence in food crops. Therefore, the estimates calculated by JECFA for mycotoxin-contaminated food crops are presented in this paper. In addition, the global estimates of prevalence from those individual research papers, which were considered of providing added value, were included. Furthermore, mycotoxin prevalence was assessed by the authors using two large datasets. The first one comprised the occurrence data on food collected in 2010–2015 by European Food Safety Authority (EFSA) from the EU Member States. These data were requested from EFSA through the application of the EU-regulation No 1049/2001 on public access to documents (EP and Council Citation2001). The second dataset on mycotoxins in feed was from Biomin Inc., Austria. Aspects causing variability in the occurrence data and impacting the uncertainty of the estimated mycotoxin prevalence are also discussed.
Variability and uncertainties associated with prevalence estimates of mycotoxins in food-crops
Many aspects cause variability in the data and therefore impact the uncertainty of the estimated frequencies of mycotoxin-contamination. This should be kept in mind when estimating the prevalence of mycotoxins in food and feed crops at the global level. Therefore, it is clear that the estimate for the overall mycotoxin-contaminated crops at the global level, based on the currently available data, can at its best be an indicative rather than an exact figure. Before an accurate estimate can be provided, statistically relevant amount of high-quality data should be made available. Therefore, large occurrence data surveys on mycotoxin contamination in food-crops, with harmonized sampling strategies and analytical performance criteria, across the world over several growing seasons should be conducted.
Different regulatory levels and standards impact the reported mycotoxin prevalence
The applied regulatory levels and standards of mycotoxins vary in the different regions of the world. At the global level, the Codex Alimentarius Commission of the Food, the joint inter-governmental body of FAO and WHO, is the main operator in standard setting. The Codex standard CXS 193-1995 establishes maximum levels (MLs) for AFs (sum of AFB1, AFB2, AFG1 and AFG2, and, separately, AFM1 in milk), DON, FBs (sum of FB1 and FB2) and OTA for different foods (Codex Alimentarius Citation1995). The Codex standard also defines sampling plans and analytical method performance criteria for the mycotoxins (Codex Alimentarius Citation1995). The standards issued by Codex are voluntarily applied by the Codex member countries. They are considered as neutral and generally accepted as global standards, and national mycotoxin legislation in many countries are based on them. The Codex MLs for food-crops are presented in .
Table 1. Maximum levels for most often regulated mycotoxins in food crops.
The EU has its own established MLs for mycotoxins in foods and feeds. The EU-legislation comprises several legally binding regulations, and recommendations which are not binding but give a guidance for risk management. Since 1999 harmonized ML for AFs have been in place in the EU. The enforceable MLs for AFs (AFB1 alone, sum of AFB1, AFB2, AFG1 and AFG2, and separately for AFM1), OTA, DON, ZEN, FBs (sum of FB1 and FB2) in various foods are stipulated in the Commission Regulation (EC) No 1881/2006 and in its amendments (EC Citation2006a). The EU MLs for food-crops are listed in . For the sum of T-2 and HT-2, the EC prescribes indicative levels for cereals and cereal products (EC Citation2013) (). Furthermore, the EC recognizes the need for simultaneous analysis of Fusarium-toxins (EC Citation2013). As an analog to the Codex standards, also the EC specifies sampling methods and performance criteria for the analytical methods (EC Citation2006b). While the Codex standard CXS 193-1995 specifies that its MLs are for feeds only when the mycotoxins transfer to animal-derived foods and are relevant for the public health, the EU Directive 2002/32/EC regulates mycotoxin levels in animal feed (EP and Council Citation2002). However, only MLs for AFB1 in feeds have been set. The acceptable guidance levels for DON, ZEN, OTA, T-2 and HT-2 and the sum of FB1 and FB2 in feeds are covered by the Commission Recommendations 2006/576/EC and 2013/165/EU (EC Citation2006c, Citation2013). Although several parts of the EU mycotoxin-legislation have been harmonized with the Codex standards, the EU-legislation appears to be more detailed and the MLs more stringent than the corresponding Codex ones.
In addition to the Codex standards and EU-legislation, many world countries have their own national mycotoxin legislations. For example, in USA, the US Food and Drug Administration (US FDA) has issued Compliance Policy Guides on regulatory MLs for AFB1 and AFM1, and Guidance for Industry (non-binding) for guidance MLs of DON and sum of FB1, FB2 and FB3 in certain foods and feeds (FDA Citation1980a, Citation1980b, Citation1982, Citation1983, Citation2001a, Citation2001b, Citation2010). In Canada, legislated MLs have been established for AFs, and guidelines for DON and HT-2 in some foods and feeds (RG-8 Regulatory Guidance, CFIA Citation2017). Recommended levels Canada has set for T-2, ZEN and OTA in many feeds (CFIA Citation2017). In Australia, statutory MLs for AFs in nuts are in force (FSANZ Citation2017). Japan has established regulatory MLs for AFB1 in all foods and a provisional ML for DON in wheat (FAMIC Citation2011; Personal Communication, Ministry of Health, Labor and Welfare, Japan 2018). Regulatory ML and advisory levels for AFB1, DON and ZEN for feeds are also in place in Japan (FAMIC Citation2015). China has established statutory MLs for AFB1, AFM1 and OTA in many foods, while for DON and ZEN guidance levels have been prescribed (GB Citation2017). The regulatory MLs and guidance levels in food-crops for these selected countries are presented in .
Because only the compliance of the mycotoxin concentrations in food and feed with the regulatory MLs allows the food and feed business operators to place the commodities on the market, it is apparent that a large amount of the analytical occurrence data is generated for this purpose. The mycotoxin MLs and guidance levels established for food-crops by Codex Alimentarius, EU and some selected individual countries differ as seen in . Therefore, when considering the prevalence of mycotoxins across the globe, the different MLs and guidance levels in place in the different geographical regions undoubtedly influence the outcome of this consideration.
Sampling, monitoring and performance of the analytical methods
Across the world, the occurrence of mycotoxins in foods and feeds is actively monitored by food and feed business operators, official control laboratories and research organizations either to determine the regulatory compliance or the quality of foods and feeds. Analytical methods are generally well established for many mycotoxins; currently liquid chromatography (LC) based methods coupled to tandem mass spectrometry (MS) are probably the most widely applied and preferred techniques (as also shown from the analyzed datasets below). The current trend in mycotoxin analysis seems to be on the one hand to reach ever lower concentration levels and multi-mycotoxin and full metabolite profiles (Arroyo-Manzanares et al. Citation2018; Brouwer-Brolsma et al. Citation2017; de Lourdes Mendes de Souza et al. Citation2013; Doppler et al. Citation2016; Adekoya et al. Citation2019; Malachová et al. Citation2014, Citation2018; Njumbe Ediage et al. Citation2015; Monbaliu et al. Citation2010; Rofiat et al. Citation2015; Shephard et al. Citation2013; Simader et al. Citation2015; Uhlig et al. Citation2013; Varga et al. Citation2013; Warth et al. Citation2012; Citation2015), and on the other hand to determine the compliance at the statutory levels by fast on-site techniques (Dorokhin et al. Citation2011; EC Citation2006b; Ediage et al. Citation2012; Joshi et al. Citation2016; Peters et al. Citation2017; Sieger et al. Citation2017). The current multi-analyte and multi-class analytical methods are capable of a high throughput of samples making larger amounts of results available than ever before in a short period of time. Today’s analytical methods generally have lower LODs and LOQs than the methods a decade or two ago. For example for the determination of DON in foods, while the typical LODs for a range of different methods were within 5–1600 µg/kg as reported by JECFA in 2001, they were within 1–60 μg/kg for the MS-based methods (mainly used) as reported by JECFA 10 years later in 2011 (JECFA Citation2001, Citation2011). This, no doubt has a direct impact on the presently reported apparently higher mycotoxin-contamination rates than during earlier years. Most importantly, the higher amount of available data and more stringent analytical data quality requirements decrease variability in the currently estimated mycotoxin frequencies, thus justifying an update of occurrence data.
The analysis at the low concentrations requires not only advanced (and expensive) techniques but also experienced human resources and time. These reasons typically limit the routine control laboratories to analyze mycotoxins at their lowest possible LODs/LOQs the method is capable to. They rather operate with pragmatic fit-for-purpose methods in the region of the legal mycotoxin MLs. Thus, the adjusted sensitivity of the methods by the laboratories also affects the found prevalence of mycotoxins and causes variability in the reported frequencies. It is also clear that between-laboratory variation occurs independently from the approach of the laboratory to generate the analytical results at the lowest capable level of LOD/LOQ or at the level of MLs. Furthermore, the general practice how to report the positive results varies. The prevalence can be expressed either considering the mycotoxin results (quantifiable) above the LOD or above the LOQ of the respective laboratory. Thus, depending on the published report, the samples either above LODs or LOQs are considered positive or sometimes a distinction between the two is not made, leading to an increased variability of the reported data on frequencies of mycotoxin contamination. Even in the extensive mycotoxin reports of JECFA and EFSA, it is not always clear whether the indicated mycotoxin-incidence is based on > LOD or > LOQ.
It is very obvious that sampling influences the reported mycotoxin-incidence values. Different sampling strategies e.g. targeted and random, generate completely different outcomes. Sampling schemes can also alter, for example depending on the exporting destination of the food crops. Another sampling plan can be used when exporting to the EU with stringent mycotoxin regulations than when exporting to countries with more liberal requirements (JECFA Citation2008). This certainly impacts the observed incidence data on mycotoxins. For the prevalence data presented in this paper, it is expected that results from targeted sampling have been omitted by the authors when reporting their observations on mycotoxin incidences.
Amount of occurrence data varies across the world
While generally a large quantities of mycotoxin occurrence data are currently available, there are still many geographical regions in the world from where the data are limited or lacking. Typically, these are developing countries or countries with ongoing crisis events. This lack of data is evident only by looking into the many international mycotoxin assessments issued by JECFA and IARC or the WHO Global Environment Monitoring System (GEMS)/Food contaminants database on mycotoxin occurrence data collected by WHO, where majority of the data are from Europe, Americas and Western Pacific (WHO Citation2018). It is clear that limited and absence of data on mycotoxins lead to high uncertainties in the prevalence estimates or entirely prevents their calculations.
Contrary to the limited government and publicly available data, a wealth of mycotoxin occurrence data is assumed to be in the possession of the food and feed companies. To produce safe and high-quality food and feed commodities from agricultural crops, and to comply with the statutory levels, it is apparent that the largest amount of occurrence data is generated by the private food and feed business sector. Of these data, only a fraction is available for estimating the worldwide mycotoxin contamination rates as most of the companies do not publish their data or submit them to the organizations like WHO, FAO or EFSA. The occurrence data used by these international food safety bodies are from the official control laboratories and from research organizations. It is apparent that at the stage of the official food control, the food business operators have already applied their in-house control systems and discarded the most contaminated lots. Therefore, largely the data from the official controls represent the mycotoxin-results which are compliant with the MLs. This leads to a skewness of the dataset and a lower prevalence of mycotoxins than it likely would be in the crops at the farm level. For example, majority of the EFSA data are from the national control programs organized by the EU Member States (Eskola et al. Citation2018).
Climate influences mycotoxin prevalence
It is common knowledge that different mycotoxin producing fungal species favor different climate conditions making mycotoxin prevalence highly variable across the world. Mycotoxins, such as trichothecenes, are typically regarded as toxins of the regions with temperate climate, while the presence of others, such as aflatoxins, are associated with tropical and subtropical climate areas. A large amount of information is available in the literature on the environmental factors impacting the presence of mycotoxins in food and feed crops (e.g. Van der Fels-Klerx et al. Citation2012a, Citation2012b; Citation2016; Battilani et al. Citation2012, Citation2013, Citation2016; Paterson and Lima Citation2017). A year-to-year variation occurs. While on the other years high mycotoxin contamination rates are observed, on the other years the prevalence of mycotoxins is low (Edwards and Jennings Citation2018; Kos et al. Citation2013; Meyer et al. Citation2019). Climate change is further believed to affect fungal growth and agricultural practices and, subsequently to the mycotoxin incidences and levels on the agricultural crops (Battilani et al. Citation2013; Paterson and Lima Citation2017; Van der Fels-Klerx et al. Citation2012a, Citation2012b, Citation2016). It is also projected that changes in climate will shift the geographic distributions of mycotoxin-producing fungi and hence the patterns of mycotoxin occurrence in the world. The amount of mycotoxin-contaminated crops are generally anticipated to increase with the global warming, but at the same time major variations in mycotoxin contamination are also expected as well as decreased occurrences of mycotoxins (Battilani et al. Citation2013; Paterson and Lima Citation2017; Van der Fels-Klerx et al. Citation2012a, Citation2012b, Citation2016). Furthermore, most of the mycotoxins are known to be chemically stable, with pre- and post-harvest mitigation strategies, such as with food and feed processing, only eliminating them to a certain extent (Leslie and Logrieco Citation2014).
Impact of global trade on mycotoxin prevalence data
Cereals are the core of human nutrition and their use for food and feed production will only increase during the coming decades (FAO Citation2015). World cereal production in 2017/2018 was estimated to be 2094 million tonnes by EC (EC Citation2018a). Globally, food remains as the most important use of cereals but due to the higher demand for protein-based foods, the need of cereals for feed materials will increase. Global food and feed trade has grown rapidly in the recent decades and is only expected to grow (FAO Citation2015). The countries in every region of the world have become more involved in the global trade than ever before, either as exporters or importers or both. For example, during the past decades the EU-imports from developing countries have increased sharply (Bureau and Swinnen Citation2018). Currently, the EU exports mainly wheat and barley, approximately 20% of the EU's wheat crop is exported annually, while large amounts of food-grade rice and feed (e.g. maize) are imported by the EU (EC Citation2018b). A country like Japan, where less than 40% of consumed foods were domestic in 2016, relies heavily on imported foods, agricultural foods comprising about 70% (MHLW Citation2018). As agricultural food and feed crops are widely internationally traded, the estimates of mycotoxin occurrence and prevalence reported in the literature for specific country or region likely comprise results for both domestic and imported crops.
Previously reported global incidences for the regulated mycotoxins
While JECFA did not provide global estimates for AF-contaminated foods in its reports, IARC (Citation2012) reported that it can vary from a few percent to 30% or more depending on the food product and geographical region. JECFA (Citation2008), however, suggests that about 20% of tree nuts from different regions are contaminated. According to EFSA the prevalence in nuts for total AF (sum of AF B1, B2, G1 and G2) above LOD varied from 10% in cashew nuts to 40% in pistachio and Brazil nuts (EFSA Citation2009). Total AF contamination above LOD/LOQ was 45% in dried figs (EFSA Citation2012a) and 13% in cereals (EFSA Citation2013). Recently, Lee and Ryu (Citation2017) assessed the incidence of AFs in unprocessed food-grade cereals (barley, maize, wheat, rice, and other cereals e.g. oats) in Africa, America, Asia and Europe compiling data from papers published over 10 years since 2006. Total AF-prevalence in these regions was 55%, varying from 15% in the American continent to 63% in Asia. Similar global contamination rates from 16% up to 33% for AFs over eight years were reported for 17,300 feed samples mainly from America (15%), Asia (40%) and Europe (38%) in 2013 (Streit et al. Citation2013). Amongst the around 14,400 globally collected feed samples in 2016–2017, the highest AF-incidence of 23% was found in nearly 7000 samples from North America (Biomin Citation2017).
In 2001, JECFA reported that over 60% of the data on maize and maize-derived foods from nine different world countries were FB-contaminated (above LOD) (JECFA Citation2001). In 2012, it reported that 70% of the results for maize samples worldwide were above the LOD or LOQ for FB1 (JECFA Citation2012). In 2017, the maize and maize-based foods had the highest occurrence of FB1, with the frequency close to 50% exceeding the LOQ (data from Europe, Canada and Japan) (JECFA Citation2017). A similar global prevalence of 61% for FBs was calculated by Lee and Ryu (Citation2017) for unprocessed food-grade barley, maize, wheat, rice, and other cereals from the published data from 10 years since 2006. The total incidence varied from 39% of Europe to 95% of America (Lee and Ryu Citation2017). For FBs during a 8-year period, the prevalence was 50–63% in the 17,300 feed samples collected from America (15%), Asia (40%) and Europe (38%) (Streit et al. Citation2013). Within nearly 12,800 global feed-samples from 2016 to 2017, 85% of about 2500 Asian samples were contaminated with FBs, 75% of 5500 South American samples and 63% of about 450 African samples (Biomin Citation2017).
JECFA (Citation2011) reported that worldwide 50% of oats results, 70% of barley, wheat and rice results and 90% of maize exceeded the LODs for DON. In its earlier evaluation (JECFA Citation2001), DON-contamination in cereal grains varied from 30% in rice to 60% in wheat and barley up to 70% in oats (levels above LOQs). A global DON-incidence of nearly 60% was reported by Lee and Ryu (Citation2017) for unprocessed food-grade barley, maize, wheat, rice, and other cereals based on the published data in 10 years since 2006. The prevalence varied from 50% in Asia to 76% in Africa (Lee and Ryu Citation2017). These percentages support the contamination rates of 46–64% from the eight years when 17,300 feed samples from America, Asia and Europe were analyzed (Streit et al. Citation2013). Biomin survey of around 15,100 feed samples sourced globally in 2016–2017 showed a lowest incidence of 65% for DON in about 4700 European samples, of 70% in about 650 Middle East and African samples and the highest DON-incidence of 82% in about 4800 South American samples (Biomin Citation2017). JECFA reported that the incidence of T-2 was 11% and of HT-2 14% in grain samples of barley, maize, oats, rice, rye and wheat for human consumption (mainly from Europe) (JECFA Citation2002). About 30% of the feed samples from Europe and South-America were positive for T-2, while only a few percentages were positive from other geographical regions in all nearly 8000 samples analyzed by Biomin (Citation2017).
For the incidence of ZEN in contaminated food-crops across the world, JECFA (Citation2000) reported a large variation (0–100%), suggesting roughly 30–40% of contamination. In unprocessed food-grade cereals (barley, maize, wheat, rice and other cereals) an incidence of 46% of ZEN across the globe was estimated based on the data published in 2006–2016 (Lee and Ryu Citation2017). The ZEN-incidence in cereals was the lowest in Asia (15%) and the highest (59%) in Africa (Lee and Ryu Citation2017). The range of 31–43% for ZEN-positive feed samples over the 8-year period in 17,300 samples primarily from Asia, America and Europe (Streit et al. Citation2013) was similar to those of JECFA (Citation2000) and Lee and Ryu (Citation2017). The global data of around 15,600 feed samples indicated that the ZEN-incidence was at the region of 40–50% (Biomin Citation2017).
Based on the worldwide data, an incidence of OTA-positive samples varied depending on the type of food crop but was generally lower than 50% for cereals (JECFA Citation2001, Citation2007, Citation2008). Similar incidences, varying from 20% in Europe to 42% in America, in unprocessed food-grade barley, maize, wheat, rice, and other cereals were reported by Lee and Ryu (Citation2017) based on the published data from the 10 years. They estimated a global incidence of 29%. Only slightly lower prevalence of 17–28% for OTA was found in the 8-year-long study comprising 17,300 feed samples mainly from America, Asia and Europe (Streit et al. Citation2013). Similar prevalence of up to 27% was reported by Biomin (Citation2017) for 6500 global feed samples. In the three largest sets of samples (n = ∼1500 to ∼2500), the OTA-contamination rates were 5% for North America, 24% for Europe and 27% for Asia (Biomin Citation2017).
Assessment of prevalence of mycotoxins in food crops by using EFSA and Biomin data
To assess mycotoxin occurrence frequency at different thresholds two data sets were investigated. The first set was obtained from EFSA with commodities destined for human consumption; the second set was commercial feed analysis data set provided by Biomin Inc. EFSA data were obtained through an access to information request (EFSA Ref. 17238686; PAD 2017 017) and was an extract of the EFSA chemical occurrence database concerning selected mycotoxin concentration data of all EU Member States. For the sampling years from 2010 to 2015 the following information was obtained from EFSA: (1) Year of sampling, (2) month of sampling, (3) country of origin of the sample, (3) commodity sampled, (4) method of analysis employed, (5) limit of detection of the method employed, and (6) co-occurring species with concentration levels. The data set contained 536,013 analyses from 175,270 samples of EU regulated mycotoxins with the ancillary data mentioned above. At the request of some national data providers, EFSA provided a replacement of the country name by the indication ‘EU’ due to ‘a risk for indirect identification of economic operators, which may be country-specific and is to be considered as a commercial interest deserving protection’ as specified by EFSA in its cover letter to the authors. In the dataset 31,651 samples were labeled as ‘EU’. The EFSA occurrence data on food and feed were collected from the European markets but were not necessarily cultivated or originated from Europe. Owing to the fact that the FAO estimate is for food crops, to calculate the frequency of the contaminated samples in the EFSA dataset, results for processed food items were excluded and occurrence in raw materials only was evaluated.
The dataset obtained from Biomin was described in detail in an earlier report by Kovalsky et al. (Citation2016). In brief, the original data set covered the years 2012–2015 for 1942 samples originating from 46 countries around the globe with a subset consisting of EU countries that was used for analysis. Samples were directly provided by farmers for analysis and commodities analyzed were primarily destined for use in animal feed, although the ultimate fate of the commodities remains unclear. Mycotoxin and metabolite concentrations were determined using a single multi-mycotoxin LC-MS method reported by Malachová et al. (Citation2014). In the previous study by Kovalsky et al. focused on mycotoxin and metabolite concentrations (57 compounds) in three selected matrices with a focus on the co-occurrence of regulated mycotoxins with masked and emerging toxins. In this study, we discuss outcomes of the statistical analysis of a very different subset, i.e. regulated mycotoxins and mycotoxins with guidance levels in grains of all kinds as reported to obtain an estimate of contamination frequencies and levels not provided previously. provides a summary of the datasets and subsets investigated.
Table 2. Summary statistics of the EFSA and Biomin data sets investigated for occurrence of six mycotoxin compounds, i.e. AFs (sum of AFB1, AFB2, AFG1 and AFG2), DON, ZEN, OTA, FBs (sum of FB1 and FB2) and the sum of T-2 and HT-2.
It should be noted that for analyses reported in the EFSA data set a large variety of methods was reported, including several methods classified as LC-MS (with and without the type of mass filter mentioned), high performance liquid chromatography (HPLC) with several detectors (e.g. fluorescence, diode array) and enzyme-linked immunosorbent assay (ELISA). Furthermore, complete method information was not always provided, such as no classification at all for 105,192 samples and ‘HPLC with standard detection methods’ for 40,336 samples. Incomplete method information was not a reason to exclude an analysis, although a very small number of erroneously reported samples analysis methods was removed prior to analysis, e.g. samples analyzed for mycotoxin concentrations using atomic absorption spectroscopy (AAS; n = 149). Because of this large number of different methods, an important consideration was to choose suitable LOD and LOQ values for statistical analysis. Regarding the analytical method employed the Biomin dataset was more consistent. Analysis was performed using a single LC-MS method by a single laboratory, thus eliminating a significant source of variability and allowing the use of a single LOD and LOQ value for a specific matrix.
Considering that the FAO 25% estimate was most likely calculated for samples exceeding the Codex MLs, one of the cutoff values for the data in this study was set at the current Codex MLs () with the caveat that they might have changed from the (initial and unknown) levels, when the estimate of 25% was adopted over three decades ago. The percentages of mycotoxin contaminated samples above the current EU MLs and reported LODs/LOQs were also calculated from the EFSA and Biomin occurrence data.
Samples and mycotoxin concentrations in both data sets were of different origin and were chosen to serve different purposes for this study: The EFSA data set contained data primarily analyzed and submitted by public food safety and research organizations from samples of food crops destined for human consumption. The food crops likely underwent some form of prescreening by e.g., food business operators in their internal quality control prior to submission of sample for analysis. The Biomin dataset, on the other hand, provided data from samples submitted by farmers around the globe for investigation of mycotoxin occurrence and commodities were primarily intended to be used as animal feed. Consequently, results obtained from EFSA data likely provided a lower frequency cutoff for mycotoxin occurrence. The Biomin data, on the other hand, illustrated the upper threshold of mycotoxin occurrence in grains. Samples were intended for animal feed production and sampled directly from the field without further prescreening. Both datasets, therefore, provide a realistic range of mycotoxin occurrence from grain batches. For each of the samples selected above, subset by country and commodity, concentrations for the following toxins were determined for both EFSA and Biomin subsets: AFs (AFLAS, sum of AFB1, AFB2, AFG1 and AFG2), DON, ZEN, OTA, FBs (FUMS, sum of FB1 and FB2) and the sum of T-2 and HT-2 (T2HT2).
In order to find the percentage mycotoxin contamination and provide a detailed measure of contaminated grains in samples, several thresholds were defined and the percentage samples within each category was reported: (1) < LOD, (2) between LOD and lower legal ML/guidance level, (3) between lower and upper legal ML/guidance levels and (4) > upper legal ML/guidance level. While the definition of EU MLs/guidance levels and Codex MLs for the above categories was straightforward, the selection of a single LOD from the EFSA data posed some challenges. LODs for statistical analysis were, therefore, defined as follows in order to obtain a single value to be used for each toxin:
For the EFSA data sets a histogram of the different LODs from all analyses of a specific toxin in each grain subset was plotted. The LOD with the highest frequency was chosen for subsequent analysis and plotting. This approach taken was considered to be appropriate with the underlying rationale that the few laboratories reporting higher LODs did so to make the employed method suitable for the concentrations reported (i.e. fit for purpose) without assessing the method’s full potential. Since other analyses showed lower LODs than the chosen value, reported results represent a conservative estimate regarding the frequency of mycotoxins detected. On the other hand, very few analyses had a higher than the chosen LOD, suggesting a marginal influence of the non-detects associated with higher LODs on the statistical analyses. provides an example for ZEN with the final LOD chosen to be 1 µg/kg. For Biomin data, which were acquired employing a single analytical method in a single laboratory made the handling of the LOD straightforward. provides a summary of the thresholds and limits employed for statistical analysis.
Figure 1. Histogram of reported LODs for ZEN in the EFSA grain subset.
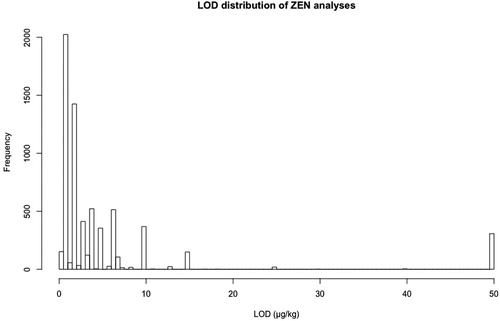
Table 3. Thresholds employed for statistical analysis of EFSA and Biomin data.
Determination of frequency of contaminated samples at different thresholds
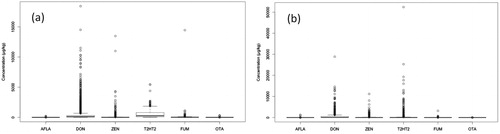
shows an overview of the concentration distribution for the six investigated mycotoxins in grain samples from (a) EFSA and (b) Biomin samples. Means and medians were very low due to the fact that most of the results were found to be below the LOD. But there were occurrences of samples with high concentrations of especially DON and ZEN in both sample sets. While these numbers were to be expected for Biomin samples as they originated directly from the fields, samples without further prescreening, EFSA data submitted by the public organizations throughout the EU also showed an important number of samples with high DON and ZEN concentrations, despite assumed prescreening prior to analysis. The dense cluster of points with higher concentrations (often above the legal and guidance levels listed in ) in the DON and ZEN boxplots suggested that an important number of samples featured high DON and ZEN concentrations, warranting further quantitative analysis.
Figure 2. Boxplots of toxin concentration distribution in (a) EFSA and (b) Biomin grain samples.
Employing the thresholds from , plots were created with the percentage of samples for each toxin falling within one of the four categories: < LOD, between LOD and the lower limit, between the lower and upper limit and, finally above the upper limit. Limits were chosen to be EU MLs (for food) and guidance values (for feed) and Codex MLs. depicts results for EU food MLs applied to the EFSA subset for grains; shows the result obtained for the Biomin dataset and EU feed ML and guidance values.
Figure 3. Percentage of EFSA grain samples falling within one of the four categories for each toxin as follows: (1) <LOD, (2) between LOD and lower legal level, (3) between lower and upper legal level and (4) above the upper legal level. (a) EU food MLs and (b) Codex MLs. For the respective limits see .
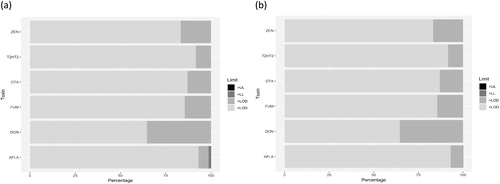
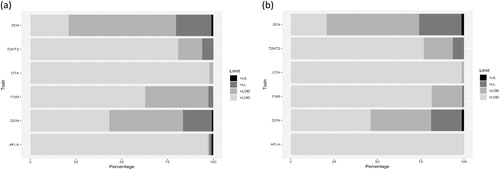
Figure 4. Percentage of Biomin grain samples falling within one of the four categories for each toxin as follows (from left to right): (1) <LOD, (2) between LOD and lower legal level, (3) between lower and upper legal level and (4) above the upper legal limit. (a) Samples of global origin with EU feed guidance values applied and (b) Samples of EU origin with EU feed guidance values applied. For limits see .
Quantitative plots confirmed the initial assessment as shown in . While most samples showed concentrations below the LOD (i.e. no toxin was detected), there is a certain percentage of samples that are contaminated (with concentrations between the LOD and the lower legal level) with DON and ZEN showing the highest occurrence. Very few samples were also found to contain elevated concentrations above the legal levels. Notable are the high frequencies of occurrence of DON, ZEN and FBs, with 40, 20 and 15% of samples, respectively, containing detectable concentrations, but below the EU lower ML ().
For the Codex MLs () applied to EFSA data it has to be noted that only one level is typically provided (), reducing the number of categories to three (< LOD, between LOD and the ML and above the ML). We assume that the calculated percentages reported here are appropriate for comparison with the 25% reported by FAO. The calculated percentages in and are very comparable and the percentages above the lower EU ML and the Codex ML are in the single digits, supporting the prescreening hypothesis.
Biomin data for samples originating directly from the field without further elimination of highly contaminated samples by prescreening shows an entirely different picture. Applied limits followed EU guidance values for feed. The application of EU and Codex food MLs were not considered appropriate since samples were preliminary destined for the production of animal feed. Furthermore, the MLs of DON and ZEN in feed, which showed the highest percentages of contamination above the lower legal/guidance level, are similar for food and feed (see ), thus making percentage contamination data comparable for at least the most commonly found toxins.
Comparing plots for samples of (a) global and (b) EU origin show a high similarity, indicating that contamination percentages measured at the field levels are quite similar for mycotoxins commonly found in temperate climates, such as DON and ZEN. While established food safety systems are able to significantly reduce the risk of contaminated samples entering the food chain (as show in for EFSA data), the actual occurrence percentages (for EU countries presented in ) are significantly higher when looking at the data for feed. For ZEN the percentage of samples with detected mycotoxin concentrations reached about 80% with similar values for global and EU data from the Biomin dataset. Among these samples about 60% showed detected concentrations and while more than 20% of samples were found to be contaminated above the lower limit (lower EU guidance value for feed). The situation for DON was similar with 40% detected concentrations and slightly less than 20% contaminated above the lower limit.
Provided that the FAO 25% figure was established as percentage of samples above the Codex MLs and assuming that Codex MLs have not changed, the recent data for non-prescreened (i.e. feed) samples showed a similar level of contamination with around 20%. The percentage of samples with detected concentrations, on the other hand (> LOD, but below the lower legal level or guidance value), was significantly higher. While no historical reference value for comparison was available for this category, its percentage has likely increased over the last decades. Method development progress has been significant, and sensitivity and selectivity of current state-of-the-art methods have greatly increased. These improvements provide the tools for further investigation of human and animal low-level exposures to mycotoxins, in particular exposures to mycotoxin-mixtures, and their contributions to the associated health risks. On the other hand, prevention strategies in the field and during storage would have helped to curb mycotoxin production over the last decades (Jard et al. Citation2011; Magan and Aldred Citation2007). The number of agricultural crops infected with toxigenic fungi is indeed quite high as the data > LOD clearly demonstrates with up to 80% of samples showing detectable concentrations of ZEN and 60% of samples showing detectable DON concentrations. This constitutes a large pool of infected crops potentially to produce even large quantities of mycotoxins in a warming climate. With climate change favoring fungal growth and toxin production the global mycotoxin problem is expected to worsen (Van der Fels-Klerx et al. Citation2012a, Citation2012b; Citation2016; Battilani et al. Citation2013; Paterson and Lima Citation2017).
Summary and conclusion
In this paper we strive to provide a rationale for a widely cited FAO estimate of 25% mycotoxin contamination in food crops around the globe. The exact origin and the basis for the estimate are unknown today and little details are available apart from secondary sources. The presented study provides a review of the occurrence of mycotoxins in grain from the literature with a focus on reports of JECFA. It has conducted extensive global reviews of the occurrence of known health-relevant and regulated mycotoxins, such as AFs, DON, ZEN, FBs, T-2 and HT-2 and OTA. Based on the literature data, the global mycotoxin prevalence in food crops varies largely depending on many factors, such as the mycotoxin of concern, used analytical methods and reporting of the results, but it appears that the prevalence for the detected mycotoxins is up to 60–80%. Analyzing recent data on food grains for the years 2010–2015 provided by EFSA (from national food control programs and, therefore, most likely prescreened by the food business operators for quality before sampling) and Biomin Inc. (grains sampled at source at the farm-level) we found similar percentages in grain samples for DON (60%) and ZEN (80%), the two most prevalent mycotoxins in temperate climates. In addition to the detected mycotoxins, the analysis provides additional detail using different regulatory thresholds from the current EU legislation and Codex standards for food and feed. Results showed in the region of 20% of samples being contaminated above the lower regulatory EU and Codex level for materials sampled at source, but lower contamination levels (<10%) for food-grade grain samples. Comparing the FAO 25% estimate to values above EU and Codex limits (typically 20% for samples collected at source) would appear to confirm the original estimate. However, a comparison with the percentage of samples found to have mycotoxins present (in 60–80% of all samples for DON and ZEN alone) these figures greatly underestimate their occurrence. While progress in method development likely led to an increase in the percentage of detected mycotoxins (due to lower LODs), active mitigation strategies have most likely contributed to a reduction of high contamination batches, estimates that cannot be produced with the currently available data, but will need to be considered in future investigations. Climate change may have also had an impact on the higher incidence and will only serve to increase this level of contamination in future years. Before an accurate estimate can be provided, statistically relevant amount of high-quality data should be made available. Therefore, large occurrence data surveys on mycotoxin contamination in food-crops, with harmonized sampling strategies and analytical performance criteria, across the world over several growing seasons should be conducted. Humans and animals are typically exposed to mycotoxin mixtures which can induce combined adverse health effects. However, in those events where the concentration exceedance of the statutory limits (e.g. 20% or 25% of the samples) would lead to regular high dietary exposures to mycotoxins, and to their mixtures in particular, adverse health consequences can be expected. It is also of immense importance that the detectable levels (based on our estimation up to 60–80% of the samples) are not overlooked as through diets humans and animals are exposed to mixtures of different mycotoxins. Many of these possibly additive and synergistic effects are yet to be toxicologically investigated and their influence on the public health to be assessed by applying harmonized methodologies (EFSA Citation2019; Eskola et al. Citation2018).
Declaration of interest
The authors do not declare any conflict of interest.
Acknowledgements
This research was supported by the European Union Horizon 2020 research and innovation programme under grant agreement no. 692195 (‘MultiCoop’). The authors thank Biomin Inc. for the use of the Biomin World Mycotoxin Survey 2017 data. In addition, we thank the European countries who have submitted their mycotoxin data to EFSA. We also wish to thank the FAO officials for a fruitful email discussion.
References
- Adekoya, I., P. Njobeh, A. Obadina, S. Landschoot, K. Audenaert, S. Okoth, M. De Boevre, and S. De Saeger. 2019. Investigation of the metabolic profile and toxigenic variability of fungal species occurring in fermented foods and beverage from Nigeria and South Africa using UPLC-MS/MS. Toxins 11 (2):E85. doi: 10.3390/toxins11020085.
- Alassane-Kpembi, I., G. Schatzmayr, I. Taranu, D. Marin, O. Puel, and I. P. Oswald. 2017. Mycotoxins co-contamination: Methodological aspects and biological relevance of combined toxicity studies. Critical Reviews in Food Science and Nutrition 57 (16):3489–507. doi: 10.1080/10408398.2016.1140632.
- Arroyo-Manzanares, N., K. De Ruyck, V. Uka, L. Gámiz-Gracia, A. M. García-Campaña, S. De Saeger, and J. Diana Di Mavungu. 2018. In-house validation of a rapid and efficient procedure for simultaneous determination of ergot alkaloids and other mycotoxins in wheat and maize. Analytical and Bioanalytical Chemistry 410 (22):5567–81. doi: 10.1007/s00216-018-1018-6.
- Battilani, P., M. Camardo Leggieri, V. Rossi, and P. Giorni. 2013. AFLA-maize, a mechanistic model for Aspergillus flavus infection and aflatoxin B1 contamination in maize. Computer and Electronics in Agriculture 94:38–46. doi: 10.1016/j.compag.2013.03.005.
- Battilani, P., V. Rossi, P. Giorni, A. Pietri, A. Gualla, H. J. van der Fels-Klerx, C. J. H. Booij, A. Moretti, A. Logrieco, F. Miglietta, et al. 2012. Modelling, predicting and mapping the emergence of aflatoxins in cereals in the EU due to climate change. European Food Safety Authority (EFSA) Supporting Publication 9 (EN-223):172.
- Battilani, P., P. Toscano, H. J. Van der Fels-Klerx, A. Moretti, M. Camardo Leggieri, C. Brera, A. Rortais, T. Goumperis, and T. Robinson. 2016. Aflatoxin B1 contamination in maize in Europe increases due to climate change. Scientific Reports 6 (1):24328. doi: 10.1038/srep24328.
- Biomin. 2017. Biomin World mycotoxin survey 2017. Annual Report No. 14. Accessed May 11, 2018. https://www.biomin.net/en/blog-posts/2017-biomin-mycotoxin-survey-results/.
- Boutrif, E., and C. Canet. 1998. Mycotoxin prevention and control: FAO programmes. Revue de Médecine Vétérinaire 149:681–94.
- Brouwer-Brolsma, E. M., L. Brennan, C. A. Drevon, H. van Kranen, C. Manach, L. O. Dragsted, H. M. Roche, C. Andres-Lacueva, S. J. L. Bakker, J. Bouwman, et al. 2017. Combining traditional dietary assessment methods with novel metabolomics techniques: Present efforts by the Food Biomarker Alliance. Proceedings of the Nutrition Society 76 (4):619–27. doi: 10.1017/S0029665117003949.
- Bui-Klimke, T., and F. Wu. 2014. Evaluating weight of evidence in the mystery of Balkan Endemic Nephropathy. Risk Analysis 34 (9):1688–705. doi: 10.1111/risa.12239.
- Bureau, J.-C., and J. Swinnen. 2018. EU policies and global food security. Global Food Security 16:106–15. doi: 10.1016/j.gfs.2017.12.001.
- CFIA. 2017. RG-8 Regulatory guidance. Contaminants in feed (formerly RG-1, Chapter 7), Section 1: Mycotoxins in livestock feed. Canadian Food Inspection Agency (CFIA). Accessed March 15, 2018. http://www.inspection.gc.ca/animals/feeds/regulatory-guidance/rg-8/eng/1347383943203/1347384015909.
- Codex Alimentarius. 1995. Codex Alimentarius international food standards, General standard for contaminants and toxins in food and feed. CXS 193-1995. Adopted in 1995. Revised in 1997, 2006, 2008, 2009. Amended in 2010, 2012, 2013, 2014, 2015, 2016, 2017. Food and Agriculture Organization of the United Nations (FAO), the World Health Organization (WHO).
- Deepa, N., and M. Y. Sreenivasa. 2017. Fumonisins: A review on its global occurrence, epidemiology, toxicity and detection. Journal of Veterinary Medicine and Research 4 (6):1093.
- de Lourdes Mendes de Souza, M., M. Sulyok, O. Freitas-Silva, S. Soares Costa, C. Brabet, M. Machinski Junior, B. Leiko Sekiyama, E. Azevedo Vargas, R. Krska, and R. Schuhmacher. 2013. Cooccurrence of mycotoxins in maize and poultry feeds from Brazil by liquid chromatography/tandem mass spectrometry. The Scientific World Journal 2013:427369. doi: 10.1155/2013/427369.
- Diana Di Mavungu, J., D. A. Larionova, S. V. Malysheva, C. Van Peteghem, and S. De Saeger. 2011. Survey on ergot alkaloids in cereals intended for human consumption and animal feeding. European Food Safety Authority (EFSA) Supporting Publication 8:EN-214.
- Doppler, M., B. Kluger, C. Bueschl, C. Schneider, R. Krska, S. Delcambre, K. Hiller, M. Lemmens, and R. Schuhmacher. 2016. Stable isotope-assisted evaluation of different extraction solvents for untargeted metabolomics of plants. International Journal of Molecular Sciences 17 (7):1017. doi: 10.3390/ijms17071017.
- Dorokhin, D., W. Haasnoot, M. C. Franssen, H. Zuilhof, and M. W. Nielen. 2011. Imaging surface plasmon resonance for multiplex microassay sensing of mycotoxins. Analytical and Bioanalytical Chemistry 400 (9):3005–11. doi: 10.1007/s00216-011-4973-8.
- EC. 2006a. Commission Regulation (EC) No 1881/2006 of 19 December 2006 setting maximum levels for certain contaminants in foodstuffs. European Commission. Official Journal of the European Union L 364:5–24.
- EC. 2006b. Commission Regulation (EC) No 401/2006 of 23 February 2006 laying down the methods of sampling and analysis for the official control of the levels of mycotoxins in foodstuffs. European Commission. Official Journal of the European Union L 70:12–34.
- EC. 2006c. Commission Recommendation of 17 August 2006 on the presence of deoxynivalenol, zearalenone, ochratoxin A, T-2 and HT-2 and fumonisins in products intended for animal feeding (2006/576/EC). European Commission. Official Journal of the European Union L 229:7–9.
- EC. 2013. Commission Recommendation of 27 March 2013 on the presence of T-2 and HT-2 toxin in cereals and cereal products (2013/165/EU). European Commission. Official Journal of the European Union L 91:12–5.
- EC. 2018a. European Commission, Directorate General Agri, EU Crops Market Observatory – Cereals, updated on 1.3.2018. Accessed March 10, 2018. https://circabc.europa.eu/sd/a/df783825-dc2c-4673-a66e-0cbd5c5be336/cereals-dashboard_en.pdf.
- EC. 2018b. European Commission, Agriculture and Rural Development, Cereals, oilseeds and protein crops, rice. Accessed March 10, 2018. https://ec.europa.eu/agriculture/cereals_en.
- Ediage, E. N., J. D. Di Mavungu, I. Y. Goryacheva, C. Van Peteghem, and S. De Saeger. 2012. Multiplex flow-through immunoassay formats for screening of mycotoxins in a variety of food matrices. Analytical and Bioanalytical Chemistry 403:265–78. doi: 10.1007/s00216-012-5803-3.
- Edwards, S. G., and P. Jennings. 2018. Impact of agronomic factors on fusarium mycotoxins in harvested wheat. Food Additives & Contaminants: Part A 35 (12):2443–54. doi: 10.1080/19440049.2018.1543954.
- EFSA. 2004a. Opinion of the Scientific Panel on Contaminants in the Food Chain (CONTAM Panel) related to aflatoxin B1 as undesirable substance in animal feed. European Food Safety Authority. EFSA Journal 2:39.
- EFSA. 2004b. Opinion of the Scientific Panel on Contaminants in the Food Chain (CONTAM Panel) on a request from the commission related to deoxynivalenol (DON) as undesirable substance in animal feed. EFSA Journal 72:1.
- EFSA. 2004c. Opinion of the Scientific Panel on Contaminants in the Food Chain (CONTAM Panel) related to ochratoxin A (OTA) as undesirable substance in animal feed. European Food Safety Authority. EFSA Journal 2:101.
- EFSA. 2005a. Opinion of the Scientific Panel on Contaminants in the Food Chain (CONTAM Panel) related to fumonisins as undesirable substances in animal feed. European Food Safety Authority. EFSA Journal 3:235.
- EFSA. 2005b. Opinion of the Scientific Panel on Contaminants in the Food Chain (CONTAM Panel) related to ergot as undesirable substance in animal feed. European Food Safety Authority. EFSA Journal 3:225.
- EFSA. 2006. Scientific opinion related to ochratoxin A in food. European Food Safety Authority. EFSA Journal 4:365.
- EFSA. 2007. Opinion of the Scientific Panel on Contaminants in the Food Chain (CONTAM Panel) related to the potential increase of consumer health risk by a possible increase of the existing maximum levels for aflatoxins in almonds, hazelnuts and pistachios and derived products. European Food Safety Authority. EFSA Journal 5:446.
- EFSA. 2009. Statement of the Scientific Panel on Contaminants in the Food Chain (CONTAM Panel) on a request from the European Commission on the effects on public health of an increase of the levels for aflatoxin total from 4 μg/kg to 10 μg/kg for tree nuts other than almonds, hazelnuts and pistachios. European Food Safety Authority. EFSA Journal 6:1168.
- EFSA. 2010. Statement of the Scientific Panel on Contaminants in the Food Chain (CONTAM Panel) on recent scientific information on the toxicity of ochratoxin A. European Food Safety Authority. EFSA Journal 8:1626.
- EFSA. 2011. Opinion of the Scientific Panel on Contaminants in the Food Chain (CONTAM Panel) on the risks for public health related to the presence of T-2 and HT-2 toxins in food and feed. European Food Safety Authority. EFSA Journal 9:2481.
- EFSA. 2012a. Effect on dietary exposure of an increase of the levels for aflatoxin total from 4 μg/kg to 10 μg/kg for dried figs. European Food Safety Authority. EFSA Supporting Publications 9:EN-311.
- EFSA. 2012b. Opinion of the Scientific Panel on Contaminants in the Food Chain (CONTAM Panel) on ergot alkaloids in food and feed. European Food Safety Authority. EFSA Journal 10:2798.
- EFSA. 2012c. Opinion of the Scientific Panel on Contaminants in the Food Chain (CONTAM Panel) on the risks to human and animal health related to the presence of citrinin in food and feed. European Food Safety Authority. EFSA Journal 10:2605.
- EFSA. 2013. Aflatoxins (sum of B1, B2, G1, G2) in cereals and cereal-derived food products. European Food Safety Authority. EFSA Supporting Publications 10:EN-406.
- EFSA. 2014. Opinion of the Scientific Panel on Contaminants in the Food Chain (CONTAM Panel) on the risks for human and animal health related to the presence of modified forms of certain mycotoxins in food and feed. European Food Safety Authority. EFSA Journal 12:3916.
- EFSA. 2016. Opinion of the Scientific Panel on Contaminants in the Food Chain (CONTAM Panel) on the appropriateness to set a group health-based guidance value for zearalenone and its modified forms. European Food Safety Authority. EFSA Journal 14:4425.
- EFSA. 2017a. Opinion of the Scientific Panel on Contaminants in the Food Chain (CONTAM Panel) on the appropriateness to set a group health-based guidance value for nivalenol and its modified forms. European Food Safety Authority. EFSA Journal 15:4751.
- EFSA. 2017b. Opinion of the Scientific Panel on Contaminants in the Food Chain (CONTAM Panel) on the appropriateness to set a group health-based guidance value for T-2 and HT-2 toxin and its modified forms 2017. European Food Safety Authority. EFSA Journal 15:4655.
- EFSA. 2017c. Opinion the Scientific Panel on Contaminants in the Food Chain (CONTAM Panel) on the risks for animal health related to the presence of zearalenone and its modified forms in feed. European Food Safety Authority. EFSA Journal 15:4851.
- EFSA. 2017d. Opinion of the Scientific Panel on Contaminants in the Food Chain (CONTAM Panel) on the risks to human and animal health related to the presence of deoxynivalenol and its acetylated and modified forms in food and feed. European Food Safety Authority. EFSA Journal 15:4718.
- EFSA. 2017e. Scientific report on human and animal dietary exposure to ergot alkaloids. European Food Safety Authority. EFSA Journal 15:4902.
- EFSA. 2018a. Opinion of the Scientific Panel on Contaminants in the Food Chain (CONTAM Panel) on the appropriateness to set a group health-based guidance value for fumonisins and their modified forms. European Food Safety Authority. EFSA Journal 16:5172.
- EFSA. 2018b. EFSA Scientific Colloquium 24 – ‘omics in risk assessment: State of the art and next steps. EFSA supporting publication. EFSA Journal 2018:EN-1512.
- EFSA. 2018c. Scientific statement on the effect on public health of a possible increase of the maximum level for ‘aflatoxin total’ from 4 to 10 µg/kg in peanuts and processed products thereof, intended for direct human consumption or use as an ingredient in foodstuffs. European Food Safety Authority. EFSA Journal 16:5175.
- EFSA. 2019. Guidance on harmonised methodologies for human health, animal health and ecological risk assessment of combined exposure to multiple chemicals. EFSA Journal 17 (3):5634, 77.
- EP and Council. 2002. Directive 2002/32/EC of the European Parliament and of the Council of 7 May 2002 on undesirable substances in animal feed. European Parliament and Council of the European Union. Official Journal of the European Communities L 140:10–21.
- EP and Council. 2001. Regulation (EC) No 1049/2001 of the European Parliament and of the Council of 30 May 2001 regarding public access to European Parliament, Council and Commission documents. European Parliament and Council of the European Union. Official Journal of the European Communities L 145:43–8.
- Eskola, M., A. Altieri, and J. Galobart. 2018. Overview of the activities of the European Food Safety Authority on mycotoxins in food and feed. World Mycotoxin Journal 11 (2):277–89. doi: 10.3920/WMJ2017.2270.
- EUR-Lex. 2018. An official website of European Union law and other public documents of the European Union. Access to European Union law. Accessed March 1, 2018. https://eur-lex.europa.eu/homepage.html.
- FAMIC. 2011. Aflatoxin. Food and Agricultural Materials Inspection Centre (FAMIC). Accessed March 4, 2018. http://www.famic.go.jp/ffis/oie/obj/hc_aflatoxin.pdf.
- FAMIC. 2015. Regulation value of pesticides, heavy metals and mycotoxins (administrative guideline) (revised December 18, 2015). Food and Agricultural Materials Inspection Centre (FAMIC). Accessed March 4, 2018. http://www.famic.go.jp/ffis/feed/r_safety/r_feeds_safety22.html.
- FAO. 2015. The State of Agricultural Commodity Markets 2015–2016. Trade and food security: Achieving a better balance between national priorities and the collective good. Food and Agriculture Organization of the United Nations, Rome. Accessed April 19, 2018. http://www.fao.org/publications/soco/the-state-of-agricultural-commodity-markets-2015-16/en/.
- FDA. 1980a. Compliance Policy Guide Sec. 555.400 Foods – Adulteration with aflatoxin (October 1, 1980). U.S. Food and Drug Administration. Accessed March 26, 2018. https://www.fda.gov/Food/GuidanceRegulation/GuidanceDocumentsRegulatoryInformation/ChemicalContaminantsMetalsNaturalToxinsPesticides/default.htm.
- FDA. 1980b. Compliance Policy Guide Sec. 570.375 Aflatoxin in peanuts and peanut products (October 1, 1980). U.S. Food and Drug Administration. Accessed March 26, 2018. https://www.fda.gov/Food/GuidanceRegulation/GuidanceDocumentsRegulatoryInformation/ChemicalContaminantsMetalsNaturalToxinsPesticides/default.htm.
- FDA. 1982. Compliance Policy Guide Sec. 570.500 Pistachio nuts – Aflatoxin adulteration (October 1, 1982). U.S. Food and Drug Administration. Accessed March 25, 2018. https://www.fda.gov/Food/GuidanceRegulation/GuidanceDocumentsRegulatoryInformation/ChemicalContaminantsMetalsNaturalToxinsPesticides/default.htm.
- FDA. 1983. Compliance Policy Guide Sec. 570.200 Brazil nuts – Adulteration with aflatoxin (August 1, 1983). U.S. Food and Drug Administration. Accessed March 26, 2018. https://www.fda.gov/Food/GuidanceRegulation/GuidanceDocumentsRegulatoryInformation/ChemicalContaminantsMetalsNaturalToxinsPesticides/default.htm.
- FDA. 2001a. Compliance Policy Guidance Sec. 510.150 Apple juice, apple juice concentrates, and apple juice products – Adulteration with patulin (October 22, 2001). U.S. Food and Drug Administration. Accessed March 26, 2018. https://www.fda.gov/Food/GuidanceRegulation/GuidanceDocumentsRegulatoryInformation/ChemicalContaminantsMetalsNaturalToxinsPesticides/default.htm.
- FDA. 2001b. Guidance for Industry. Fumonisin levels in human foods and animal feeds (November 9, 2001). U.S. Food and Drug Administration. Accessed March 25, 2018. https://www.fda.gov/Food/GuidanceRegulation/GuidanceDocumentsRegulatoryInformation/ChemicalContaminantsMetalsNaturalToxinsPesticides/default.htm.
- FDA. 2010. Guidance for Industry. Advisory levels for deoxynivalenol (DON) in finished wheat products for human consumption and grains and grain by-products used for animal feed (June 29, 2010). U.S. Food and Drug Administration. Accessed March 25, 2018. https://www.fda.gov/Food/GuidanceRegulation/GuidanceDocumentsRegulatoryInformation/ChemicalContaminantsMetalsNaturalToxinsPesticides/default.htm.
- FSANZ. 2017. Australia New Zealand Food Standards Code, 2017. Schedule 19, Maximum levels of contaminants and natural toxicants. Prepared by Food Standards Australia New Zealand (FSANZ) on 13 April 2017. Australian Government, Federal Register of Legislation. Accessed March 25, 2018. https://www.legislation.gov.au/Details/F2017C00333.
- GB. 2017. Maximum levels of mycotoxins in food, China Food Safety National Standard GB 2761-2017. Released March 17, 2017, implemented September 17, 2017. In Chinese.
- Grenier, B., and I. P. Oswald. 2011. Mycotoxin co-contamination of food and feed: Meta-analysis of publications describing toxicological interactions. World Mycotoxin Journal 4 (3):285–313. doi: 10.3920/WMJ2011.1281.
- IARC. 1983. IARC monographs on the evaluation of carcinogenic risk of chemicals to humans. Some food additives, feed additives and naturally occurring substances. International Agency for Research on Cancer, Volume 31, Lyon, France.
- IARC. 1986. IARC monographs on the evaluation of carcinogenic risks to humans. Some naturally occurring and synthetic food components, furocoumarins and ultraviolet radiation. International Agency for Research on Cancer, Volume 40, Lyon, France.
- IARC. 1993. IARC monographs on the evaluation of carcinogenic risks to humans. Some naturally occurring substances: Food items and constituents, heterocyclic aromatic amines and mycotoxins. International Agency for Research on Cancer, Volume 56, Lyon, France.
- IARC. 2002. IARC monographs on the evaluation of carcinogenic risks to humans. Some traditional herbal medicines, some mycotoxins, naphthalene and styrene. International Agency for Research on Cancer, Volume 82, Lyon, France.
- IARC. 2012. IARC monographs on the evaluation of carcinogenic risks to humans. Chemical agents and related occupations. A review of human carcinogens. International Agency for Research on Cancer, Volume 100 F, Lyon, France.
- IARC. 2015. Mycotoxin control in low- and middle-income countries. IARC Working Group report no. 9, eds. C. P. Wild, J. D. Miller, and J. D. Groopman. Lyon, France: International Agency for Research on Cancer.
- Iqbal, S. Z., S. Malik, M. R. Asi, J. Selamat, and N. Malik. 2018. Natural occurrence of patulin in different fruits, juices and smoothies and evaluation of dietary intake in Punjab, Pakistan. Food Control 84:370–4. doi: 10.1016/j.foodcont.2017.08.024.
- Jard, G., T. Liboz, F. Mathieu, A. Guyonvarc'h, and A. Lebrihi. 2011. Review of mycotoxin reduction in food and feed: From prevention in the field to detoxification by adsorption or transformation. Food Additives & Contaminants: Part A 28:1590–609. doi: 10.1080/19440049.2011.595377.
- JECFA. 1996. Toxicological evaluation of certain food additives and contaminants. Prepared by the Forty-forth meeting of the Joint FAO/WHO Expert Committee on Food Additives (JECFA). JECFA Monographs. Food and Agriculture Organization of the United Nations, World Health Organization, IPCS – International Programme on Chemical Safety, WHO Food Additive Series No. 35, World Health Organization, Geneva.
- JECFA. 1997. Evaluation of certain food additives and contaminants. Forty-sixth report of Joint FAO/WHO Expert Committee on Food Additives (JECFA). Food and Agriculture Organization of the United Nations, World Health Organization, WHO Technical Report Series 868, World Health Organization, Geneva.
- JECFA. 1998. Safety evaluation of certain food additives and contaminants. Prepared by the Forty-ninth meeting of the Joint FAO/WHO Expert Committee on Food Additives (JECFA). JECFA Monographs. Food and Agriculture Organization of the United Nations, World Health Organization, IPCS – International Programme on Chemical Safety, WHO Food Additives Series No. 40, World Health Organization, Geneva.
- JECFA. 1999. Evaluation of certain food additives and contaminants. Forty-sixth report of Joint FAO/WHO Expert Committee on Food Additives (JECFA). Food and Agriculture Organization of the United Nations, World Health Organization, WHO Technical Report Series 884, World Health Organization, Geneva.
- JECFA. 2000. Safety evaluation of certain food additives and contaminants. Prepared by the Fifty-third meeting of the Joint FAO/WHO Expert Committee on Food Additives (JECFA). JECFA Monographs. Food and Agriculture Organization of the United Nations, World Health Organization, IPCS – International Programme on Chemical Safety, WHO Food Additives Series No. 44, World Health Organization, Geneva.
- JECFA. 2001. Safety evaluation of certain mycotoxins in food. Prepared by the Fifty-sixth meeting of the Joint FAO/WHO Expert Committee in Food Additives (JECFA). JECFA Monographs. Food and Agriculture Organization of the United Nations, World Health Organization, IPCS – International Programme on Chemical Safety, WHO Food Additives Series No. 47, FAO Food and Nutrition Paper 74.
- JECFA. 2002. Evaluation of certain mycotoxins in food. Fifty-sixth report of the Joint FAO/WHO Expert Committee on Food Additives. Food and Agriculture Organization of the United Nations, World Health Organization, WHO Technical Report Series 906, World Health Organization, Geneva.
- JECFA. 2007. Evaluation of certain food additives and contaminants. Sixty-eighth report of the Joint FAO/WHO Expert Committee on Food Additives (JECFA). Food and Agriculture Organization of the United Nations, World Health Organization, WHO Technical Report Series 947, World Health Organization, Geneva.
- JECFA. 2008. Safety evaluation of certain food additives and contaminants. Prepared by the Sixty-eighth meeting of the Joint FAO/WHO Expert Committee on Food Additives (JECFA). JECFA Monographs. Food and Agriculture Organization of the United Nations, World Health Organization, IPCS – International Programme on Chemical Safety, WHO Food Additives Series No. 59, World Health Organization, Geneva.
- JECFA. 2011. Safety evaluation of certain contaminants in food. Prepared by the Seventy-second meeting of the Joint FAO/WHO Expert Committee in Food Additives (JECFA). JECFA Monographs. WHO Food Additives Series No. 63, FAO JECFA Monographs 8. World Health Organization, Geneva, Food and Agriculture Organization of the United Nations, Rome.
- JECFA. 2012. Safety evaluation of certain food additives and contaminants. Prepared by the Seventy-fourth meeting of the Joint FAO/WHO Expert Committee on Food Additives (JECFA). JECFA Monographs. Food and Agriculture Organization of the United Nations, World Health Organization, WHO Food Additives Series No. 65, World Health Organization, Geneva.
- JECFA. 2017. Evaluation of certain contaminants in food. Eighty-third report of the Joint FAO/WHO Expert Committee on Food Additives (JECFA). Food and Agriculture Organization of the United Nations, World Health Organization, WHO Technical Report Series 1002, World Health Organization, Geneva.
- JECFA. 2018. Safety evaluation of certain contaminants in food. Prepared by the eighty-third meeting of the Joint FAO/WHO Expert Committee on Food Additives (JECFA). WHO Food Additives Series No. 74, FAO JECFA Monographs 19 bis. World Health Organization, Geneva, Food and Agriculture Organization of the United Nations, Rome.
- Joshi, S., R. M. Annida, H. Zuilhof, T. A. van Beek, and M. W. Nielen. 2016. Analysis of mycotoxins in beer using a portable nanostructured imaging surface plasmon resonance biosensor. Journal of Agricultural and Food Chemistry 64 (43):8263–71. doi: 10.1021/acs.jafc.6b04106.
- Kos, J., J. Mastilović, E. J. Hajnal, and B. Šarić. 2013. Natural occurrence of aflatoxins in maize harvested in Serbia during 2009–2012. Food Control 34 (1):31–4. doi: 10.1016/j.foodcont.2013.04.004.
- Kovalsky, P., G. Kos, K. Nährer, C. Schwab, T. Jenkins, G. Schatzmayr, M. Sulyok, and R. Krska. 2016. Co-occurrence of regulated, masked and emerging mycotoxins and secondary metabolites in finished feed and maize – An extensive survey. Toxins 8 (12):363. doi: 10.3390/toxins8120363.
- Krska, R., and C. Crews. 2008. Significance, chemistry and determination of ergot alkaloids: A review. Food Additives & Contaminants. Part A, Chemistry, Analysis, Control, Exposure & Risk Assessment 25 (6):722–31. doi: 10.1080/02652030701765756.
- Lee, H. J., and D. Ryu. 2017. Worldwide occurrence of mycotoxins in cereals and cereal-derived food products: Public health perspectives of their co-occurrence. Journal of Agricultural and Food Chemistry 65 (33):7034–51. doi: 10.1021/acs.jafc.6b04847.
- Leslie, J. F., and A. F. Logrieco. 2014. Mycotoxin reduction in grain chains. Ames, IA: Wiley Blackwell, John Wiley & Sons, Inc.
- López Sánchez, P., M. de Nijs, M. Spanjer, A. Pietri, T. Bertuzzi, A. Starski, J. Postupolski, M. Castellari, and M. Hortós. 2017. Generation of occurrence data on citrinin in food. European Food Safety Authority. EFSA supporting publication, EN-1177.
- Magan, N., and D. Aldred. 2007. Post-harvest control strategies: Minimizing mycotoxins in the food chain. International Journal of Food Microbiology 119 (1–2):131–9. doi: 10.1016/j.ijfoodmicro.2007.07.034.
- Malachová, A., M. Stránská, M. Václavíková, C. T. Elliott, C. Black, J. Meneely, J. Hajšlová, C. N. Ezekiel, R. Schuhmacher, and R. Krska. 2018. Advanced LC-MS-based methods to study the co-occurrence and metabolization of multiple mycotoxins in cereals and cereal-based food. Analytical and Bioanalytical Chemistry 410 (3):801–25. doi: 10.1007/s00216-017-0750-7.
- Malachová, A., M. Sulyok, E. Beltrán, F. Berthiller, and R. Krska. 2014. Optimization and validation of a quantitative liquid chromatography-tandem mass spectrometric method covering 295 bacterial and fungal metabolites including all regulated mycotoxins in four model food matrices. Journal of Chromatography A 1362:145–56. doi: 10.1016/j.chroma.2014.08.037.
- Mannon, J., and E. Johnson. 1985. Fungi down on the farm. New Scientist 1445:12–6.
- Marin, S., A. J. Ramos, G. Cano-Sancho, and V. Sanchis. 2013. Mycotoxins: Occurrence, toxicology, and exposure assessment. Food and Chemical Toxicology 60:218–37. doi: 10.1016/j.fct.2013.07.047.
- McCormick, S. P., A. M. Stanley, N. A. Stover, and N. J. Alexander. 2011. Trichothecenes: From simple to complex mycotoxins. Toxins 3 (7):802–14. doi: 10.3390/toxins3070802.
- Meyer, H., Z. D. Skhosana, M. Motlanthe, W. Louw, and E. Rohwer. 2019. Long term monitoring (2014–2018) of multi-mycotoxins in South African commercial maize and wheat with a locally developed and validated LC-MS/MS method. Toxins 11 (5):271. doi: 10.3390/toxins11050271.
- MHLW. 2018. Ministry of Health, Labour and Welfare, Food Safety Standards and Evaluation Division, Pharmaceutical Safety and Environmental Health Bureau. Information about imported foods. Safety of imported foods. Accessed March 26, 2018. http://www.mhlw.go.jp/english/policy/health-medical/food/dl/leaflet.pdf.
- Monbaliu, S., C. Van Poucke, C. Detavernier, F. Dumoulin, M. Van De Velde, E. Schoeters, S. Van Dyck, O. Averkieva, C. Van Peteghem, and S. De Saeger, 2010. Occurrence of mycotoxins in feed as analyzed by a multimycotoxin LC-MS/MS method. Journal of Agriculture and Food Chemistry 58 (1):66–71.
- Mornar, A., M. Sertić, and B. Nigović. 2013. Development of a rapid LC/DAD/FLD/MSn method for the simultaneous determination of monacolins and citrinin in red fermented rice products. Journal of Agricultural and Food Chemistry 61 (5):1072–80. doi: 10.1021/jf304881g.
- Nathanail, A. V., J. Syvähuoko, A. Malachova, M. Jestoi, E. Varga, H. Michlmayr, G. Adam, E. Sieviläinen, F. Berthiller, and K. Peltonen. 2015. Simultaneous determination of major type A and B trichothecenes, zearalenone and certain modified metabolites in Finnish cereal grains with a novel liquid chromatography-tandem mass spectrometric method. Analytical and Bioanalytical Chemistry 407 (16):4745–55. doi: 10.1007/s00216-015-8676-4.
- Njumbe Ediage, E., C. Van Poucke, and S. De Saeger. 2015. A multi-analyte LC-MS/MS method for the analysis of 23 mycotoxins in different sorghum varieties: The forgotten sample matrix. Food Chemistry 177:397–404. doi: 10.1016/j.foodchem.2015.01.060.
- Park, D. L., H. Njapau, and E. Boutrif. 1999. Minimizing risks posed by mycotoxins utilizing the HACCP concept. FAO Food, Nutrition and Agriculture Journal 23:49–56.
- Paterson, R. R. M., and N. Lima. 2017. Thermophilic fungi to dominate aflatoxigenic/mycotoxigenic fungi on food under global warming. International Journal of Environmental Research and Public Health 14 (2):199–210. doi: 10.3390/ijerph14020199.
- Peters, J., R. van Dam, R. van Doorn, D. Katerere, F. Berthiller, W. Haasnoot, and M. W. F. Nielen. 2017. Mycotoxin profiling of 1000 beer samples with a special focus on craft beer. PLoS One 12 (10):e0185887. doi: 10.1371/journal.pone.0185887.
- Pitt, J. I., and J. D. Miller. 2017. A concise history of mycotoxin research. Journal of Agricultural and Food Chemistry 65 (33):7021–33. doi: 10.1021/acs.jafc.6b04494.
- Pleadin, J., M. Zadravec, T. Lešić, N. Vahčić, J. Frece, M. Mitak, and K. Markov. 2018. Co-occurrence of ochratoxin a and citrinin in unprocessed cereals established during a three-year investigation period. Food Additives & Contaminants: Part B 11 (1):20–5. doi: 10.1080/19393210.2017.1389994.
- Puel, O., P. Galtier, and I. P. Oswald. 2010. Biosynthesis and toxicological effects of patulin. Toxins 2 (4):613–31. doi: 10.3390/toxins2040613.
- Rofiat, A. S., F. Fanelli, O. Atanda, M. Sulyok, G. Cozzi, S. Bavaro, R. Krska, A. F. Logrieco, and C. N. Ezekiel. 2015. Fungal and bacterial metabolites associated with natural contamination of locally processed rice (Oryza sativa L.) in Nigeria. Food Additives & Contaminants: Part A 32:950–9. doi: 10.1080/19440049.2015.1027880.
- SCF. 1999. Opinion of the Scientific Committee on Food on Fusarium toxins. Part 1: Deoxynivalenol (DON). Scientific Committee on Food. Accessed February 15, 2018. https://ec.europa.eu/food/sites/food/files/safety/docs/cs_contaminants_catalogue_out44_en.pdf.
- SCF. 2000a. Opinion of the Scientific Committee on Food on Fusarium toxins. Part 2: Zearalenone (ZEA). Scientific Committee on Food. Accessed February 15, 2018. https://ec.europa.eu/food/sites/food/files/safety/docs/cs_contaminants_catalogue_out65_en.pdf.
- SCF. 2000b. Minute statement on patulin. Expressed by the Scientific Committee on Food during the plenary meeting on 8 March 2000. Scientific Committee on Food. Accessed March 5, 2018. https://ec.europa.eu/food/sites/food/files/safety/docs/cs_contaminants_catalogue_patulin_out55_en.pdf.
- SCOOP. 2002. Assessment of dietary intake of patulin by the population of EU Member States, Reports on tasks for scientific cooperation, Report of experts participating in Task 3.2.8, March 2002. Directorate-General Health and Consumer Protection.
- Shephard, G. 2008. Risk assessment of aflatoxins in food in Africa. Food Additives & Contaminants. Part A, Chemistry, Analysis, Control, Exposure & Risk Assessment 25 (10):1246–56. doi: 10.1080/02652030802036222.
- Shephard, G. S., H. M. Burger, L. Gambacorta, Y. Y. Gong, R. Krska, J. P. Rheeder, M. Solfrizzo, C. Srey, M. Sulyok, A. Visconti, et al. 2013. Multiple mycotoxin exposure determined by urinary biomarkers in rural subsistence farmers in the former Transkei, South Africa. Food and Chemical Toxicology 62:217–25. doi: 10.1016/j.fct.2013.08.040.
- Sieger, M., G. Kos, M. Sulyok, M. Godejohann, R. Krska, and B. Mizaikoff. 2017. Portable infrared laser spectroscopy for on-site mycotoxin analysis. Scientific Reports 7 (1):44028. doi: 10.1038/srep44028.
- Simader, A. M., B. Kluger, N. K. N. Neumann, C. Bueschl, M. Lemmens, G. Lirk, R. Krska, and R. Schuhmacher. 2015. QCScreen: A software tool for data quality control in LC-HRMS based metabolomics. BMC Bioinformatics 16 (1):341. doi: 10.1186/s12859-015-0783-x.
- Stiborová, M., V. M. Arlt, and H. H. Schmeiser. 2016. Balkan endemic nephropathy: An update on its aetiology. Archives of Toxicology 90 (11):2595–615. doi: 10.1007/s00204-016-1819-3.
- Streit, E., K. Naehrer, I. Rodrigues, and G. Schatzmayr. 2013. Mycotoxin occurrence in feed and feed raw materials worldwide: Long-term analysis with special focus on Europe and Asia. Journal of the Science of Food and Agriculture 93 (12):2892–9. doi: 10.1002/jsfa.6225.
- Topi, D., B. Jakovac-Strajn, K. Pavšič-Vrtač, and G. Tavčar-Kalcher. 2017. Occurrence of ergot alkaloids in wheat from Albania. Food Additives & Contaminants. Part A, Chemistry, Analysis, Control, Exposure & Risk Assessment 34 (8):1333–43. doi: 10.1080/19440049.2017.1307528.
- Uhlig, S., G. Eriksen, I. Hofgaard, R. Krska, E. Beltrán, and M. Sulyok. 2013. Faces of a changing climate: Semi-quantitative multi-mycotoxin analysis of grain grown in exceptional climatic conditions in Norway. Toxins 5 (10):1682–97. doi: 10.3390/toxins5101682.
- Van der Fels-Klerx, H., J. E. Olesen, M. Madsen, and P. Goedhart. 2012a. Climate change increases deoxynivalenol contamination of wheat in North-Western Europe. Food Additives & Contaminants: Part A 29 (10):1593–604. doi: 10.1080/19440049.2012.691555.
- Van der Fels-Klerx, H., J. E. Olesen, L.-J. Naustvoll, Y. Friocourt, M. Mengelers, and J. Christensen. 2012b. Climate change impacts on natural toxins in food production systems, exemplified by deoxynivalenol in wheat and diarrhetic shellfish toxins. Food Additives & Contaminants: Part A 29 (10):1647–59. doi: 10.1080/19440049.2012.714080.
- Van der Fels-Klerx, H. J., C. Liu, and P. Battilani. 2016. Modelling climate change impacts on mycotoxin contamination. World Mycotoxin Journal 9 (5):717–26. doi: 10.3920/WMJ2016.2066.
- Vanheule, A., K. Audenaert, M. De Boevre, S. Landschoot, B. Bekaert, F. Munaut, M. Eeckhout, M. Höfte, S. De Saeger, and G. Haesaert. 2014. The compositional mosaic of Fusarium species and their mycotoxins in unprocessed cereals, food and feed products in Belgium. International Journal of Food Microbiology 181:28–36. doi: 10.1016/j.ijfoodmicro.2014.04.012.
- Varga, E., T. Glauner, F. Berthiller, R. Krska, R. Schuhmacher, and M. Sulyok. 2013. Development and validation of a (semi-)quantitative UHPLC-MS/MS method for the determination of 191 mycotoxins and other fungal metabolites in almonds, hazelnuts, peanuts and pistachios. Analytical and Bioanalytical Chemistry 405 (15):5087–104. doi: 10.1007/s00216-013-6831-3.
- Warth, B., A. Parich, J. Atehnkeng, R. Bandyopadhyay, R. Schuhmacher, M. Sulyok, and R. Krska. 2012. Quantitation of mycotoxins in food and feed from Burkina Faso and Mozambique using a modern LC-MS/MS multitoxin method. Journal of Agricultural and Food Chemistry 60 (36):9352–63. doi: 10.1021/jf302003n.
- Warth, B., A. Parich, C. Bueschl, D. Schoefbeck, N. K. N. Neumann, B. Kluger, K. Schuster, R. Krska, G. Adam, M. Lemmens, and R. Schuhmacher. 2015. GC-MS based targeted metabolic profiling identifies changes in the wheat metabolome following deoxynivalenol treatment. Metabolomics 11 (3):722–38. doi: 10.1007/s11306-014-0731-1.
- WHO. 1990. Selected mycotoxins: Ochratoxins, trichothecenes, ergot. Environmental Health Criteria Monographs. United Nations Environment Programme, International Labour Organisation, World Health Organization. International Programme on Chemical Safety, Environmental Health Criteria 105.
- WHO. 2000. Fumonisin B1. Environmental Health Criteria Monographs. United Nations Environment Programme, International Labour Organisation, World Health Organization. International Programme on Chemical Safety. Environmental Health Criteria 219.
- WHO. 2018. FOSCOLLAB Database. Chemical Overview Dashboard – Integrated summary elements from JECFA Evaluations Database, GEMS/Food Contaminants database and the WHO Collaborating Centres Database. Accessed 13 March 2018. https://extranet.who.int/sree/Reports?op=vs_html&path=/WHO_HQ_Reports/G7/PROD/EXT/chemical_overview&userid=G7_ro&password=inetsoft123.
- Wu, F., and N. J. Mitchell. 2016. How climate change and regulations can affect the economics of mycotoxins. World Mycotoxin Journal 9 (5):653–63. doi: 10.3920/WMJ2015.2015.