
Abstract
Whole grain (WG) intake has been associated with reduced risk of type 2 diabetes (T2D) and may protect against T2D by lowering postprandial glycemia and insulinemia and improving insulin sensitivity. The objective of this systematic review and meta-analysis was to evaluate the effect of WG intake, compared to refined grain (RG) intake, on postprandial glycemia and insulinemia and markers of glycemic control and insulin resistance in randomized controlled trials (RCTs) in adults. A search of PubMed and Scopus yielded 80 relevant RCTs. Compared to RG, WG intake significantly reduced postprandial glycemia (SMD: −0.30; 95% CI: −0.43, −0.18; P < 0.001), insulinemia (SMD: −0.23; 95% CI: −0.35, −0.10; P < 0.001) and glycated hemoglobin (HbA1c) (SMD: −0.21; 95% CI: −0.37, −0.06; P = 0.007). There was no effect of WG on fasting glucose, fasting insulin, or homeostatic model assessment of insulin resistance (HOMA-IR). These results suggest WG foods improve short-term glycemia and insulinemia, which may improve HbA1c, a marker of long-term glycemic control. This may partially explain the inverse association between WG intake and risk of T2D, but further investigations are needed to understand if short-term reductions in glycemia translate to longer term benefits in reducing the risk of T2D.
Systematic Review Registration: PROSPERO Registration CRD42020180069.
Supplemental data for this article is available online at https://doi.org/10.1080/10408398.2021.2017838
Introduction
Whole grains (WG) have been defined as intact, ground, cracked or flaked grain kernels that contain all three anatomical components – endosperm, bran, and germ – in the same relative proportions as they exist in the intact kernel (American Association of Cereal Chemists International Citation1999; Van Der Kamp et al. Citation2014). Compared to RGs that typically have most or all of the bran and germ removed, WGs have more fiber, B vitamins and several minerals. Consequently, many health authorities recommend WG as part of a healthy eating pattern (Health Canada Citation2013; Public Health England Citation2016; U.S. Department of Agriculture and U.S. Department of Health and Human Services Citation2020), but around the globe, many individuals continue to consume more RG foods than WG foods.
Observational studies have consistently shown higher intake of WGs to be associated with lower risks for several chronic diseases, particularly type 2 diabetes (T2D) (Al Essa et al. Citation2015; Hu et al. Citation2020; Parker et al. Citation2013; Reynolds et al. Citation2019; Schwingshackl et al. Citation2017; Seal and Brownlee Citation2015). In fact, a recent umbrella review found the observational evidence for WG intake and reduced risk of T2D was stronger than for any other metabolic disease (Tieri et al. Citation2020). RCTs have been conducted to assess possible mechanisms that may account for the reduction of T2D risk with increasing WG intake. Most studies have focused on the effect of WG on postprandial glycemia and insulinemia as well as long-term markers of glucose control, such as insulin sensitivity and glucose tolerance. Dietary fiber and resistant starches found in WG have the potential to influence digestion and absorption of glycemic carbohydrates (Jovanovski et al. Citation2019). Additionally, fermentation of fiber and resistant starch can lead to the formation of short chain fatty acids (SCFA) which may influence gastrointestinal hormone secretions. These incretin hormones can amplify the insulin response to ingested carbohydrates and slow gastric emptying which may improve glycemic and insulinemic responses at subsequent meals or across the day (Canfora, Jocken, and Blaak Citation2015; Müller et al. Citation2019). WGs also have high antioxidant capacity, and some have proposed these antioxidants may protect against oxidative damage to pancreatic beta-cells, although data from humans to support this hypothesis are limited (Pereira et al. Citation2002; Seal and Brownlee Citation2015; Slavin Citation2003). Results from in vitro studies have suggested phenolics found in grains may also be able to influence digestion and absorption of starches (M. Li et al. Citation2017).
Recent meta-analyses have summarized RCTs on WGs and glycemia with a focus on types of WG (Musa-Veloso et al. Citation2020; Musa-Veloso et al. Citation2018) or specific populations (e.g., healthy individuals) (Marventano et al. Citation2017). However, there are no meta-analyses examining multiple types of WG in different populations (healthy and with metabolic dysfunction). Therefore, the purpose of this systematic review and meta-analysis was to evaluate the impact of WG foods, compared to RG foods, on short-term and longer-term markers of glycemia and insulinemia in RCTs in healthy adults and adults with metabolic dysfunction (e.g., T2D, metabolic syndrome). The primary outcomes were postprandial glycemia and insulinemia and the secondary outcomes were postprandial glycemia and insulinemia at a subsequent meal, fasting glucose, fasting insulin, glycated hemoglobin (HbA1c), homeostasis model assessment of insulin resistance (HOMA-IR), and glucose tolerance as assessed by an oral glucose tolerance test (OGTT).
Methods
Literature searches
This systematic review and meta-analysis followed the Preferred Reporting Items for Systematic Reviews and Meta-Analyses (PRISMA) guidelines (Moher et al. Citation2009). The PubMed and SCOPUS® databases were utilized to conduct a comprehensive literature search which covered studies published from 1946 through April 2020. The search was designed to identify publications of RCTs that examined WG intake from intact WGs (e.g., oats, wheat, brown rice, etc.) or foods made with WGs (e.g., muffins, ready-to-eat breakfast cereals, etc.) and outcomes related to glycemia and insulinemia, including postprandial glucose and insulin, fasting glucose and insulin, insulin resistance measures (e.g., HOMA-IR, Matsuda Index), glucose tolerance measures, and HbA1c. Full details on search terms are provided in (Supplemental Table 1). An updated literature search was performed again in December 2020 in PubMed only to identify relevant studies published since the initial search. No additional studies were identified.
Inclusion and exclusion criteria
Inclusion criteria consisted of RCTs conducted in adult humans (≥18 y of age), published in English language, WG or WG-containing foods as the main intervention compared to RG foods as a control, documented (or the ability to determine) quantitative intake of WG, and a measurement of glycemia or insulinemia. Exclusion criteria included observational studies (cross-sectional, retrospective or prospective cohorts), case-control or single-arm studies with no control condition, studies in animals or in vitro, studies without a RG control, multicomponent interventions where the effect of WG cannot be determined, interventions on individual grain components (e.g., bran) or dietary supplements, studies in children (<18 y of age) or pregnant/lactating women, and interventions administered via tube feeding or enteral nutrition. Except for T2D mellitus, obesity, or metabolic syndrome, studies in subjects with a chronic disease were also excluded.
Screening and data extraction
After removal of duplicate publications, first level screening of titles and abstracts was completed independently by a member of the research team using Abstrackr (http://abstrackr.cebm.brown.edu/). Full texts of potentially eligible publications were obtained for further review. Publications that were unclear with respect to eligibility were discussed among the research team to determine inclusion or exclusion. Reference lists from relevant publications were reviewed to determine any additional studies for inclusion. One reviewer extracted PICO (population, intervention, comparator and outcome) data from the eligible studies into a database which was then verified for accuracy independently by a second reviewer. Discrepancies were resolved by discussion among the research team by referencing the original publication. Based on the original PROSPERO registered protocol, outcomes extracted from eligible studies included acute postprandial glycemia and insulinemia, fasting glucose and insulin, markers of insulin resistance and HbA1c. During the data extraction several publications measuring postprandial glycemia and insulinemia at subsequent meals (i.e., WG fed at evening meal, postprandial glycemia measured next morning after standardized breakfast) were identified, thus, these two outcomes were also included in the data extraction.
In publications where outcomes were reported in bar graphs, means and standard deviation (SD) or standard error of the mean (SEM) were estimated using Engauge Digitizer software version 2.14 (http://digitizer.sourceforge.net/) and included in the database. If studies reported measuring glycemic or insulinemic response but did not report the data or the variability, the corresponding author was contacted by email to request the quantitative data. One author responded with additional data for inclusion in the meta-analysis. One publication (Breen et al. Citation2013) did not report SDs or SEMs for postprandial insulin and the email address of the corresponding author was no longer valid, therefore, the SDs for the outcomes were estimated as the third quartile SD reported by other studies of similar duration.
For studies that did not include the amount of WG in the final food, the test food recipes or commercial label information was reviewed. In the case of low moisture foods, such as flakes or pasta, the % WG in the dry ingredients of the recipe was estimated as the % WG of the final food. For higher moisture foods, such as bread, the % WG in the dry ingredients of the recipe was estimated as the % WG of the final food after adjustment for the moisture content. The moisture content of the final food was determined by values provided in the publication, when available. When not provided in the publication, moisture content was estimated using Food Data Central from the USDA Agriculture Research Service (US Department of Agriculture ARS Citation2019).
Assessment of study quality
Risk of bias was assessed with the Cochrane risk of bias tool for randomized trials (Sterne et al. Citation2019), using the appropriate tool for parallel and crossover studies. The Grading of Recommendations Assessment, Development and Evaluation (GRADE) method (Guyatt et al. Citation2008) was utilized by the research team to evaluate the quality of evidence for each outcome.
Statistical analysis
Meta-analyses were completed using Comprehensive Meta-Analysis Software version 3 (Biostat, Englewood, NJ). All glycemia and insulinemia measures were identified as the main outcomes, but as acute postprandial measures were the most frequently measured outcome, postprandial glycemic and insulinemic response were selected after the data extraction, but prior to data analysis, to be the primary outcomes. The primary analysis for postprandial glycemia and insulinemia used pooled standardized mean difference (SMD) estimates (WG versus RG control) and 95% confidence intervals (CI) for area under the curve (AUC) of postprandial glucose (mmol × timeframe/L) and insulin (nmol × timeframe/L). For studies reporting multiple timeframes for AUC measurement (e.g., 120 min and 180 min), only the longest time frame was included in the main analysis. SMDs express the effect size relative to the standard deviation and do not have units. This approach enables pooling of measurements taken using different scales or measurement timeframes (e.g., 120 min, 180 min, etc.). SMDs should not be interpreted as true differences in means between the test and control because the difference in means is divided by the standard deviation. The primary analysis for other outcomes used pooled SMD estimates (WG versus RG control) and 95% CIs for change from baseline in fasting values of glucose (mmol/L) and insulin (pmol/L), AUCs for OGTT (mmol x timeframe/L) and means of HOMA-IR and HbA1c (%). Individual study SMDs were computed using the mean and variance (or SEM) for within-treatment changes, when reported. Otherwise, the mean change within each treatment was computed as the mean of the treatment values minus the mean of the baseline value. The SEM for mean change was computed using an imputed within-treatment correlation of 0.59 (Balk et al. Citation2012). Statistical significance for individual study and pooled SMDs was declared when the 95% CI does not include the null value of 0 (i.e., p-value < 0.05). Studies were weighted according to the inverse of the variance of each study’s effect using random effects models. Random effects models were chosen for the primary analyses due to differences across studies in key design elements such as subject characteristics, type of WG and length of test period. Fixed effects models were also evaluated as sensitivity analyses. The magnitude of effect sizes were interpreted as < 0.40 = small, 0.40 − 0.70 = moderate and > 0.70 = large (Schünemann et al. Citation2019).
Data from parallel and crossover RCTs were entered into the software using the following data entry formats: “Independent groups (means, SD)” and “Paired groups (means, SD)”, respectively. SMDs and corresponding SEMs for individual studies were computed by the software using the methods for independent groups and matched groups described by Borenstein et al. (Citation2009a) and an imputed between-treatment correlation of 0.50 for matched groups. Sensitivity analyses were performed for the primary analyses assuming no between-treatment correlation for matched groups and the results were similar. For multiple comparisons within a study (i.e., comparisons that shared a common active or control group or comprised data from the same subjects), individual effect size estimates and variances were computed for all comparisons within a study. A pooled effect size estimate was then computed as the weighted average of the individual effect size estimates. The corresponding pooled effect variance was computed as the variance of a linear combination of two or more variables (i.e., average of two or more effect size estimates) using between-comparison correlations equivalent to the weighted average of the between-WG correlation and the between-control correlation (Borenstein et al. Citation2009b). A single pooled effect size estimate and variance was then included in the analysis for each study with multiple comparisons. Effect size estimates were pooled in a stepwise manner, pooling estimates for comparisons that shared an intervention first followed by those that comprised data from the same subjects. When multiple comparisons included in a subgroup or sensitivity analysis varied from those included in the primary analysis, the above steps were repeated prior to running the subgroup or sensitivity analysis.
Sensitivity analyses were completed for postprandial glycemia and insulinemia measurements to determine if different timeframes for AUC measurement may have impacted the results. This was achieved by analyzing AUC measurements ≤120 and >120 min separately. For studies with multiple time frames, all time frames were included in the sensitivity analyses. Multiple timeframes ≤120 min or >120 min were handled similarly to multiple comparisons using a within-treatment correlation of 0.59. Sensitivity analyses removing studies with high-amylose varieties of grains were also performed. For other outcomes, sensitivity analyses were completed using a one-study-removed analysis.
Subgroup analyses were performed on acute postprandial glycemia and insulin for type of WG, same grain in treatment and control, similar processing for the treatment and control, amount of WG consumed (≤ median or > median), feeding approach (available carbohydrates matched or not matched), health status (healthy, overweight/obese, T2D, metabolic syndrome), and sex (male or female). Subgroup analyses for fasting glucose and insulin included type of WG, amount of WG consumed (≤ median or > median), study design (crossover, parallel), study duration (≤ median or > median) and health status (healthy, overweight/obese, metabolic dysfunction). Subgroup analyses were not possible for HbA1c, HOMA-IR or OGTT due to a small number of studies in the main analysis.
Statistical heterogeneity across studies was assessed using Cochran’s Q test and the I2 statistic. An I2 value of ≥40% was used to designate moderate or higher heterogeneity, as recommended by the Cochrane Handbook (Deeks, Higgins, and Altmann Citation2019). Treatment effects in subgroups were compared by using Cochran’s Q test to assess heterogeneity between subgroup estimates. Chi-square test statistics and p-values are reported for Cochran’s Q tests for heterogeneity across studies and between subgroups. The presence of publication bias was assessed by Egger’s test and examining funnel plots measuring the SEM as a function of the SMD.
Results
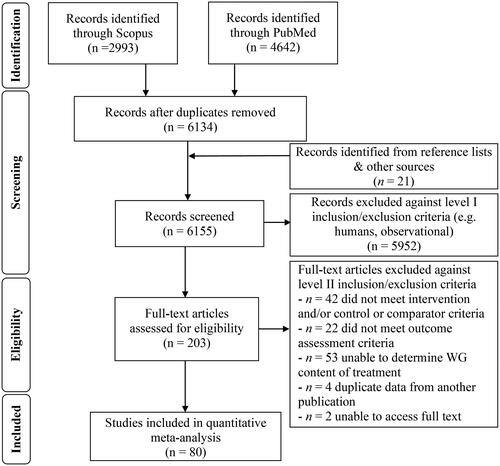
A flow diagram of the literature search process is shown in . Eighty studies were eligible for the systematic review and provided data for use in the meta-analysis (Aldughpassi, Abdel-Aal el, and Wolever Citation2012; Ampatzoglou et al. Citation2015, Citation2016; Anderson et al. Citation2010; Andersson et al. Citation2007; Belobrajdic et al. Citation2019; Breen et al. Citation2013; Brownlee et al. Citation2010; Cioffi et al. Citation2016; Costabile et al. Citation2018; De Carvalho et al. Citation2014; Gabrial, Shakib, and Gabrial Citation2016; Geliebter et al. Citation2015; Giacco et al. Citation2014; Gonzalez-Anton et al. Citation2015; Granfeldt, Hagander, and Bjorck Citation1995; Granfeldt et al. Citation1994; Hagander et al. Citation1985, Citation1987; Hallstrom et al. Citation2011; Hamad, Zafar, and Sidhu Citation2018; Harris Jackson et al. Citation2014; Hartvigsen et al. Citation2014a, Citation2014b; Hlebowicz et al. Citation2007; Holm and Bjorck Citation1992; Jenkins et al. Citation1981; E. V. Johansson et al. Citation2013; D. P. Johansson et al. Citation2015; Juntunen et al. Citation2003; Karl et al. Citation2017; Kikuchi et al. Citation2018; Kirwan et al. Citation2016; Kondo et al. Citation2017; Kristensen et al. Citation2010; Kristensen et al. Citation2012; Lee et al. Citation2017; J. Li et al. Citation2003; L. Li et al. Citation2018; Lia and Andersson Citation1994; Liljeberg and Bjorck Citation1994; Luhovyy et al. Citation2014; Malin et al. Citation2018, Citation2019; Marinangeli, Kassis, and Jones Citation2009; Najjar et al. Citation2009; Nilsson, Johansson-Boll, and Bjorck Citation2015; Nilsson et al. Citation2016; Nilsson et al. Citation2008a; Nilsson et al. Citation2008b; Nilsson et al. Citation2008c; Nordlund et al. Citation2016; O’Dea, Nestel, and Antonoff Citation1980; Osman, Mohd-Yusof, and Ismail Citation2017; Pins et al. Citation2002; RamyaBai et al. Citation2019; Ranawana et al. Citation2009; Roager et al. Citation2019; Rosen, Ostman, and Bjorck Citation2011a, Citation2011b; Rosen et al. Citation2009, Citation2011, Citation2011c; Saltzman et al. Citation2001; Sandberg, Bjorck, and Nilsson Citation2016; Sandberg, Bjorck, and Nilsson Citation2017; Schutte et al. Citation2018; Se et al. Citation2016; Shobana et al. Citation2017; Soong, Quek, and Henry Citation2015; Stringer et al. Citation2013; Vitaglione et al. Citation2015; Wolever et al. Citation2016, Citation2018, Citation2019a, Citation2019b; Zafar et al. Citation2015; Zafar, Kabir, and Ghazaii Citation2011; Zhang et al. Citation2011; Zhu et al. Citation2019). Fifty-two studies measured acute postprandial glycemia or insulinemia (Aldughpassi, Abdel-Aal el, and Wolever Citation2012; Anderson et al. Citation2010; Belobrajdic et al. Citation2019; Breen et al. Citation2013; Cioffi et al. Citation2016; Costabile et al. Citation2018; Gabrial, Shakib, and Gabrial Citation2016; Geliebter et al. Citation2015; Gonzalez-Anton et al. Citation2015; Granfeldt, Hagander, and Bjorck Citation1995; Granfeldt et al. Citation1994; Hagander et al. Citation1985, Citation1987; Hallstrom et al. Citation2011; Hamad, Zafar, and Sidhu Citation2018; Hartvigsen et al. Citation2014a, Citation2014b; Hlebowicz et al. Citation2007; Holm and Bjorck Citation1992; Jenkins et al. Citation1981; D. P. Johansson et al. Citation2015; Juntunen et al. Citation2003; Kondo et al. Citation2017; Kristensen et al. Citation2010; Lee et al. Citation2017; L. Li et al. Citation2018; Lia and Andersson Citation1994; Liljeberg and Bjorck Citation1994; Luhovyy et al. Citation2014; Marinangeli, Kassis, and Jones Citation2009; Najjar et al. Citation2009; Nilsson et al. Citation2008c; Nordlund et al. Citation2016; O’Dea, Nestel, and Antonoff Citation1980; Osman, Mohd-Yusof, and Ismail Citation2017; RamyaBai et al. Citation2019; Ranawana et al. Citation2009; Rosen, Ostman, and Bjorck Citation2011a, Citation2011b; Rosen et al. Citation2009, Citation2011c; Se et al. Citation2016; Shobana et al. Citation2017; Soong, Quek, and Henry Citation2015; Stringer et al. Citation2013; Wolever et al. Citation2016, Citation2018, Citation2019a, Citation2019b; Zafar et al. Citation2015; Zafar, Kabir, and Ghazaii Citation2011; Zhu et al. Citation2019) and 13 studies measured subsequent meal postprandial glycemia or insulinemia (Anderson et al. Citation2010; Gabrial, Shakib, and Gabrial Citation2016; Hartvigsen et al. Citation2014a; E. V. Johansson et al. Citation2013; Lee et al. Citation2017; Najjar et al. Citation2009; Nilsson, Johansson-Boll, and Bjorck Citation2015; Nilsson et al. Citation2016, Citation2008a, Citation2008b, Citation2008c; Sandberg, Bjorck, and Nilsson Citation2016; Sandberg, Bjorck, and Nilsson Citation2017). Twenty-two studies measured fasting glucose or insulin and were chronic in design ranging from two weeks to 16 weeks (Ampatzoglou et al. Citation2016; Andersson et al. Citation2007; Brownlee et al. Citation2010; De Carvalho et al. Citation2014; Giacco et al. Citation2014; Harris Jackson et al. Citation2014; Karl et al. Citation2017; Kikuchi et al. Citation2018; Kirwan et al. Citation2016; Kondo et al. Citation2017; Kristensen et al. Citation2012; J. Li et al. Citation2003; L. Li et al. Citation2018; Malin et al. Citation2018, Citation2019; Pins et al. Citation2002; Roager et al. Citation2019; Ross et al. Citation2011; Saltzman et al. Citation2001; Schutte et al. Citation2018; Vitaglione et al. Citation2015; Zhang et al. Citation2011). Nine of these studies were crossover in design (Ampatzoglou et al. Citation2015; Andersson et al. Citation2007; Kirwan et al. Citation2016; J. Li et al. Citation2003; L. Li et al. Citation2018; Malin et al. Citation2018, Citation2019; Roager et al. Citation2019; Ross et al. Citation2011) with 13 parallel trials (Brownlee et al. Citation2010; De Carvalho et al. Citation2014; Giacco et al. Citation2014; Harris Jackson et al. Citation2014; Karl et al. Citation2017; Kikuchi et al. Citation2018; Kondo et al. Citation2017; Kristensen et al. Citation2012; Pins et al. Citation2002; Saltzman et al. Citation2001; Schutte et al. Citation2018; Vitaglione et al. Citation2015; Zhang et al. Citation2011). WG intake in chronic studies ranged from 25 g/day to 207 g/day while postprandial studies ranged from 11 g to 254 g. The WGs tested included rye, wheat, oat, barley, corn, rice, buckwheat and quinoa. Chronic studies used either WG wheat or a mix of different types of WG. Most postprandial studies were in healthy subjects with only 11 in subjects with overweight/obesity, T2D, or metabolic syndrome (Breen et al. Citation2013; Gabrial, Shakib, and Gabrial Citation2016; Geliebter et al. Citation2015; Hagander et al. Citation1985, Citation1987; Hartvigsen et al. Citation2014a, Citation2014b; L. Li et al. Citation2018; Lia and Andersson Citation1994; Najjar et al. Citation2009; Stringer et al. Citation2013). Conversely, chronic studies were primarily in subjects with overweight/obesity or metabolic dysfunction (e.g., T2D, one or more symptoms of metabolic syndrome). Study characteristics are provided in Supplemental Table 2.
Figure 1. Flow diagram of literature search process for the effect of whole grain, compared to refined grain, on short-term and long-term measures of glycemia and insulinemia.
WG intake and postprandial glycemia
Overall, 127 comparisons reported in 52 studies were included in the analysis of WG on postprandial glycemia. Intake of WG foods resulted in significantly lower postprandial glycemia compared to RG foods (, SMD: −0.30; 95% CI: −0.43, −0.18; P < 0.001) although the effect size was small in magnitude and the data displayed substantial heterogeneity (Q = 183; P < 0.001; I2 = 68.8). A sensitivity analysis (Supplemental Table 3) showed a larger effect size when AUC measurements ≤ 120 min and slightly smaller effect size at > 120 min but the effect of WG remained significant in both time frames and heterogeneity remained substantial. Additionally, removal of studies utilizing high amylose varieties did not substantially impact the results.
Table 1. Effect of WG intake, compared to RG intake, on postprandial glycemia in adults.
Subgroup analyses are shown in . The effect of WG on postprandial glycemia remained significant for all types of WG (P < 0.05) except rice, and there was significant heterogeneity between the subgroups (Q = 14.5, P = 0.043). Quinoa and buckwheat showed large effect sizes, but there were few studies on these grains and one study demonstrated unusually large SMDs (Gabrial, Shakib, and Gabrial Citation2016). The effect of WG remained significant at intakes above and below the median (79.1 g) with a similar effect size (−0.37 and −0.31, respectively, P ≤ 0.002). When the same grain was included in the test and control conditions (e.g., WG barley vs RG barley) the effect of WG remained significant for rice and wheat (p < 0.05), but not barley or rye. The impact of processing was most substantial for wheat with no significant difference in postprandial glycemia when WG wheat was provided as a flour. The feeding approach was also critical as studies that did not match available carbohydrate (e.g., matched energy or volume) showed a non-significant reduction in postprandial glycemia with WG intake.
Table 2. Subgroup analysis for the effect of WG, compared to RG, on postprandial glycemia in adults.
Interestingly, the effect of WG on postprandial glycemia was significant in healthy individuals (P < 0.001) but not in overweight/obese individuals or those with T2D. WG intake also significantly reduced postprandial glycemia in males (P = 0.016), but not females (P = 0.223), but very few studies limited inclusion to only men or women.
WG intake, compared to RG intake, did not impact postprandial glycemia at a subsequent meal (Supplemental Table 4, SMD: −0.01; 95% CI: −0.40, 0.38; P = 0.956), although there was significant heterogeneity between the studies (Q = 99.5; P < 0.001; I2 = 86.9).
WG intake and postprandial insulinemia
In 68 comparisons from 30 studies, WG intake resulted in a significantly lower postprandial insulinemic response compared to RG foods, although the effect size was small (, SMD: −0.23; 95% CI: −0.35, −0.10; P < 0.001) and there was moderate heterogeneity (Q = 54.5; P < 0.006; I2 = 43.1). A sensitivity analysis showed small changes in effect size when AUC measurements ≤ 120 min and > 120 min, but the effect of WG remained significant in both time frames and heterogeneity was moderate to substantial (Supplemental Table 3).
Table 3. Effect of WG intake, compared to RG intake, on postprandial insulinemia in adults.
Subgroup analyses are shown in . Only barley and rice significantly reduced the postprandial insulinemic response with a moderate effect size (P < 0.03), although rye and wheat approached significance (P < 0.06 and P < 0.07, respectively). The effect of barley remained significant when WG barley was processed to flour (P = 0.03). In studies with the same grain in the WG and control conditions, only WG rice reduced postprandial insulinemia (P = 0.025), and there was significant between subgroup heterogeneity (Q = 7.4, P = 0.025). This heterogeneity was likely driven by a small, non-significant increase in postprandial insulinemia in the rye subgroup, while wheat and rice directionally decreased postprandial insulinemia. Similar to postprandial glycemia, the effect of WG remained significant at intakes above and below the median (82.4 g, P < 0.01) and was only observed in studies with matched available carbohydrate. Additionally, the effect of WG was significant in healthy individuals (P = 0.002), but not in individuals with overweight/obesity or T2D. Although there were few studies in men or women only, the impact of WG on postprandial insulinemia did not differ by sex.
Table 4. Subgroup analysis for the effect of WG, compared to RG on postprandial insulinemia in adults.
Unlike postprandial glycemia, WG intake significantly reduced postprandial insulinemia at a subsequent meal (Supplemental Table 5, SMD: −0.24; 95% CI: −0.39, −0.08; P = 0.002), with minimal heterogeneity (Q = 5.37; P = 0.615; I2 = 0.00).
WG intake and fasting glucose and insulin
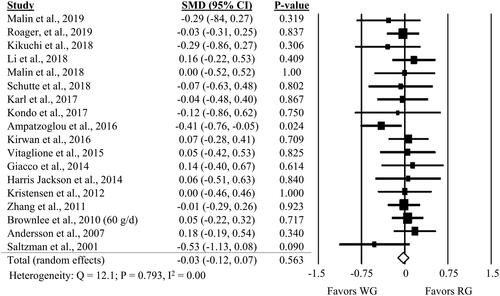
Twenty-three comparisons from 22 studies showed no significant impact of WG compared to RG on fasting glucose (, SMD: −0.11; 95% CI: −0.24, 0.03; P = 0.123). Similar results were observed for fasting insulin (, SMD: −0.03; 95% CI: −0.12, 0.07; P = 0.563). A one-study-removed sensitivity analysis revealed a strong influence of Vitaglione et al. (Citation2015) on fasting glucose results, with the results demonstrating a benefit of WG (P = 0.006) when the comparison from this study is removed (Supplemental Table 6). The one-study-removed sensitivity analysis for fasting insulin did not find any one study to substantially influence the results (Supplemental Table 6).
Figure 2. Forest plot of the meta-analyses on the effect of whole grain, compared to refined grain, on fasting glucose in adults.
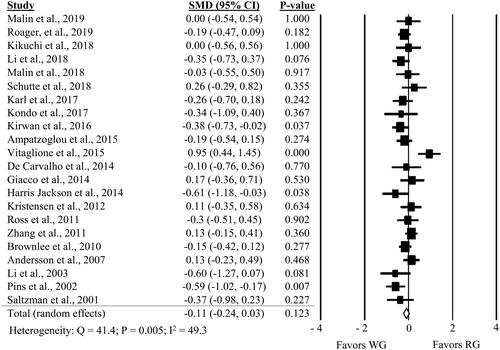
Figure 3. Forest plot of the meta-analyses on the effect of whole grain, compared to refined grain, on fasting insulin in adults.
Subgroup analyses for fasting glucose and insulin are in . Wheat was the only WG tested in isolation and did not significantly impact fasting glucose or insulin (P = 0.121 and 0.646, respectively). However, a significant reduction in fasting glucose was observed in studies with mixed WGs (P = 0.013) and there was significant heterogeneity between the wheat and mixed WG subgroups (Q = 4.7, P = 0.031). The amount of WG consumed and the duration of the testing did not impact the effect of WG on fasting glucose or insulin. However, there was an impact of study design on fasting glucose, with a significant effect of WG in crossover studies (P = 0.010), but not parallel studies. This effect of study design was not observed for fasting insulin. Similar to findings with postprandial glycemia and insulinemia, a significant benefit of WG for fasting glucose and insulin was only observed in healthy individuals (P = 0.027), but not individuals with overweight/obesity or metabolic dysfunction.
Table 5. Subgroup analysis for the effect of WG, compared to RG, on fasting glucose and insulin in adults.
WG intake and markers of glycemic control, insulin resistance and glucose tolerance
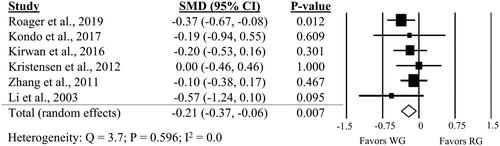
Few studies compared WG intake to RG for other glycemic and insulinemic markers, such as HbA1c, HOMA-IR or glucose tolerance tests. Six studies reported HbA1c, ten studies reported HOMA-IR and three studies conducted OGTTs. There was a small, but significant improvement in HbA1c (; SMD: −0.21; 95% CI: −0.37, −0.06; P = 0.007) and all but one of the studies (J. Li et al. Citation2003) were in individuals with T2D or with risk factors for T2D. WG intake, compared to RG, did not significantly impact HOMA-IR or OGTT outcomes (Supplemental Figures 1–2). There was no significant heterogeneity in any outcomes. A one-study-removed sensitivity analysis showed no influence of individual studies on HOMA-IR, but a small influence of the study by Roager et al. (Citation2019) on HbA1c (Supplemental Table 5).
Figure 4. Forest plot of the meta-analysis on the effect of whole grain, compared to refined grain, on HbA1c in adults.
Quality of evidence
The quality of evidence as assessed by GRADE criteria is summarized in . Evidence for outcomes were rated as moderate to low. The evidence rating for acute and second meal postprandial glucose was downgraded due to concerns about serious inconsistency, moderate imprecision and possible publication bias. Publication bias was also evident for postprandial insulin (P = 0.023). Long term markers of glycemic control and insulin resistance did not have significant publication bias but did show moderate to serious imprecision. Risk of bias assessment on outcomes of individual studies and Egger’s statistics for publication bias are included in Supplemental Table 7 and 8.
Table 6. Quality of evidence included in the systematic review and meta-analysis of WG on measures of glycemia and insulinemia, based on GRADE approach.
Discussion
The results of this meta-analysis of RCTs suggest that WG intake reduces acute postprandial glycemic and insulinemic response and improves HbA1c compared to RG, but does not impact fasting glucose, fasting insulin, HOMA-IR or glucose tolerance. Several reviews and observational studies have shown a consistent inverse association of WG intake with risk and incidence of T2D (Al Essa et al. Citation2015; Hu et al. Citation2020; Parker et al. Citation2013; Tieri et al. Citation2020) and results from this meta-analysis suggests reducing postprandial glycemia and insulinemia may be one mechanism by which WG could protect against T2D. This agrees with results from other meta-analyses that have found a significant effect of WG on postprandial glycemia measures (Marventano et al. Citation2017; Musa-Veloso et al. Citation2020; Musa-Veloso et al. Citation2018; Tosh Citation2013). WGs typically contain more fiber than RGs so the replacement of digestible (available) carbohydrate with non-digestible fiber may help reduce the glycemic response. However, since most studies match available carbohydrate between the WG and RG treatments, there appear to be benefits beyond substitution of digestible carbohydrate for fiber. The additional benefit may be due to the ability of fiber and phenolics to slow the rate of digestion of glycemic carbohydrates or the potential impact of fiber fermentation metabolites on incretin hormones (Jovanovski et al. Citation2019; M. Li et al. Citation2017; Müller et al. Citation2019). Grains rich in beta-glucan, such as oat and barley, may increase viscosity of the intestinal contents during digestion which can limit enzyme accessibility to carbohydrates as well as limit the rate of absorption of free glucose through the intestinal wall.
The results also demonstrate the importance of the type of WG and degree of processing on postprandial glycemic response. In the current study, all WGs, regardless of type, reduced postprandial glycemia (although this did not reach significance for rice). However, for wheat, the impact on postprandial glycemia was lost when the WG was processed to flour. Milling to flour disrupts the structure of the whole grain wheat, making the starchy endosperm more accessible and less protected by the bran (fiber) layer. Depending on the degree of milling, particle size of the grain may also be smaller providing more surface area for digestive enzymes. Interestingly, processing to flour did not impact the benefit of WG barley and corn. However, studies with WG barley flour utilized RG wheat or rice flour as the control (Granfeldt et al. Citation1994; Liljeberg and Bjorck Citation1994; Nilsson et al. Citation2008b; Soong, Quek, and Henry Citation2015) and two of the studies with corn utilized high amylose varieties (Anderson et al. Citation2010; Luhovyy et al. Citation2014). Therefore, these results should be interpreted with caution as it is difficult to differentiate the effects of processing from the effects of different comparator grains or varieties. Unfortunately, there were insufficient studies to evaluate the same grain with the same degree of processing in the same food matrix. In the subgroup where the same grain was used in the treatment and control, there was not a significant difference between the WG and RG versions of barley and rye. This agrees with other meta-analyses (Musa-Veloso et al. Citation2018) and may be partially due to the fiber content of the endosperm and the structure of the starch granules in these two grains. Barley studies compared WG barley kernels to RG pearled barley kernels (Aldughpassi, Abdel-Aal el, and Wolever Citation2012). Pearling is a process which removes the outer bran portion of a WG but does not disrupt the native structure of the endosperm, possibly contributing to slower digestion and yielding little difference in postprandial glycemia between WG and RG. The endosperm of rye also has a higher fiber content than some other grains, such as wheat. For example, one study reported 6.7 g dietary fiber/100 g endosperm rye bread compared to 9.6 g dietary fiber/100 g in WG rye bread and only 1.8 g dietary fiber/100 g in RG wheat bread (Rosen et al. Citation2009). The microstructure of WG and RG rye bread is also less porous than other breads, limiting the accessibility of hydrolytic enzymes. Cooking rye leads to leakage of amylose from the starch granule to form a coating which may further slow enzymatic hydrolysis (Juntunen et al. Citation2003). Thus, RG rye and barley may not differ from their WG counterparts in glycemic response due to these unique structural components.
While the benefit of WG on postprandial glycemia was observed only immediately after consumption, the benefit of WG on postprandial insulinemia was present acutely as well as at a subsequent meal. This suggests the effects of WG consumption on postprandial insulin may be longer term and go beyond the digestibility of carbohydrate. Fibers and resistant starches within WG can be fermented in the large intestine, leading to the production of SCFA. These SCFA have been shown in pre-clinical models to increase glucose oxidation in the liver, stimulate GLP-1, and suppress the production of free fatty acids in the late postprandial period and during an overnight fast, all of which may contribute to improvements in insulin sensitivity (Canfora, Jocken, and Blaak Citation2015; DeFronzo Citation2009; Müller et al. Citation2019). Furthermore, studies in humans have shown a positive association of circulating SCFA with GLP-1 concentrations and an inverse association with free fatty acid concentrations (Müller et al. Citation2019). Thus, the fermentation of fiber and resistant starch in WG may explain part of the improvement in insulin response at subsequent meals.
Beyond acute and subsequent meal effects, the benefit of WG intake on longer term glycemic and insulinemic outcomes was less clear. There was an improvement in HbA1c with WG intake, which suggests the acute benefits of WG on postprandial glycemia may provide a cumulative benefit for glycemic control over time. However, more studies are needed to confirm this finding since the sensitivity analysis revealed this effect may be driven by one influential study (Roager et al. Citation2019). WG intake did not show a benefit for fasting glucose, fasting insulin, HOMA-IR, and glucose tolerance. While these findings are similar to other meta-analyses (Marshall et al. Citation2020; Marventano et al. Citation2017), it is unclear why short-term improvements in postprandial glucose and insulin did not translate to clear long-term benefits in studies with chronic consumption. One consideration for fasting glucose, is the presence of one influential study with surprising results. Vitaglione et al. (Citation2015) found a 6 mg/dL increase in fasting glucose with WG treatment compared to RG treatment. Although it was reported as not significant in the publication and was confirmed through email communications with the author, it appears statistically significant in this meta-analysis and influences the results. The removal of this study from the analysis resulted in a significant improvement in fasting glucose with WG intake. Similarly, a meta-analysis by Marventano et al. (Citation2017) also found an increase in the effect size of WG on fasting glucose when excluding the Vitaglione et al. study. The high degree of influence of this one study suggests it may be overshadowing a small but significant effect of WG on fasting glucose. Study durations may have also been insufficient to produce measurable long-term changes. However, with a median duration of 8 weeks, most of these studies were of sufficient length to predict changes in fasting glucose, fasting insulin, and insulin sensitivity measures.
The study design and type of WG may also explain some of the lack of effect of WG intake on long-term measures of glycemia and insulinemia. Most studies used a mix of WGs which resulted in a significant reduction in fasting glucose, but studies using only wheat did not. Although postprandial analyses show most WGs significantly reduce postprandial glycemia, the effect size is larger for some (e.g., oat, barley) which may offer a greater cumulative benefit over time. Furthermore, the WG foods in three of the four chronic wheat-based studies used WG wheat flour, which did not demonstrate a difference from RG wheat in postprandial glycemia. Additionally, crossover studies resulted in a small, but significant impact on fasting glucose not observed in parallel trials. The lack of effect in the analysis of parallel studies may be partially due to the unusual results in the Vitaglione et al. (Citation2015) study and possibly the substantial heterogeneity in parallel studies (I2 = 62.5). In contrast, heterogeneity was low in crossover studies (I2 = 0.0) with seven of the nine studies reporting a decrease in fasting glucose with WG intake, although only one study reached statistical significance. Taken together, these findings suggest additional studies on the glycemic impact of long-term WG consumption are necessary before stronger conclusions can be drawn.
Differences in acute and chronic study design may also explain divergent findings between long- and short-term outcomes. Most postprandial studies matched available carbohydrate between the WG treatment and RG control, while chronic studies primarily asked subjects to substitute RG foods for WG foods and did not control the remainder of the diet. Thus, the amount of digestible carbohydrate was not controlled in chronic studies as it was in postprandial studies and it is unknown if postprandial glycemic responses were reduced over the study duration. This may be an important consideration as postprandial studies not matching available carbohydrates did not show a significant impact of WG on postprandial glycemia or insulinemia. Nevertheless, the substitution approach is more practical and is aligned to recommendations (e.g., choose whole wheat bread instead of white bread) (Health Canada Citation2013; U.S. Department of Agriculture and U.S. Department of Health and Human Services Citation2020). While matching available carbohydrate may reveal a mechanistic action of WG, it is not the way most people eat. Thus, it would be beneficial to design studies that feed WG over several weeks, but also monitor acute glycemic and insulinemic response to determine if acute improvements in postprandial glycemia and insulinemia contribute to long term benefits of WG on glycemic control. Continuous glucose monitoring may be one way to achieve this. One chronic feeding study implemented 24 hour continuous glucose monitoring at week 2 and week 8 of the WG intervention and found no difference in daily glucose AUC compared to the RG group, but they did not specifically assess postprandial responses (Karl et al. Citation2017).
Differences in health status also impacted the current findings, with studies in healthy individuals showing a benefit of WG intake on postprandial glycemia, insulinemia, and fasting glucose, while studies in overweight/obese individuals or those with metabolic dysfunctions, such as T2D, showed non-significant effect sizes. However, there was a significant reduction in HbA1c with WG intake and all but one of the studies were in individuals with T2D or risk factors for T2D. This supports a potential benefit of long-term WG consumption for glycemic control, particularly for individuals with T2D or at risk of T2D. More acute studies of glycemia and insulinemia are needed in these populations, as there were very few included in this meta-analysis and there is greater baseline variability in glycemia and insulinemia in individuals with T2D or risk factors, such as impaired fasting glucose. Several studies in the current meta-analysis also defined healthy as only an absence of disease with screening criteria that included overweight and normal weight individuals. Future studies should consider evaluating normal weight, overweight, and obese subjects separately as well as evaluating baseline insulin resistance to better understand the potential benefits of WG in healthy and metabolically at-risk populations.
While the body of evidence, particularly for postprandial measures, is large, the quality of the evidence was rated as low to moderate due to issues with publication bias, inconsistency, and imprecision. Publication bias may have been an issue with studies of postprandial glycemia and insulinemia, possibly because these studies typically have a smaller average sample size. Therefore, studies that do not confirm the hypothesis and are small are less likely to be published. Publication bias was not an issue for longer term markers of glycemia and insulinemia, possibly because they utilize large sample sizes and are more likely to be published regardless of outcome. Inconsistency was considered serious for postprandial glycemia, and it is likely several factors contribute to significant heterogeneity. Even after subgrouping by type of WG, degree of processing, health status, sex and other factors, heterogeneity remained substantial.
The strengths of the current systematic review and meta-analysis include a broad scope to cover multiple types of WG, health conditions and outcomes related to short-term and long-term glycemic control. This allowed for several subgroup and sensitivity analyses that identified factors that may impact the effect of WG on glycemic and insulinemic outcomes. However, the systematic review and meta-analysis was also limited by poor reporting of the amount of WG in the studies, resulting in the exclusion of several studies. There was also an indication of publication bias for postprandial outcomes and significant heterogeneity for postprandial glucose that could not be fully explained. There were also an insufficient number of studies to evaluate detailed subgroups, such as similar grain in treatment and control with a similar degree of processing and a similar food matrix.
In summary, the results of this meta-analysis show that intake of WG foods moderately, but significantly reduce postprandial glycemia and insulinemia compared to RG foods. However, the type and variety of WG, degree of processing, and food matrix may have substantial influence that deserve further investigation. WG intake also resulted in a small but significant reduction in HbA1c, but other long-term glycemic and insulinemic markers were not impacted. The relationship of WG intake to reduced risk of T2D may be partially attributable to short term benefits in glycemic control, but more long-term intake studies are needed with individual WGs and with improved measurement of acute postprandial effects to determine whether short-term benefits for postprandial glycemia will translate to longer-term glycemic benefits such as lower incidence of prediabetes and T2D.
Supplemental Material
Download MS Word (616.9 KB)Acknowledgements
The authors responsibilities were as follows – LMS, YZ, KK and KCM contributed to the conception and design of the systematic review and meta-analysis; LMS reviewed the publications, extracted the data and conducted the risk of bias assessment; MLW verified the accuracy of the extraction and analyzed the data; LMS and KCM interpreted the data, performed the GRADE assessment and prepared the manuscript. All authors have read and approved the final manuscript. We also thank Marsha Teuton for her additional review of the data extraction to verify accuracy.
Disclosure statement
KCM, MLW and LMS are employees of Midwest Biomedical Research which has received research funding from General Mills, Inc., Kellogg Company, and the Quaker division of PepsiCo. KK and YZ are employees of General Mills, Inc.
Additional information
Funding
References
- Al Essa, H. B., S. N. Bhupathiraju, V. S. Malik, N. M. Wedick, H. Campos, B. Rosner, W. C. Willett, and F. B. Hu. 2015. Carbohydrate quality and quantity and risk of type 2 diabetes in us women. The American Journal of Clinical Nutrition 102 (6):1543–53. doi: 10.3945/ajcn.115.116558.
- Aldughpassi, A., S. M. Abdel-Aal el, and T. M. Wolever. 2012. Barley cultivar, kernel composition, and processing affect the glycemic index. The Journal of Nutrition 142 (9):1666–71. doi: 10.3945/jn.112.161372.
- American Association of Cereal Chemists International. 1999. Whole grain definition. Cereal Foods World 45:79.
- Ampatzoglou, A., C. L. Williams, K. K. Atwal, C. M. Maidens, A. B. Ross, F. Thielecke, S. S. Jonnalagadda, O. B. Kennedy, and P. Yaqoob. 2016. Effects of increased wholegrain consumption on immune and inflammatory markers in healthy low habitual wholegrain consumers. European Journal of Nutrition 55 (1):183–95. doi: 10.1007/s00394-015-0836-y.
- Ampatzoglou, A., K. K. Atwal, C. M. Maidens, C. L. Williams, A. B. Ross, F. Thielecke, S. S. Jonnalagadda, O. B. Kennedy, and P. Yaqoob. 2015. Increased whole grain consumption does not affect blood biochemistry, body composition, or gut microbiology in healthy, low-habitual whole grain consumers. The Journal of Nutrition 145 (2):215–21. doi: 10.3945/jn.114.202176.
- Anderson, G. H., C. E. Cho, T. Akhavan, R. C. Mollard, B. L. Luhovyy, and E. T. Finocchiaro. 2010. Relation between estimates of cornstarch digestibility by the englyst in vitro method and glycemic response, subjective appetite, and short-term food intake in young men. The American Journal of Clinical Nutrition 91 (4):932–9. doi: 10.3945/ajcn.2009.28443.
- Andersson, A., S. Tengblad, B. Karlstrom, A. Kamal-Eldin, R. Landberg, S. Basu, P. Aman, and B. Vessby. 2007. Whole-grain foods do not affect insulin sensitivity or markers of lipid peroxidation and inflammation in healthy, moderately overweight subjects. The Journal of Nutrition 137 (6):1401–7. doi: 10.1093/jn/137.6.1401.
- Balk, E. M., A. Earley, K. Patel, T. A. Trikalinos, and I. J. Dahabreh. 2012. Empirical assessment of within-arm correlation imputation in trials of continuous outcomes. Methods Research Reports. Agency for Healthcare Research and Quality, Rockville, MD.
- Belobrajdic, D. P., A. Regina, B. Klingner, I. Zajac, S. Chapron, P. Berbezy, and A. R. Bird. 2019. High-amylose wheat lowers the postprandial glycemic response to bread in healthy adults: A randomized controlled crossover trial. The Journal of Nutrition 149 (8):1335–45. doi: 10.1093/jn/nxz067.
- Borenstein, M., L. V. Hedges, J. Higgins, and H. R. Rothstein. 2009a. Effect sizes based on means. In Introduction to meta‐analysis, eds. M. Borenstein, L. V. Hedges, J. Higgins and H. R. Rothstein, 21–32. Hoboken, NJ: Wiley.
- Borenstein, M., L. V. Hedges, J. Higgins, and H. R. Rothstein. 2009b. Multiple outcomes or time-points within a study. In Introduction to meta‐analysis, eds. M. Borenstein, L. V. Hedges, J. Higgins and H. R. Rothstein, 225–38. Hoboken, NJ: Wiley.
- Breen, C., M. Ryan, M. J. Gibney, M. Corrigan, and D. O’Shea. 2013. Glycemic, insulinemic, and appetite responses of patients with type 2 diabetes to commonly consumed breads. The Diabetes Educator 39 (3):376–86. doi: 10.1177/0145721713479675.
- Brownlee, I. A., C. Moore, M. Chatfield, D. P. Richardson, P. Ashby, S. A. Kuznesof, S. A. Jebb, and C. J. Seal. 2010. Markers of cardiovascular risk are not changed by increased whole-grain intake: The wholeheart study, a randomised, controlled dietary intervention. British Journal of Nutrition 104 (1):125–34. doi: 10.1017/S0007114510000644.
- Canfora, E. E., J. W. Jocken, and E. E. Blaak. 2015. Short-chain fatty acids in control of body weight and insulin sensitivity. Nature Reviews. Endocrinology 11 (10):577–91. doi: 10.1038/nrendo.2015.128.
- Cioffi, I., L. Santarpia, A. Vaccaro, R. Iacone, G. Labruna, M. Marra, F. Contaldo, M. Kristensen, and F. Pasanisi. 2016. Whole-grain pasta reduces appetite and meal-induced thermogenesis acutely: A pilot study. Applied Physiology, Nutrition, and Metabolism 41 (3):277–83. doi: 10.1139/apnm-2015-0446.
- Costabile, G., E. Griffo, P. Cipriano, C. Vetrani, M. Vitale, G. Mamone, A. A. Rivellese, G. Riccardi, and R. Giacco. 2018. Subjective satiety and plasma pyy concentration after wholemeal pasta. Appetite 125:172–81. doi: 10.1016/j.appet.2018.02.004.
- De Carvalho, F. G., P. P. Ovídio, G. J. Padovan, A. A. Jordão Junior, J. S. Marchini, and A. M. Navarro. 2014. Metabolic parameters of postmenopausal women after quinoa or corn flakes intake-a prospective and double-blind study. International Journal of Food Sciences and Nutrition 65 (3):380–5. doi: 10.3109/09637486.2013.866637.
- Deeks, J., J. Higgins, and D. Altmann. 2019. Analysing data and undertaking meta-analyses. In Cochrane handbook for systematic reviews of interventions, eds. J. Higgins, J. Thomas, J. Chandler, M. Cumpston, T. Li, M. Page and V. Welch, 241–284. Chichester: Cochrane.
- DeFronzo, R. A. 2009. From the triumvirate to the “ominous octet”: A new paradigm for the treatment of type 2 diabetes mellitus. Diabetes 58 (4):101–28. doi: 10.2337/db09-9028.
- Gabrial, S. G., M. R. Shakib, and G. N. Gabrial. 2016. Effect of pseudocereal-based breakfast meals on the first and second meal glucose tolerance in healthy and diabetic subjects. Open Access Macedonian Journal of Medical Sciences 4 (4):565–73. doi: 10.3889/oamjms.2016.115.
- Geliebter, A., C. L. Grillot, R. Aviram-Friedman, S. Haq, E. Yahav, and S. A. Hashim. 2015. Effects of oatmeal and corn flakes cereal breakfasts on satiety, gastric emptying, glucose, and appetite-related hormones. Annals of Nutrition and Metabolism 66 (2–3):93–103. doi: 10.1159/000365933.
- Giacco, R., G. Costabile, G. Della Pepa, G. Anniballi, E. Griffo, A. Mangione, P. Cipriano, D. Viscovo, G. Clemente, R. Landberg, et al. 2014. A whole-grain cereal-based diet lowers postprandial plasma insulin and triglyceride levels in individuals with metabolic syndrome. Nutrition, Metabolism, and Cardiovascular Diseases : NMCD 24 (8):837–44.,. doi: 10.1016/j.numecd.2014.01.007.
- Gonzalez-Anton, C., M. C. Rico, E. Sanchez-Rodriguez, M. D. Ruiz-Lopez, A. Gil, and M. D. Mesa. 2015. Glycemic responses, appetite ratings and gastrointestinal hormone responses of most common breads consumed in spain. A randomized control trial in healthy humans. Nutrients 7 (6):4033–53. doi: 10.3390/nu7064033.
- Granfeldt, Y., B. Hagander, and I. Bjorck. 1995. Metabolic responses to starch in oat and wheat products. On the importance of food structure, incomplete gelatinization or presence of viscous dietary fibre. European Journal of Clinical Nutrition 49 (3):189–99.
- Granfeldt, Y., H. Liljeberg, A. Drews, R. Newman, and I. Björck. 1994. Glucose and insulin responses to barley products: Influence of food structure and amylose-amylopectin ratio. The American Journal of Clinical Nutrition 59 (5):1075–82. doi: 10.1093/ajcn/59.5.1075.
- Guyatt, G. H., A. D. Oxman, G. E. Vist, R. Kunz, Y. Falck-Ytter, P. Alonso-Coello, and H. J. Schünemann. 2008. Grade: An emerging consensus on rating quality of evidence and strength of recommendations. BMJ (Clinical Research ed.) 336 (7650):924–6. doi: 10.1136/bmj.39489.470347.AD.
- Hagander, B., I. Bjorck, N. G. Asp, I. Lundquist, P. Nilsson-Ehle, J. Schrezenmeir, and B. Schersten. 1985. Hormonal and metabolic responses to breakfast meals in niddm: Comparison of white and whole-grain wheat bread and corresponding extruded products. Human Nutrition and Applied Nutrition 39:114–23.
- Hagander, B., I. Bjorck, N. G. Asp, S. Efendic, J. Holm, P. Nilsson-Ehle, I. Lundquist, and B. Schersten. 1987. Rye products in the diabetic diet. Postprandial glucose and hormonal responses in non-insulin-dependent diabetic patients as compared to starch availability in vitro and experiments in rats. Diabetes Research and Clinical Practice 3 (2):85–96. doi: 10.1016/S0168-8227(87)80012-8.
- Hallstrom, E., F. Sestili, D. Lafiandra, I. Bjorck, and E. Ostman. 2011. A novel wheat variety with elevated content of amylose increases resistant starch formation and may beneficially influence glycaemia in healthy subjects. Food and Nutrition Research 55:7074.
- Hamad, S., T. A. Zafar, and J. Sidhu. 2018. Parboiled rice metabolism differs in healthy and diabetic individuals with similar improvement in glycemic response. Nutrition (Burbank, Los Angeles County, Calif.) 47:43–9. doi: 10.1016/j.nut.2017.09.010.
- Harris Jackson, K., S. G. West, J. P. Vanden Heuvel, S. S. Jonnalagadda, A. B. Ross, A. M. Hill, J. A. Grieger, S. K. Lemieux, and P. M. Kris-Etherton. 2014. Effects of whole and refined grains in a weight-loss diet on markers of metabolic syndrome in individuals with increased waist circumference: A randomized controlled-feeding trial. The American Journal of Clinical Nutrition 100 (2):577–86. doi: 10.3945/ajcn.113.078048.
- Hartvigsen, M. L., H. N. Laerke, A. Overgaard, J. J. Holst, K. E. Bach Knudsen, and K. Hermansen. 2014a. Postprandial effects of test meals including concentrated arabinoxylan and whole grain rye in subjects with the metabolic syndrome: A randomised study. European Journal of Clinical Nutrition 68 (5):567–74. doi: 10.1038/ejcn.2014.25.
- Hartvigsen, M. L., S. Gregersen, H. N. Laerke, J. J. Holst, K. E. Bach Knudsen, and K. Hermansen. 2014b. Effects of concentrated arabinoxylan and beta-glucan compared with refined wheat and whole grain rye on glucose and appetite in subjects with the metabolic syndrome: A randomized study. European Journal of Clinical Nutrition 68 (1):84–90. doi: 10.1038/ejcn.2013.236.
- Health Canada. 2013. Whole grains – get the facts. Accessed December 29. https://www.canada.ca/en/health-canada/services/canada-food-guide/resources/healthy-eating-recommendations/eat-a-variety/whole-grain/get-facts.html.
- Hlebowicz, J., J. Wickenberg, R. Fahlstrom, O. Bjorgell, L. O. Almer, and G. Darwiche. 2007. Effect of commercial breakfast fibre cereals compared with corn flakes on postprandial blood glucose, gastric emptying and satiety in healthy subjects: A randomized blinded crossover trial. Nutrition Journal 6:22.
- Holm, J., and I. Bjorck. 1992. Bioavailability of starch in various wheat-based bread products: Evaluation of metabolic responses in healthy subjects and rate and extent of in vitro starch digestion. The American Journal of Clinical Nutrition 55 (2):420–9. doi: 10.1093/ajcn/55.2.420.
- Hu, Y., M. Ding, L. Sampson, W. C. Willett, J. E. Manson, M. Wang, B. Rosner, F. B. Hu, and Q. Sun. 2020. Intake of whole grain foods and risk of type 2 diabetes: Results from three prospective cohort studies. BMJ 370:m2206. doi: 10.1136/bmj.m2206.
- Jenkins, D. J., T. M. Wolever, R. H. Taylor, H. M. Barker, H. Fielden, and M. A. Gassull. 1981. Lack of effect of refining on the glycemic response to cereals. Diabetes Care 4 (5):509–13. doi: 10.2337/diacare.4.5.509.
- Johansson, D. P., I. Lee, U. Riserus, M. Langton, and R. Landberg. 2015. Effects of unfermented and fermented whole grain rye crisp breads served as part of a standardized breakfast, on appetite and postprandial glucose and insulin responses: A randomized cross-over trial. PLoS One 10 (3):e0122241. doi: 10.1371/journal.pone.0122241.
- Johansson, E. V., A. C. Nilsson, E. M. Ostman, and I. M. Bjorck. 2013. Effects of indigestible carbohydrates in barley on glucose metabolism, appetite and voluntary food intake over 16 h in healthy adults. Nutrition Journal 12 (1):46. doi: 10.1186/1475-2891-12-46.
- Jovanovski, E., R. Khayyat, A. Zurbau, A. Komishon, N. Mazhar, J. L. Sievenpiper, S. Blanco Mejia, H. V. T. Ho, D. Li, A. L. Jenkins, et al. 2019. Should viscous fiber supplements be considered in diabetes control? Results from a systematic review and meta-analysis of randomized controlled trials. Diabetes Care 42 (5):755–66. doi: 10.2337/dc18-1126.
- Juntunen, K. S., D. E. Laaksonen, K. Autio, L. K. Niskanen, J. J. Holst, K. E. Savolainen, K. H. Liukkonen, K. S. Poutanen, and H. M. Mykkanen. 2003. Structural differences between rye and wheat breads but not total fiber content may explain the lower postprandial insulin response to rye bread. The American Journal of Clinical Nutrition 78 (5):957–64. doi: 10.1093/ajcn/78.5.957.
- Karl, J. P., M. Meydani, J. B. Barnett, S. M. Vanegas, B. Goldin, A. Kane, H. Rasmussen, E. Saltzman, P. Vangay, D. Knights, et al. 2017. Substituting whole grains for refined grains in a 6-wk randomized trial favorably affects energy-balance metrics in healthy men and postmenopausal women. The American Journal of Clinical Nutrition 105 (3):589–99. doi: 10.3945/ajcn.116.139683.
- Kikuchi, Y., S. Nozaki, M. Makita, S. Yokozuka, S. I. Fukudome, T. Yanagisawa, and S. Aoe. 2018. Effects of whole grain wheat bread on visceral fat obesity in Japanese subjects: A randomized double-blind study. Plant Foods for Human Nutrition 73 (3):161–5. doi: 10.1007/s11130-018-0666-1.
- Kirwan, J. P., S. K. Malin, A. R. Scelsi, E. L. Kullman, S. D. Navaneethan, M. R. Pagadala, J. M. Haus, J. Filion, J.-P. Godin, S. Kochhar, et al. 2016. A whole-grain diet reduces cardiovascular risk factors in overweight and obese adults: A randomized controlled trial. The Journal of Nutrition 146 (11):2244–51. doi: 10.3945/jn.116.230508.
- Kondo, K., K. Morino, Y. Nishio, A. Ishikado, H. Arima, K. Nakao, F. Nakagawa, F. Nikami, O. Sekine, K. I. Nemoto, et al. 2017. Fiber-rich diet with brown rice improves endothelial function in type 2 diabetes mellitus: A randomized controlled trial. PLoS One 12 (6):e0179869. doi: 10.1371/journal.pone.0179869.
- Kristensen, M., M. G. Jensen, G. Riboldi, M. Petronio, S. Bugel, S. Toubro, I. Tetens, and A. Astrup. 2010. Wholegrain vs. Refined wheat bread and pasta. Effect on postprandial glycemia, appetite, and subsequent ad libitum energy intake in young healthy adults. Appetite 54 (1):163–9.
- Kristensen, M., S. Toubro, M. G. Jensen, A. B. Ross, G. Riboldi, M. Petronio, S. Bügel, I. Tetens, and A. Astrup. 2012. Whole grain compared with refined wheat decreases the percentage of body fat following a 12-week, energy-restricted dietary intervention in postmenopausal women. The Journal of Nutrition 142 (4):710–6. doi: 10.3945/jn.111.142315.
- Lee, I., L. Shi, D. L. Webb, P. M. Hellstrom, U. Riserus, and R. Landberg. 2017. Effects of whole-grain rye porridge with added inulin and wheat gluten on appetite, gut fermentation and postprandial glucose metabolism: A randomised, cross-over, breakfast study. British Journal of Nutrition 116 (12):2139–49. doi: 10.1017/S0007114516004153.
- Lia, Å., and H. Andersson. 1994. Glycemic response and gastric emptying rate of oat bran and semolina porridge meals in diabetic subjects. Scandinavian Journal of Nutrition (Sweden) 38(4): 154–158.
- Li, J., T. Kaneko, T. Kaneko, L.-Q. Qin, J. Wang, and Y. Wang. 2003. Effects of barley intake on glucose tolerance, lipid metabolism, and bowel function in women. Nutrition 19 (11–12):926–9. doi: 10.1016/S0899-9007(03)00182-5.
- Li, L., G. Lietz, W. Bal, A. Watson, B. Morfey, and C. Seal. 2018. Effects of quinoa (chenopodium quinoa willd.) consumption on markers of cvd risk. Nutrients 10 (6):777. doi: 10.3390/nu10060777.
- Li, M., K. Koecher, L. Hansen, and M. G. Ferruzzi. 2017. Phenolics from whole grain oat products as modifiers of starch digestion and intestinal glucose transport. Journal of Agricultural and Food Chemistry 65 (32):6831–9. doi: 10.1021/acs.jafc.7b02171.
- Liljeberg, H., and I. Bjorck. 1994. Bioavailability of starch in bread products. Postprandial glucose and insulin responses in healthy subjects and in vitro resistant starch content. European Journal of Clinical Nutrition 48 (3):151–63.
- Luhovyy, B. L., R. C. Mollard, S. Yurchenko, M. F. Nunez, S. Berengut, T. T. Liu, C. E. Smith, C. L. Pelkman, and G. H. Anderson. 2014. The effects of whole grain high-amylose maize flour as a source of resistant starch on blood glucose, satiety, and food intake in young men. Journal of Food Science 79 (12):H2550–6. doi: 10.1111/1750-3841.12690.
- Malin, S. K., E. L. Kullman, A. R. Scelsi, J. M. Haus, J. Filion, M. R. Pagadala, J. P. Godin, S. Kochhar, A. B. Ross, and J. P. Kirwan. 2018. A whole-grain diet reduces peripheral insulin resistance and improves glucose kinetics in obese adults: A randomized-controlled trial. Metabolism 82:111–7. doi: 10.1016/j.metabol.2017.12.011.
- Malin, S. K., E. L. Kullman, A. R. Scelsi, J. P. Godin, A. B. Ross, and J. P. Kirwan. 2019. A whole-grain diet increases glucose-stimulated insulin secretion independent of gut hormones in adults at risk for type 2 diabetes. Molecular Nutrition & Food Research 63 (7):e1800967. doi: 10.1002/mnfr.201800967.
- Marinangeli, C. P., A. N. Kassis, and P. J. Jones. 2009. Glycemic responses and sensory characteristics of whole yellow pea flour added to novel functional foods. Journal of Food Science 74 (9):S385–S9. doi: 10.1111/j.1750-3841.2009.01347.x.
- Marshall, S., P. Petocz, E. Duve, K. Abbott, T. Cassettari, M. Blumfield, and F. Fayet-Moore. 2020. The effect of replacing refined grains with whole grains on cardiovascular risk factors: A Systematic Review and Meta-Analysis of Randomized Controlled Trials with GRADE Clinical Recommendation . Journal of the Academy of Nutrition and Dietetics 120 (11):1859–83 e31. doi: 10.1016/j.jand.2020.06.021.
- Marventano, S., C. Vetrani, M. Vitale, J. Godos, G. Riccardi, and G. Grosso. 2017. Whole grain intake and glycaemic control in healthy subjects: A systematic review and meta-analysis of randomized controlled trials. Nutrients 9 (7):769–87. doi: 10.3390/nu9070769.
- Moher, D., A. Liberati, J. Tetzlaff, D. G. Altman and The Prisma Group. 2009. Preferred reporting items for systematic reviews and meta-analyses: The prisma statement. PLoS Medicine 6 (7):e1000097. doi: 10.1371/journal.pmed.1000097.
- Müller, M., M. A. G. Hernández, G. H. Goossens, D. Reijnders, J. J. Holst, J. W. E. Jocken, H. van Eijk, E. E. Canfora, and E. E. Blaak. 2019. Circulating but not faecal short-chain fatty acids are related to insulin sensitivity, lipolysis and glp-1 concentrations in humans. Scientific Reports 9 (1):12515. doi: 10.1038/s41598-019-48775-0.
- Musa-Veloso, K., D. Noori, C. Venditti, T. Poon, J. Johnson, L. S. Harkness, M. O’Shea, and Y. Chu. 2020. A systematic review and meta-analysis of randomized controlled trials on the effects of oats and oat processing on postprandial blood glucose and insulin responses. Journal of Nutrition 151(2):341–351.
- Musa-Veloso, K., T. Poon, L. S. Harkness, M. O’Shea, and Y. Chu. 2018. The effects of whole-grain compared with refined wheat, rice, and rye on the postprandial blood glucose response: A systematic review and meta-analysis of randomized controlled trials. The American Journal of Clinical Nutrition 108 (4):759–74. doi: 10.1093/ajcn/nqy112.
- Najjar, A. M., P. M. Parsons, A. M. Duncan, L. E. Robinson, R. Y. Yada, and T. E. Graham. 2009. The acute impact of ingestion of breads of varying composition on blood glucose, insulin and incretins following first and second meals. British Journal of Nutrition 101 (3):391–8. doi: 10.1017/S0007114508003085.
- Nilsson, A., E. Johansson-Boll, J. Sandberg, and I. Bjorck. 2016. Gut microbiota mediated benefits of barley kernel products on metabolism, gut hormones, and inflammatory markers as affected by co-ingestion of commercially available probiotics: A randomized controlled study in healthy subjects. Clinical Nutrition ESPEN 15:49–56. doi: 10.1016/j.clnesp.2016.06.006.
- Nilsson, A. C., E. V. Johansson-Boll, and I. M. Bjorck. 2015. Increased gut hormones and insulin sensitivity index following a 3-d intervention with a barley kernel-based product: A randomised cross-over study in healthy middle-aged subjects. The British Journal of Nutrition 114 (6):899–907. doi: 10.1017/S0007114515002524.
- Nilsson, A. C., E. M. Ostman, J. J. Holst, and I. M. E. BjöRck, 2008a. Including indigestible carbohydrates in the evening meal of healthy subjects improves glucose tolerance, lowers inflammatory markers, and increases satiety after a subsequent standardized breakfast. The Journal of Nutrition 138 (4):732–9. doi: 10.1093/jn/138.4.732.
- Nilsson, A. C., E. Ostman, T. Preston, and I. Bjorck. 2008b. Effects of gi vs content of cereal fibre of the evening meal on glucose tolerance at a subsequent standardized breakfast. European Journal of Clinical Nutrition 62 (6):712–20. doi: 10.1038/sj.ejcn.1602784.
- Nilsson, A. C., E. M. Ostman, Y. Granfeldt, and I. M. Bjorck. 2008c. Effect of cereal test breakfasts differing in glycemic index and content of indigestible carbohydrates on daylong glucose tolerance in healthy subjects. The American Journal of Clinical Nutrition 87 (3):645–54. doi: 10.1093/ajcn/87.3.645.
- Nordlund, E., K. Katina, H. Mykkanen, and K. Poutanen. 2016. Distinct characteristics of rye and wheat breads impact on their in vitro gastric disintegration and in vivo glucose and insulin responses. Foods 5 (4):24. doi: 10.3390/foods5020024.
- O’Dea, K., P. J. Nestel, and L. Antonoff. 1980. Physical factors influencing postprandial glucose and insulin responses to starch. The American Journal of Clinical Nutrition 33 (4):760–5. doi: 10.1093/ajcn/33.4.760.
- Osman, N. M. H., B.-N. Mohd-Yusof, and A. Ismail. 2017. Estimating glycemic index of rice-based mixed meals by using predicted and adjusted formulae. Rice Science 24 (5):274–82. doi: 10.1016/j.rsci.2017.06.001.
- Parker, E. D., S. Liu, L. Van Horn, L. F. Tinker, J. M. Shikany, C. B. Eaton, and K. L. Margolis. 2013. The association of whole grain consumption with incident type 2 diabetes: The women’s health initiative observational study. Annals of Epidemiology 23 (6):321–7. doi: 10.1016/j.annepidem.2013.03.010.
- Pereira, M. A., D. R. Jacobs, Jr., J. J. Pins, S. K. Raatz, M. D. Gross, J. L. Slavin, and E. R. Seaquist. 2002. Effect of whole grains on insulin sensitivity in overweight hyperinsulinemic adults. The American Journal of Clinical Nutrition 75 (5):848–55. doi: 10.1093/ajcn/75.5.848.
- Pins, J. J., D. Geleva, J. M. Keenan, C. Frazel, P. J. O’Connor, and L. M. Cherney. 2002. Do whole-grain oat cereals reduce the need for antihypertensive medications and improve blood pressure control? Journal of Family Practice 51:353–9.
- Public Health England. 2016. The eatwell guide.
- RamyaBai, M., N. M. Wedick, S. Shanmugam, K. Arumugam, L. Nagarajan, K. Vasudevan, G. Gunasekaran, G. Rajagopal, D. Spiegelman, V. Malik, et al. 2019. Glycemic index and microstructure evaluation of four cereal grain foods. Journal of Food Science 84 (12):3373–82. doi: 10.1111/1750-3841.14945.
- Ranawana, D. V., C. J. Henry, H. J. Lightowler, and D. Wang. 2009. Glycaemic index of some commercially available rice and rice products in Great Britain. International Journal of Food Science and Nutrition 60:99–110. doi: 10.1080/09637480802516191.
- Reynolds, A., J. Mann, J. Cummings, N. Winter, E. Mete, and L. Te Morenga. 2019. Carbohydrate quality and human health: A series of systematic reviews and meta-analyses. Lancet (London, England) 393 (10170):434–45. doi: 10.1016/S0140-6736(18)31809-9.
- Roager, H. M., J. K. Vogt, M. Kristensen, L. B. S. Hansen, S. Ibrügger, R. B. Maerkedahl, M. I. Bahl, M. V. Lind, R. L. Nielsen, H. Frøkiaer, et al. 2019. Whole grain-rich diet reduces body weight and systemic low-grade inflammation without inducing major changes of the gut microbiome: A randomised cross-over trial. Gut 68 (1):83–93. doi: 10.1136/gutjnl-2017-314786.
- Rosen, L. A., E. M. Ostman, and I. M. Bjorck. 2011a. Effects of cereal breakfasts on postprandial glucose, appetite regulation and voluntary energy intake at a subsequent standardized lunch; focusing on rye products. Nutrition Journal 10:7.
- Rosen, L. A., E. M. Ostman, and I. M. Bjorck. 2011b. Postprandial glycemia, insulinemia, and satiety responses in healthy subjects after whole grain rye bread made from different rye varieties. 2. Journal of Agriculture and Food Chemistry 59:12149–54.
- Rosen, L. A., E. M. Östman, P. R. Shewry, J. L. Ward, A. A. M. Andersson, V. Piironen, A.-M. Lampi, M. Rakszegi, Z. Bedö, and I. M. E. Björck. 2011c. Postprandial glycemia, insulinemia, and satiety responses in healthy subjects after whole grain rye bread made from different rye varieties. 1. Journal of Agricultural and Food Chemistry 59 (22):12139–48.
- Rosen, L. A., L. O. Silva, U. K. Andersson, C. Holm, E. M. Ostman, and I. M. Bjorck. 2009. Endosperm and whole grain rye breads are characterized by low post-prandial insulin response and a beneficial blood glucose profile. Nutrition Journal 8 (1):42. doi: 10.1186/1475-2891-8-42.
- Ross, A. B., S. J. Bruce, A. Blondel-Lubrano, S. Oguey-Araymon, M. Beaumont, A. Bourgeois, C. Nielsen-Moennoz, M. Vigo, L.-B. Fay, S. Kochhar, et al. 2011. A whole-grain cereal-rich diet increases plasma betaine, and tends to decrease total and ldl-cholesterol compared with a refined-grain diet in healthy subjects. British Journal of Nutrition 105 (10):1492–502. doi: 10.1017/S0007114510005209.
- Saltzman, E., S. K. Das, A. H. Lichtenstein, G. E. Dallal, A. Corrales, E. J. Schaefer, A. S. Greenberg, and S. B. Roberts. 2001. An oat-containing hypocaloric diet reduces systolic blood pressure and improves lipid profile beyond effects of weight loss in men and women. The Journal of Nutrition 131 (5):1465–70. doi: 10.1093/jn/131.5.1465.
- Sandberg, J. C., I. M. Bjorck, and A. C. Nilsson. 2016. Rye-based evening meals favorably affected glucose regulation and appetite variables at the following breakfast; a randomized controlled study in healthy subjects. PLoS One 11 (3):e0151985. doi: 10.1371/journal.pone.0151985.
- Sandberg, J. C., I. M. E. Bjorck, and A. C. Nilsson. 2017. Effects of whole grain rye, with and without resistant starch type 2 supplementation, on glucose tolerance, gut hormones, inflammation and appetite regulation in an 11-14.5 hour perspective; a randomized controlled study in healthy subjects. Nutrition Journal 16 (1):25. doi: 10.1186/s12937-017-0246-5.
- Schünemann, H. J., G. E. Vist, J. P. Higgins, N. Santesso, J. J. Deeks, P. Glasziou, E. A. Akl, G. H. Guyatt, and C. G. M. Group. 2019. Interpreting results and drawing conclusions. In Cochrane handbook for systematic reviews of interventions, eds. J. Higgins, J. Thomas, J. Chandler, M. Cumpston, T. Li, M. Page and V. Welch, 403–31. Chichester: Cochrane.
- Schutte, S., D. Esser, F. P. M. Hoevenaars, G. Hooiveld, M. G. Priebe, R. J. Vonk, S. Wopereis, and L. A. Afman. 2018. A 12-wk whole-grain wheat intervention protects against hepatic fat: The graandioos study, a randomized trial in overweight subjects. The American Journal of Clinical Nutrition 108 (6):1264–74. doi: 10.1093/ajcn/nqy204.
- Schwingshackl, L., G. Hoffmann, A. M. Lampousi, S. Knüppel, K. Iqbal, C. Schwedhelm, A. Bechthold, S. Schlesinger, and H. Boeing. 2017. Food groups and risk of type 2 diabetes mellitus: A systematic review and meta-analysis of prospective studies. European Journal of Epidemiology 32 (5):363–75. doi: 10.1007/s10654-017-0246-y.
- Se, C. H., K. A. Chuah, A. Mishra, R. Wickneswari, and T. Karupaiah. 2016. Evaluating crossbred red rice variants for postprandial glucometabolic responses: A comparison with commercial varieties. Nutrients 8 (5):308. doi: 10.3390/nu8050308.
- Seal, C. J., and I. A. Brownlee. 2015. Whole-grain foods and chronic disease: Evidence from epidemiological and intervention studies. The Proceedings of the Nutrition Society 74 (3):313–9. doi: 10.1017/S0029665115002104.
- Shobana, S.,. N. Lakshmipriya, M. R. Bai, R. Gayathri, V. Ruchi, V. Sudha, N. G. Malleshi, K. Krishnaswamy, C. K. Henry, R. M. Anjana, et al. 2017. Even minimal polishing of an Indian parboiled brown rice variety leads to increased glycemic responses. Asia Pacific Journal of Clinical Nutrition 26:829–36.
- Slavin, J. 2003. Why whole grains are protective: Biological mechanisms. The Proceedings of the Nutrition Society 62 (1):129–34. doi: 10.1079/PNS2002221.
- Soong, Y. Y., R. Y. Quek, and C. J. Henry. 2015. Glycemic potency of muffins made with wheat, rice, corn, oat and barley flours: A comparative study between in vivo and in vitro. European Journal of Nutrition 54 (8):1281–5.
- Sterne, J. A. C., J. Savović, M. J. Page, R. G. Elbers, N. S. Blencowe, I. Boutron, C. J. Cates, H.-Y. Cheng, M. S. Corbett, S. M. Eldridge, et al. 2019. Rob 2: A revised tool for assessing risk of bias in randomised trials. BMJ (Clinical Research ed.) 366:l4898. doi: 10.1136/bmj.l4898.
- Stringer, D. M., C. G. Taylor, P. Appah, H. Blewett, and P. Zahradka. 2013. Consumption of buckwheat modulates the post-prandial response of selected gastrointestinal satiety hormones in individuals with type 2 diabetes mellitus. Metabolism: Clinical and Experimental 62 (7):1021–31. doi: 10.1016/j.metabol.2013.01.021.
- Tieri, M., F. Ghelfi, M. Vitale, C. Vetrani, S. Marventano, A. Lafranconi, J. Godos, L. Titta, A. Gambera, E. Alonzo, et al. 2020. Whole grain consumption and human health: An umbrella review of observational studies. International Journal of Food Sciences and Nutrition 71 (6):668–77. doi: 10.1080/09637486.2020.1715354.
- Tosh, S. M. 2013. Review of human studies investigating the post-prandial blood-glucose lowering ability of oat and barley food products. European Journal of Clinical Nutrition 67 (4):310–7. doi: 10.1038/ejcn.2013.25.
- U.S. Department of Agriculture and U.S. Department of Health and Human Services. 2020. Dietary guidelines for Americans, 2020–2025. Accessed January 2021. http://www.dietaryguidelines.gov.
- US Department of Agriculture ARS. 2019. Fooddata central. Accessed June 2020. https://fdc.nal.usda.gov.
- Van Der Kamp, J. W., K. Poutanen, C. J. Seal, and D. P. Richardson. 2014. The healthgrain definition of ‘whole grain. Food & Nutrition Research 58 (1):22100. doi: 10.3402/fnr.v58.22100.
- Vitaglione, P., I. Mennella, R. Ferracane, A. A. Rivellese, R. Giacco, D. Ercolini, S. M. Gibbons, A. La Storia, J. A. Gilbert, S. Jonnalagadda, et al. 2015. Whole-grain wheat consumption reduces inflammation in a randomized controlled trial on overweight and obese subjects with unhealthy dietary and lifestyle behaviors: Role of polyphenols bound to cereal dietary fiber. The American Journal of Clinical Nutrition 101 (2):251–61. doi: 10.3945/ajcn.114.088120.
- Wolever, T. M. S., A. L. Jenkins, K. Prudence, J. Johnson, R. Duss, Y. Chu, and R. E. Steinert. 2018. Effect of adding oat bran to instant oatmeal on glycaemic response in humans – a study to establish the minimum effective dose of oat beta-glucan. Food & Function 9 (3):1692–700. doi: 10.1039/C7FO01768E.
- Wolever, T. M. S., B. J. van Klinken, S. E. Spruill, A. L. Jenkins, Y. Chu, and L. Harkness. 2016. Effect of serving size and addition of sugar on the glycemic response elicited by oatmeal: A randomized, cross-over study. Clinical Nutrition ESPEN 16:48–54.
- Wolever, T. M. S., J. Johnson, A. L. Jenkins, J. C. Campbell, A. Ezatagha, and Y. Chu. 2019a. Impact of oat processing on glycaemic and insulinaemic responses in healthy humans: A randomised clinical trial. British Journal of Nutrition 121 (11):1264–70. doi: 10.1017/S0007114519000370.
- Wolever, T. M. S., P. J. H. Jones, A. L. Jenkins, R. C. Mollard, H. Wang, A. Johnston, J. Johnson, and Y. Chu. 2019b. Glycaemic and insulinaemic impact of oats soaked overnight in milk vs. Cream of rice with and without sugar, nuts, and seeds: A randomized, controlled trial. European Journal of Clinical Nutrition 73 (1):86–93. doi: 10.1038/s41430-018-0329-1.
- Zafar, T. A., F. Al-Hassawi, F. Al-Khulaifi, G. Al-Rayyes, C. Waslien, and F. G. Huffman. 2015. Organoleptic and glycemic properties of chickpea-wheat composite breads. Journal of Food Science and Technology 52 (4):2256–63. doi: 10.1007/s13197-013-1192-7.
- Zafar, T. A., Y. Kabir, and C. Ghazaii. 2011. Low glycemic index foods suppress glycemic responses, appetite and food intake in young Kuwaiti females. Kuwait Journal of Science and Engineering 38:111–23.
- Zhang, G., A. Pan, G. Zong, Z. Yu, H. Wu, X. Chen, L. Tang, Y. Feng, H. Zhou, X. Chen, et al. 2011. Substituting white rice with brown rice for 16 weeks does not substantially affect metabolic risk factors in middle-aged chinese men and women with diabetes or a high risk for diabetes. The Journal of Nutrition 141 (9):1685–90. doi: 10.3945/jn.111.142224.
- Zhu, R., Z. Fan, Y. Han, S. Li, G. Li, L. Wang, T. Ye, and W. Zhao. 2019. Acute effects of three cooked non-cereal starchy foods on postprandial glycemic responses and in vitro carbohydrate digestion in comparison with whole grains: A randomized trial. Nutrients 11 (3):634. doi: 10.3390/nu11030634.