
Abstract
This critical review examines evidence for beneficial effects of quercetin phase-2 conjugates from clinical intervention studies, volunteer feeding trials, and in vitro work. Plasma concentrations of quercetin-3-O-glucuronide (Q3G) and 3′-methylquercetin-3-O-glucuronide (3′MQ3G) after supplementation may produce beneficial effects in macrophages and endothelial cells, respectively, especially if endogenous deglucuronidation occurs, and lower blood uric acid concentration via quercetin-3′-O-sulfate (Q3′S). Unsupplemented diets produce much lower concentrations (<50 nmol/l) rarely investigated in vitro. At 10 nmol/l, Q3′S and Q3G stimulate or suppress, respectively, angiogenesis in endothelial cells. Statistically significant effects have been reported at 100 nmol/l in breast cancer cells (Q3G), primary neuron cultures (Q3G), lymphocytes (Q3G and3′MQ3G) and HUVECs (QG/QS mixture), but it is unclear whether these translate to a health benefit in vivo. More sensitive and more precise methods to measure clinically significant endpoints are required before a conclusion can be drawn regarding effects at normal dietary concentrations. Future requirements include better understanding of inter-individual and temporal variation in plasma quercetin phase-2 conjugates, their mechanisms of action including deglucuronidation and desulfation both in vitro and in vivo, tissue accumulation and washout, as well as potential for synergy or antagonism with other quercetin metabolites and metabolites of other dietary phytochemicals.
1. Introduction to quercetin conjugates
Quercetin occurs widely in the plant kingdom and is the dominant flavonol in the human diet, occurring in the plant almost exclusively as glycosides, predominantly with mono- and di-saccharides but also with tri- and tetra-saccharides with a range of sugars (). Except for onions, the 3-rutinoside conjugate of quercetin, rutin, is most abundant in foods, but conjugates with glucose, glucuronic acid, galactose, rhamnose, xylose and arabinose also occur, and the sugar moiety may additionally be acylated with, for example, acetic acid, malonic acid or 4′-hydroxycinnamic acid (Hollman and Arts Citation2000). A detailed account of the flavonol glycoside composition of foods and beverages is outside the scope of this review, but the following examples are provided for background. These are not comprehensive and do not take account of commodity variation, which may be substantial.
Figure 1. Structures of quercetin glycosides and common names.
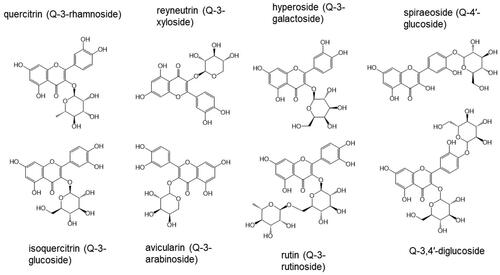
According to the Phenol Explorer database (http://phenol-explorer.eu/), capers are the richest source of quercetin-3-rutinoside (332 mg/100 g out of 655 mg/100 g total flavonols). Red onions (101 mg out of 158 mg/100 g), shallots (37 mg out of 119 mg/100 g) and yellow onions (36 mg out of 73 mg/100 g) are the richest source of quercetin-3,4′-diglucoside, but white onions supply only 3 mg out of 5 mg/100 g. The second most dominant flavonol glycoside in these vegetables is quercetin-4′-glucoside accompanied by small amounts of quercetin-3-glucoside, and in red onions only, also quercetin-4′,7-diglucoside and traces of quercetin 3-rutinoside. Other compilations are available, for example, focusing on tropical plant species (Miean and Mohamed Citation2001). Quercetin-3-galactoside is supplied by apples (2 mg out of 9 mg/100 g) and blackberries (4 mg out of 13 mg/100 g), quercetin-3-rhamnoside is found in red wine (1 mg out of 7 mg/100 ml) and black olives (4 mg out of 49 mg/100 g), and quercetin-3-glucuronide occurs in black grape (2 mg out of 6 mg/100 g) and strawberry (2 mg/100 g), where it is the dominant flavonol. Quercetin aglycone is present at low concentrations in unprocessed fruits and vegetables. After processing, quercetin aglycone may constitute a significant portion of the total flavonols, for example, in red wines (Mcdonald et al. Citation1998) cider (DuPont et al. Citation2002) and in cocoa (Andres-Lacueva et al. Citation2008). Food preparation such as chopping, peeling and trimming of onions can significantly reduce the content of quercetin glycosides by a combination of removing the richer outer layers (Ewald et al. Citation1999) and inducing enzymic hydrolysis in disrupted tissue, and further losses of glycosides occur when cooking onions and asparagus (Makris and Rossiter Citation2001; Rohn et al. Citation2007) probably by leaching and hydrolysis (Ulbrich et al. Citation2015). Cattivelli et al. (Citation2023) reported that the quercetin glycoside content of red-skinned onions increased on frying and grilling but did not correct for the moisture loss during cooking. Quercetin aglycone is generally considered to be heat stable during domestic cooking if the pH is low, but some degradation may occur especially under oxidative conditions at pH 8 in the presence of catalytic Fe2+ or Cu2+ yielding 3,4-dihydroxybenzoic acid and several uncharacterized products (Makris and Rossiter Citation2000). Known degradation products include 2-(3′,4′-dihydroxybenzoyl)-2,4,6-trihydroxy-benzofuran-3(2H)-one, 3,4-dihydroxybenzoic acid, 2-keto-2-(3′,4′-dihydroxyphenyl)acetic acid (3,4-dihydroxybenzoylformic acid) and 2,4,6-trihydroxybenzoic acid (phloroglucinic acid) (Ramešová et al. Citation2012). Further degradation products, some of which are unstable and transient, have been reported (Zenkevich and Pushkareva Citation2017) but except for 3,4-dihydroxybenzoic and 3′,4′-dihydroxyphenylacetic acid, which, if any, occur in the diet is unclear. Some of the above might be produced after exposure to alkali as sometimes used for the commercial peeling of onions.
There are estimates of daily intake of quercetin for the UK (Ranka et al. Citation2008), Germany (Egert and Wisker Citation2011), Japan (Kimira et al. Citation1998; Nishimuro et al. Citation2015) and China (Yao et al. Citation2019) with mean values ranging from 8.3 to 29.4 mg, albeit with extreme variability. Unfortunately, except for the UK data (mean ± s.d. 29.4 ± 15.0 mg; 97 ± 50 μmol quercetin aglycone after hydrolysis), it is unclear whether the values quoted are for aglycone or glycosides.
Although quercetin occurs in plants as glycosides, after consumption it is found in plasma, tissues and urine predominantly as quercetin phase-2 conjugates with almost no free quercetin. The absorption and excretion of intact quercetin glycosides is discussed in section 3.3.9. It is the Phase-2 conjugates that are thought to be responsible for any biological effects in tissues with the exception of the gut, which is exposed to the quercetin forms found in the plant and food, as well as catabolised forms. Basic properties of these conjugates are shown in . Increasingly, the biological properties of these quercetin conjugates are being studied in vitro and to a lesser extent in vivo. To relate the results of in vitro studies to human diets requires an understanding of quercetin absorption, distribution, metabolism and excretion. The occurrence and metabolism have been covered in many reviews, and the reader is referred to two papers on this subject (Del Rio et al. Citation2013; Williamson, Kay, and Crozier Citation2018), but the following summary addresses some important items that are often overlooked and to place the later sections of the current review in context. Extensive studies using multiple rat and human tissue extracts have established significant species differences in the quercetin conjugate profile across a range of tissues (van der Woude et al. Citation2004) and for that reason the emphasis in this review will be placed on studies on humans in vivo and on human tissues in vitro.
Table 1. Quercetin conjugates: basic properties.
In some circumstances such as an inflammatory stress, deconjugating enzymes are released and convert quercetin glucuronides to the free aglycone (Menendez et al. Citation2011; Galindo et al. Citation2012; Ruotolo et al. Citation2014), which often has a higher bioactivity. In addition, quercetin conjugates are deconjugated and reconjugated in the liver (O’Leary et al. Citation2003), and these reactions are discussed below. Whether quercetin sulfates are deconjugated in a comparable way is not known.
2. Analysis and quantification of quercetin aglycone and phase-2 conjugates
In many studies, and especially in early studies, quercetin conjugates in the blood were hydrolyzed either in acid (e.g. de Vries et al. Citation2001; McAnlis et al. Citation1999) or by β-glucuronidase and sulfatase (e.g. Barrington et al. Citation2009) prior to quantification as the aglycone. With care, acid hydrolysis was acceptable for flavonol conjugates, but for most other flavonoids, compounds were unstable, and acid hydrolysis was discarded in favor of enzymes. Unfortunately, it was found that commercial enzyme preparations were very variable in performance, not only by biological source, but also batch to batch (Arts, Venema, and Hollman Citation2003). To circumvent that problem, certain laboratories invested considerable funds and effort into the chemical or enzymic synthesis of a range of authentic quercetin conjugates (Barron, Cren-Olive, and Needs Citation2003; Dueñas et al. Citation2008, Citation2012; Barron et al. Citation2016). These conjugates, augmented occasionally with preexisting quercetin conjugates isolated from plants (Gerhardt, Sinnwell, and Kraus Citation1989; Mullen et al. Citation2004), allowed reliable quantitative data to be obtained for a limited range of metabolites, but supplies are limited, and for many laboratories, prohibitively expensive from commercial sources. This led to calibrants such as quercetin (e.g. de Vries et al. Citation2001; Wiczkowski et al. Citation2008; Cialdella-Kam et al. Citation2013), Q3G (Chalet et al. Citation2018) or quercetin-4′-glucoside (Mullen, Edwards, and Crozier Citation2006; Lee et al. Citation2012) being used to quantify multiple phase-2 conjugates, but Ottaviani et al. reported that (–)-epicatechin phase-2 conjugates did not respond with the same intensity as (–)-epicatechin aglycone, or each other, and that the relative response varied with the composition of the solvents and the LC–MS instrumentation (Ottaviani et al. Citation2018). Accordingly, this means relative response factors laboriously determined on one system cannot automatically be transferred to another. Similarly, quercetin phase-2 conjugates differ markedly in their ionization during MS, the slopes of their calibration curves ranging from 0.1140 to 4.4466 (39-fold) for quercetin and 17 quercetin phase-2 conjugates (Tanaka et al. Citation2019).
The following example indicates the magnitude of this effect if quercetin is used as the calibrant for the major quercetin phase-2 conjugates. If each analyte in the sample gave a unit MS response, then using quercetin aglycone as calibrant each analyte would be recorded as 0.53 μmol/l. This would be correct for quercetin aglycone but not for the conjugates, for which the correct calibrant would give: Q3G = 1.33 μmol/l; Q3′G = 0.75 μmol/l; Q4′G = 0.42 μmol/l; Q7G = 0.71 μmol/l; Q3′S = 1.03 μmol/l and 3’MQ3G = 1.91 μmol/l for unit MS response. Distortion introduced by using an alternative calibrant might be sufficient to misidentify the dominant route of metabolism and to give a false impression of the concentrations that might occur in vivo and whether these might be sufficient to produce a biological effect that had been demonstrated in vitro. Although it is rare for quercetin phase-2 conjugates to be present at concentrations sufficient to permit their quantification at λmax of UV and visible light (Day et al. Citation2001), such data as are available for quercetin and isorhamnetin glycosides (isorhamnetin-3-rutinoside 16,123, quercetin-3-rutinoside 17,000 and quercetin-3-glucoside 18,349 M−1 cm−1 suggest that their molar extinction coefficients will differ far less than their MS response, potentially making a quercetin-glycoside a reasonable calibrant (Kaeswurm et al. Citation2021). However, the molar extinction coefficient for quercetin aglycone (22,362 M−1 cm−1) is about one third larger than for quercetin-3-glycosides (Morand et al. Citation1998), and a similar result was obtained by Peron et al. (quercetin = 21,500 and quercetin-3-rutinoside = 15,250 M−1 cm−1) (Peron et al. Citation2017). It has not been possible to locate the equivalent data for quercetin phase-2 conjugates.
The advent of LC–high resolution MS able, for example, to distinguish between the methyl-quercetin-glucosides Mr = 478.11112 and quercetin-glucuronides with Mr = 478.07474, and more recently LC–Ion mobility-MS-MS coupled with in silico modeling of the collision cross section (Chalet et al. Citation2018; Citation2019), has allowed more metabolites to be characterized to regio-isomer level (see and ), but quantification remains a problem. It has been suggested that the most economical approach is to revert to enzyme hydrolysis but use purified recombinant β-glucuronidase and sulfatase which offer a much superior and consistent hydrolytic performance with 36 out of 38 metabolites tested (Lessard-Lord, Plante, and Desjardins Citation2022) but note that the performance with quercetin phase-2 conjugates was not explicitly evaluated. While this approach uses the relatively cheap aglycones for quantification and avoids the requirement for scarce and expensive phase-2 conjugates, it perpetuates the lack of reliable quantitative data for those conjugates. A possible compromise would be to collect single metabolite chromatographic fractions, remove organic solvents, hydrolyze with the recombinant enzymes (or acid for quercetin), quantify the aglycone and establish a response factor for each conjugate in that analytical procedure. Once this was done, then the appropriate factor could be used in future analyses using that equipment and would appear to be superior to the immobilized enzyme method (Tsiara et al. Citation2023) when needing to discriminate between regio-isomers of, for example, quercetin phase-2 conjugates. Because of the limitations described above, this review will place greater emphasis on the limited quantitative data obtained with authentic calibrants or measured at λmax.
Table 2. Quercetin phase-2 conjugates in 24-h urine quantified with authentic standards.
Table 3. Data for the dominant quercetin phase-2 conjugates in human plasma quantified with authentic standards.
Quercetin, isorhamnetin and tamarixetin aglycones are sometimes reported at low concentrations in human tissue samples, but it has been noted that the content of these aglycones may be seven-fold over-estimated because of artefactual β-glucuronidase hydrolysis during sample workup largely eliminated by incorporating the β-glucuronidase inhibitor 1,4-saccharolactone into the extraction medium (Lu et al. Citation2014). The role of β-glucuronidase in the reactivation of quercetin in vivo is discussed in section 5.2.6.
3. Human studies on absorption and metabolism of quercetin
3.1. Overview of quercetin absorption
The absorption of flavonol glycosides, intracellular metabolism and presence in the circulatory system has been discussed in detail (Williamson, Kay, and Crozier Citation2018) and will not be repeated here, but the following outline helps set the context for a discussion of the potential biological effects of quercetin metabolites. Whether quercetin phase-2 conjugates appear in plasma within an hour of consumption of quercetin glycosides, or around four or more hours post-consumption, depends on the identity of the sugar. Accordingly, the concentration time course of quercetin phase-2 conjugates will vary with the commodity consumed.
Quercetin-4′-glucoside and −3,4′-diglucoside, characteristic of onions, shallots and related vegetables, and the more widely distributed quercetin-3-glucoside, −3-galactoside and −3-xylosideFootnote1 yield quercetin phase-2 conjugates in plasma within an hour of consumption and are not recovered from ileostomy fluid after, for example, consumption of cloudy apple juice (Kahle et al. Citation2005; Citation2006). At high doses, a portion of these glycosides may pass unchanged to the lower bowel as indicated by plasma 3’MQ3G and QSG still at ca 60% of their small intestinal Cmax 6 hours after consuming red onion-derived quercetin glucosides (Mullen, Edwards, and Crozier Citation2006). In contrast quercetin-3-rutinoside, characteristic of green tea, black tea and tomatoes, plus the less common −3-arabinoside found for example in cranberries and apples (Németh et al. Citation2003; Vvedenskaya et al. Citation2004) and −3-rhamnoside found in apples (Lee et al. Citation2012), are recovered from ileal fluid (Kahle et al. Citation2006) and do not yield plasma phase-2 quercetin conjugates until hydrolyzed by the gut microbiota as clearly illustrated when volunteers consumed tomato juice (Jaganath et al. Citation2006). Uptake of quercetin released from glycosides in the colon is less than 100%. Not only are significant amounts of quercetin degraded by the gut microbiota (Baba et al. Citation1981; Jaganath et al. Citation2006) but also quercetin aglycone is present in fecal water (0.16–1.30 μmol/l, 8-fold, N = 5) (Jenner, Rafter, and Halliwell Citation2005). In view of the detection of substantial amounts of insoluble quercetin aglycone in human duodenal fluid in vivo (Chalet et al. Citation2018), it is also possible that some insoluble quercetin was missed by Jenner et al. who prepared the fecal water simply by centrifugation.
When quercetin glycosides from both groups are consumed simultaneously the plasma profiles may be biphasic with maxima for total quercetin after enzymic hydrolysis at ca 1.2 and 5.5 h with a clear minimum at ca 4 h after volunteers consumed a herbal extract containing quercetin-3-galactoside, −3-glucoside and −3-rutinoside (Schulz et al. Citation2005). Because there are significant species differences in metabolism the gold standard methodology for elucidating human metabolic pathways is a study on volunteers using a labeled substrate. The use of a labeled substrate locates metabolites unequivocally derived from the labeled substrate rather than solely some other component of the diet, such as components of protein (Russell et al. Citation2013; Clifford et al. Citation2022), or from endogenous metabolism of, for example, catecholamines (Combet et al. Citation2011). It does not indicate that other sources do not exist, and metabolites which have not retained the label may be overlooked. Because of ethical considerations and cost, such human studies are scarce, and we have located only two using isotopically-labeled substrates. We have also found five clinical studies with unlabeled substrates, in two of which quercetin was given intravenously (i.v.) providing accurate data for elimination and an assessment of safety at high doses. Clinical studies in which volunteers were given an enzymically modified but unlabeled quercetin-glucoside supplement or unlabeled quercetin-3-glucoside as a γ-cyclodextrin inclusion complex are discussed in section 3.3.7. (Murota et al. Citation2010; Kapoor et al. Citation2021).
3.2. Studies with labeled substances and gut microbiota metabolism
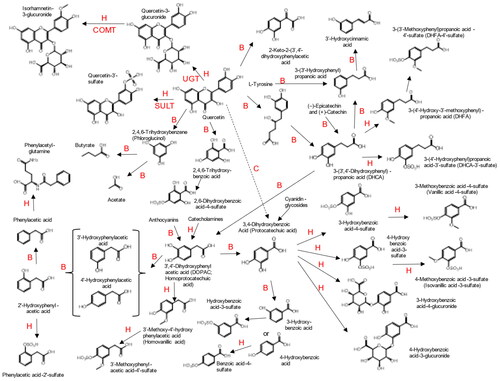
The overall pathway of quercetin metabolism, including metabolism by the gut microbiota and by mammalian tissues, is shown in , and the basic chemical properties of quercetin conjugates are summarized in . When two volunteers consumed [2′,5′,6′-2H3]-quercetin-3-rutinoside (10 mg/kg; 1.6 μmol/kg), it yielded after enzymic hydrolysis labeled 3′-hydroxyphenylacetic acid, 3′,4′-dihydroxyphenylacetic acid and 4′-hydroxy-3′-methoxyphenylacetic acid, 1,2-dihydroxy-4-methylbenzene (3,4-dihydroxy-toluene; 4-methyl-catechol), and 3-hydroxy-3-(3′-hydroxyphenyl)propanoic acid (3-hydroxyphenylhydracrylic acid) from the B-ring. Quercetin aglycone was not found in urine and the fate of the unlabeled A-ring was not defined (Baba et al. Citation1981). In vitro studies have demonstrated that Clostridia spp. and Eubacterium ramulus isolated from the human gut rapidly degrade quercetin aglycone whether in solution or suspension but are unable to hydrolyze the glycosides, and this step requires other genera such as Enterococcus (Winter et al. Citation1989; Schneider et al. Citation1999; Braune et al. Citation2001). 3′,4′-Dihydroxyphenylacetic acid and 4′-hydroxy-3′-methoxyphenylacetic acid are also associated with catecholamine metabolism (Combet et al. Citation2011) and 3-hydroxy-3-(3′-hydroxyphenyl)propanoic acid with metabolism of phenylalanine and tyrosine (Russell et al. Citation2013; Clifford et al. Citation2022) and without the label their origin would have been equivocal. A substantial production of these C6–C2 gut microbiota metabolites is characteristic of flavonols—most other dietary (poly)phenols produce little C6–C2 and substantial amounts of C6–C5, C6–C3, and C6–C1 metabolites (Clifford et al. Citation2022).
Figure 2. Pathways of quercetin metabolism. B: gut microbiota; H: human. Nomenclature follows the recommendations of Kay et al. (Citation2020).
When six volunteers were dosed orally (100 mg; 330 μmol) and i.v. (0.3 mg; 1 μmol) with [4-14C]-quercetin, absorption was substantial (36%–53%), but total label recovery was only 45–69% (N = 3). Expiration of labeled CO2, which was derived only from one of the 15 carbons (C4) and may therefore be an underestimate of total CO2 production, was variable but could be extensive (42%–64%, N = 3) and (23%–81%, N = 3) after oral and i.v. dosing respectively. Expiration commenced in the period 3–4 h post-dosing and was maximal 6–7 h post-dosing except for one volunteer, for whom it did not commence before 8 h post-dosing. Labeled CO2 expiration did not return to baseline until 36 h post-dosing indicating that some labeled metabolite(s) had been retained. Elimination of total [14C] from plasma was measured in four volunteers with half-lives of 20, 33, 36 and 72 min (3.6-fold difference between individuals). Urinary recovery of total radioactivity after oral dosing was 3.3%–5.7%, but 18%–27% after i.v. dosing with an elimination half-life for total radioactivity varying from 20 to 72 h across four volunteers. Fecal recovery of total radioactivity was 0.2%–4.6% (23-fold; N = 6) and 1.5–5% (3.3-fold; N = 4) after oral and i.v. dosing respectively, consistent with some biliary excretion of substrate and/or phase-2 conjugates (Walle, Walle, and Halushka Citation2001). Gut microbiota catabolites which did not retain C4, such as the phenylacetic acids and 1,2-dihydroxy-4-methylbenzene reported by Baba et al. after enzymic hydrolysis (Baba et al. Citation1981) and 2-methoxy-phenol (guaiacol) reported without hydrolysis by Cialdella-Kam et al. (Citation2013) could not be detected in this study because they would not contain the C4 label (Walle, Walle, and Halushka Citation2001), but 2-methoxyphenol should have been as easily detected as the phenylacetic acids and 1,2-dihydroxy-4-methylbenzene after dosing with [2′,5′,6′-2H3]-quercetin-3-rutinoside. Note that 1,2-dihydroxy-4-methylbenzene and 2-methoxyphenol have identical mass (124.0524) and other regio-isomers of both are possible. There are several studies where 1,2-dihydroxy-4-methylbenzene as a gut microbiota metabolite of quercetin or rutin has been confirmed with an authentic standard (Baba et al. Citation1981; Sawai et al. Citation1987; Labib et al. Citation2004; Guo et al. Citation2022). In contrast Cialdella-Kam et al. relied on matching their MS data to archived data in a range of commercial databases and might have mis-assigned the 2-methoxyphenol—as discussed previously such databases must be used with caution (Clifford and Kuhnert Citation2022).
Sawai et al. reported that the plasma concentration of 1,2-dihydroxy-4-methylbenzene peaked (ca 95 μmol/l) at ca 8 h post-consumption and returned to a steady non-zero value (ca 60 μmol/l) after 24 h suggesting that quercetin-3-rutinoside was not the only source. It was excreted predominantly as phase-2 conjugates with extreme inter-individual variation (mean ± s.d. 7.77 ± 8.52 over 48 h), but the units were not defined (Sawai et al. Citation1987). An alternative source is indicated also by data from Carmella et al. who reported the excretion of 27 ± 19 μmol/24 h, predominantly conjugated with sulfate, by volunteers on unrestricted diets, but greater amounts (65 ± 14 μmol/24 h) excreted by volunteers on animal protein-replete low (poly)phenol diets (Carmella, La Voie, and Hecht Citation1982). Note that the synthetic standard made available to several research groups is a mixture of two isomeric sulfates (2-hydroxy-4-methylbenzene-sulfate and 2-hydroxy-5-methylbenzene-sulfate), which are difficult to resolve chromatographically (Pimpão et al. Citation2015), and it is not known which isomers occur.
We have not found any studies where administered quercetin was labeled in the A-ring, but it appears that the A-ring is released transiently as 2,4,6-trihydroxybenzene (phloroglucinol) and isomerized to 1,2,3-trihydroxybenzene (pyrogallol) or reduced to 3,5-dihydroxycyclohex-3-en-1-one (dihydro-phloroglucinol) followed by ring opening to yield 3-hydroxy-5-keto-hexanoic acid (Krumholz et al. Citation1986; Krumholz and Bryant Citation1986; Krumholz et al. Citation1987; Krumholz and Bryant Citation1988), a substrate for α- and β-oxidation. The yield of gut microbiota metabolites varies markedly between individuals dependent not only on their diet, but also variations in their microbiome as reviewed by Kerimi et al. (Kerimi et al. Citation2020).
3.3. Human intervention and clinical studies
3.3.1. Absorption and metabolism of quercetin using pure compounds
Gugler et al. gave six volunteers single i.v. (100 mg; 331 μmol) and oral (4 g; 13 mmol) doses of quercetin aglycone. Volunteer weights were not given, but assuming 65 kg these doses correspond to ca 5 μmol/kg and 200 μmol/kg, respectively. The pharmacokinetic data fitted a two-compartment open model with half-lives (mean ± s.e.) of 8.8 ± 1.2 min (2.5-fold variation) and 2.4 ± 0.2 h (2.1-fold). The first phase relates to a combination of metabolism, plasma protein binding, and tissue uptake, and the second phase relates to renal clearance once the two compartments are in equilibrium. Protein binding was extensive, >98%, consistent with the short distribution phase and small volume of distribution 0.34 ± 0.03 l/kg. Note that Q3G has been reported in human low-density lipoprotein (0.073 nmol rutin equivalents/mg LDL-protein) (Lamuela-Raventós et al. Citation1999) and foam cells (Kawai, Nishikawa, et al. Citation2008), and it has since been established that all QG bind strongly to human serum albumin (Janisch et al. Citation2004). Binding diminished but did not eliminate the ability of the quercetin phase-2 conjugates to protect low density lipoprotein from oxidation in vitro (Janisch et al. Citation2004). After i.v. dosing, plasma concentration was 12 ± 1.8 μmol/l (mean ± s.e.; 2.7-fold variation), 7.4 ± 1.2% of dose was excreted in urine as phase-2 conjugates and 0.65 ± 0.1% excreted unchanged. After oral administration, the plasma and urine concentrations of quercetin were below the limit of detection, suggesting absorption was less than 1% of dose, but note that the method was much less sensitive in 1975 than currently. Fecal recovery of quercetin after oral dosing was only 53 ± 5% indicating extensive gut microbiota transformation, prompting the authors to question whether oral dosing of flavonoids was worthwhile (Gugler, Leschik, and Dengler Citation1975).
Some 20 years later, Ferry et al. performed a Phase 1 clinical trial in which quercetin aglycone was given to 14 patients receiving treatment for various cancers as a short i.v. infusion of increasing doses from 60 mg/m2 to 1700 mg/m2 at intervals of three weeks. Clinically significant nephrotoxicity was observed only at the highest dose (1700 mg/m2) but some renal impairment was still observed with several patients at the 1400 mg/m2, 945 mg/m2 and 630 mg/m2 doses, but not at lower doses. The pharmacokinetic data fitted a two-compartment model, the first phase with a median T0.5 value of 6 min and the second phase of 43 min (Ferry et al. Citation1996), the elimination phase considerably shorter than reported by Gugler et al. (Gugler, Leschik, and Dengler Citation1975). These values cannot be compared with those provided by Walle, Walle, and Halushka (Citation2001) because they referred to total [14C]-labeled quercetin plus metabolites rather than quercetin alone.
To facilitate comparison with other studies, we have calculated doses assuming that the patients were 1.7 m tall and weighed 65 kg, in which case doses of 60 mg/m2 to 1700 mg/m2 correspond to a range of ca 1.62 mg/kg (5.4 μmol/kg) to ca 46 mg/kg (152 μmol/kg). This vastly exceeds normal dietary intakes which would be predominantly of glycosides consumed in several portions throughout the day. Ferry et al. reported that the plasma concentration across 11 volunteers was in the range 200–400 μmol/l immediately after injection of the 945 mg/m2 (84 μmol/kg) dose. Plasma quercetin remained above 1 μmol/l for up to four hours but at early time points HPLC analysis revealed peaks which were assumed to be quercetin metabolites. It was subsequently confirmed that 3′MQ, a QS and at least six other metabolites appeared in plasma within five minutes and that by 30 min Q and 3′MQ were no longer detectable (Jones Citation2001). For one patient on a 945 mg/m2 (84 μmol/kg) dose, the quercetin concentration in ascitic fluid was 0.34 μmol/l, some 20% of that patient’s plasma concentration. Urinary excretion of quercetin aglycone was measured over 24 h in eight patients and ranged from 0.03–7.6% of the dose (Ferry et al. Citation1996), a 250-fold variation.
As discussed more fully below, these plasma concentrations greatly exceed the transient Cmax values observed when test meals are consumed, where the summed concentration of all quercetin phase-2 conjugates is usually below 1.2 μmol/l and sometimes undetectable (Saenger, Hübner, and Humpf Citation2017). The true half-lives are much shorter than the apparent half-lives (3.7 ± 1.2 h for total quercetin after consuming apple juice and 46 ± 9 h after consuming shallots, 5.7 ± 0.6 h and 6.9 ± 0.3 h for Q3G and 3’MQ3G, respectively, after consuming tomato juice or 2.33, 5.34 and 1.71 h for Q3G, 3’MQ3G and Q3′S, respectively, after consuming onions (Lee et al. Citation2012; Jaganath et al. Citation2006; Mullen, Edwards, and Crozier Citation2006; Kahle et al. Citation2011; Wiczkowski et al. Citation2008). Note also that test meals frequently use larger bolus doses than would be consumed at mealtime by the general population.
In an interesting clinical study six volunteers were nasally intubated with a double-lumen polyvinyl catheter, the end positioned in the duodenum and duodenal fluid samples (5 ml) collected every 15 min for four hours after consumption of encapsulated quercetin (500 mg; 1.65 mmol) with 240 ml tap water. These samples were analyzed by LC–MS/MS (Chalet et al. Citation2018) and subsequently by LC–IMS-MS. Chalet et al. assigned 11 quercetin metabolites at regio-isomer level as shown in . They also observed several QS, two 3′MQS and two 4′MQS in HT29 and 3D human intestine but these could not be quantified or assigned at regio-isomer level (Chalet et al. Citation2019) but were clearly present at more than trace concentrations. Only quercetin aglycone, Q3′G and Q4′G were quantifiable. Duodenal fluid Tmax was ca 90 min for quercetin aglycone (quantified with quercetin), Q3′G and Q4′G with Cmax of ca 31 μmol/l, ca 4 μmol/l and ca 1 μmol/l, respectively, but note that both glucuronides were quantified as Q3G. Reference to the response factors determined by Tanaka et al. suggests that using Q3G as the calibrant might have significantly over-estimated the concentrations of Q3′G (1.8-fold) and Q4′G (3.2-fold) (Tanaka et al. Citation2019), but it is not certain that exactly the same responses would have been obtained on the instrument used by Chalet et al. (Citation2018). A substantial amount of insoluble quercetin aglycone (ca 98% of the total) was also detected. This is unsurprising because quercetin aglycone, whether anhydrous or dihydrate, is barely soluble in water at pH 7 and 37 °C (ca 4.5 mg/l; ca 15 μmol/l) (Razmara, Daneshfar, and Sahraei Citation2010; Srinivas et al. Citation2010) although a solubility of 37 μmol/l has been recorded ex vivo in fasted state human duodenal fluid. It is not known whether the luminal concentration of quercetin aglycone might be sufficient to inhibit the active duodenal vitamin C transporter, SVCT1, in vivo for which the IC50 after transfection into Chinese hamster ovary cells was reported as 15 μmol/l (Song et al. Citation2002), but at 20 μmol/l, quercetin aglycone provided less than 10% inhibition of sucrase (EC 3.2.1.48), maltase (EC 3.2.1.20) and isomaltase (EC 3.2.1.10) in vitro (Barber, Houghton, and Williamson Citation2021). Martinez-Gonzalez et al. reported that quercetin produces mixed type inhibition of porcine pancreatic lipase (EC 3.1.1.3) in vitro (IC50 6.1 ± 2.4 μmol/l) (Martinez-Gonzalez et al. Citation2017) whereas Zhou et al. (Citation2021) reported a very different value: IC50 = 232 μmol/l), which is a concentration some 8-fold above its limit of solubility in human duodenal fluid. In vitro trypsin inhibition by quercetin has been extensively investigated with IC50 values reported in the range ca 3–19 μmol/l (Cuccioloni et al. Citation2009; Raza and Shahwar Citation2013; Li et al. Citation2014; Martinez-Gonzalez et al. Citation2017), and some modest in vivo effect is plausible even allowing for the more complex matrix in the duodenum compared with the in vitro incubations.
Even Q3′G and Q4′G were saturated with only 71% and 97% of the total, respectively, in solution (Chalet et al. Citation2018) but only unquantifiable traces of Q3G and Q7G were found in duodenal fluid. Kahle et al. (Citation2006) reported that quercetin glucuronides and sulfates could not be recovered from ileal effluent after ileostomist volunteers consumed cloudy apple juice containing 24.2 μmol quercetin-glycosides, but Mullen reported the major phase-2 conjugates in ileal fluid after onion consumption (supplying 275 μmol quercetin glucosides) were Q3′G and Q3′S (Mullen Citation2009). Collectively, these observations suggest extensive efflux of Q3′G and Q4′G from the enterocyte, even if over-estimated by Chalet et al. Consistent with this distinctive behavior of QG regio-isomers in vivo, it has been shown in vitro that of the four quercetin-glucuronides, Q4′G interacts most strongly and Q3G most weakly with the apical efflux transporter MRP2 (ABCC2) in Caco-2 cells (Williamson et al. Citation2007). Glucuronidation of phenolics is catalyzed by UDP-glucuronosyl transferase (UGT). Basit et al. reported the absolute abundance of UGT proteins in human intestine as 1A10 > 2B17 > 2B7 > 1A1 > 1A3 (Basit et al. Citation2020) whereas Sato et al. reported 2B17 > 1A1 > 1A10 in human intestinal microsomes (Sato et al. Citation2014). In vitro studies have provided data for the regio-selectivity of these isoforms except for 2B17—UGT1A1 and 1A3 favor formation of Q3′G, 2B7 yields near equal amounts of Q3G and Q3′G whereas 1A10 yields near equal amounts of Q7G and Q3G (Boersma et al. Citation2002). Whatever the regio-specificity of 2B17 might be, it seems certain that all four mono-glucuronides will be produced in significant amounts if all these UGT isoforms are present and operating. Relating these data to the findings of Chalet et al. suggests that significant amounts of Q7G and Q3G will be effluxed into the blood. Indeed, Q3G has been reported as the dominant regio-isomer in human plasma after LC–MS quantification with authentic Q3G (Mullen et al. Citation2004; Mullen, Edwards, and Crozier Citation2006) and by Day et al. using UV quantification accompanied by substantial amounts of 3’MQ3G, moderate amounts of Q3′G, and smaller amounts of 3’MQ4′G, Q4′G and QdiG (Day et al. Citation2001). Q7G was not reported in either study with onions.
O’Leary et al. reported that HepG2 intracellular β-glucuronidase can hydrolyze Q3G and Q7G with the released aglycone being converted to Q3′S and possibly Q4′G, but QdiG and QSG were not detected. Q3′S production was increased when COMT was inhibited with 3,4-dinitrocatechol (O’Leary et al. Citation2003) suggesting that methylation and sulfation are competing pathways. Plausibly β-glucuronidase activity in the liver explains why Q7G was not detected in human plasma and why Q3′S is the dominant metabolite based on UV peak area in the Day et al. study with pooled human plasma. Coupled with the absence of Q3′S from urine but its presence in ileal fluid after the consumption of onions (Mullen Citation2009), this suggests excretion in bile, and possibly efflux from the enterocyte. However, although Barrington et al. reported efflux of Q3′S to the apical side of Caco-2 cells in vitro (Barrington et al. Citation2009), Chalet et al. did not detect Q3′S in human duodenal fluid in vivo (Chalet et al. Citation2018), and unless sulfate conjugates were rapidly hydrolyzed in the gut lumen this suggests that biliary excretion probably dominates. In contrast, Q3′S was not detected in plasma or ileal fluid after the consumption of tomato juice but this may simply reflect the much lower quantity of Q3G available for deglucuronidation and sulfation in the liver—unfortunately the AUC values are not available, but the difference is clearly shown by the ca 30-fold difference in plasma Cmax (see ) coupled with a relatively late Tmax, of 4 h vs 36 min in the onion study. Sulfation is catalyzed by sulfotransferases (SULTs). The dominant isoforms in the gut are SULT1A1 and SULT2A1, whereas SULT1A3, 1B1 and 1E1 are the dominant isoforms in the liver (Basit et al. Citation2020). Their regio-specificity has been little studied, but Pei et al. reported that SULT1EI produced only Q3′S (Pei et al. Citation2022).
Sixteen patients awaiting a prostatectomy were dosed daily for four weeks with 830 mg green tea polyphenols (GTP) and 15 similar patients were dosed with 830 mg green tea polyphenols plus 800 mg (2.65 mmol) quercetin aglycone. Tissue taken during the prostatectomy contained ca 20 pmol/g and ca 65 pmol/g quercetin after hydrolysis for the GTP and GTP + quercetin groups, respectively. The corresponding data for 3′MQ after hydrolysis were ca 2 pmol/g and 15 pmol/g. Co-administration of quercetin aglycone daily for one month prior to surgery doubled the EGCG and EGC mean contents to ca 180 pmol/g and 200 pmol/g, respectively. Compared with baseline, mean urinary quercetin was ca 15-fold higher (ca 650 nmol/g creatinine after hydrolysis) and mean urinary 3′MQ after hydrolysis was ca five-fold higher at ca 220 nmol/g creatinine. According to Feher (Feher Citation2017), a typical 70 kg adult male excretes about 2 g (ca 0.18 mol) creatinine per day which would suggest 24-h excretion of ca 1.3 μmol of quercetin and 0.44 μmol of 3′MQ. Immediately before the consumption of the last supplement, plasma quercetin after hydrolysis (mean ± s.d.) was 15.1 ± 15.3 nmol/l for the GTP group and 175 ± 92.1 nmol/l for the GTP plus quercetin group and these increased to 30.4 ± 24.4 nmol/l and 420 ± 190 nmol/l two hours after consuming the final supplement (Henning et al. Citation2020). Fifteen healthy normotensive volunteers in a double-blind randomized study were given either placebo, 200 mg (0.66 mmol) quercetin or 400 mg (1.32 mmol) quercetin, and this produced a dose–response increase in Q3G concentration in plasma but no effect on blood pressure (Perez et al. Citation2014). Sesink et al. gave volunteers Q-3-glucoside and Q-4′-glucoside (325 μmol) and recorded four glucuronides (Sesink, O’Leary, and Hollman Citation2001) but did not characterize these at regio-isomer level.
Fifty patients with type 2 diabetes enrolled in a double-blind study were randomly assigned to a control or experimental group in which they received placebo or rutin (1 g, 1.64 mmol) for 3 months, respectively. Plasma and urine metabolites were not reported but rutin consumption caused a significant reduction in systolic and diastolic blood pressure, pulse pressure, mean arterial pressure and heart rate accompanied with increases in glutathione peroxidase, superoxide dismutase and catalase (Bazyar et al. Citation2023). In a similar study by the same research group, 50 type 2 diabetic patients received either rutin (500 mg, 0.82 mmol) or placebo daily for 3 months. The rutin group registered a significantly lower fasting blood glucose, insulin, glycosylated hemoglobin, low- and high-density lipoprotein cholesterol, IL6 and brain-derived neurotrophic factor (Bazyar et al. Citation2023). Eighty-seven participants received either 500 mg/day (0.82 mmol/day) encapsulated rutin, yoghurt supplemented with 500 mg (0.82 mmol) rutin, or placebo over 12 weeks in a double blind randomized clinical trial. There was no change in plasma glucose as determined by an oral glucose tolerance test (Mathrani et al. Citation2023).
3.3.2. Absorption and metabolism of quercetin using foods and beverages
We have found volunteer studies where the test meal was Sea Buckthorn with oatmeal porridge (Suomela et al. Citation2006), red wine, black tea or onions (de Vries et al. Citation2001), green tea, black tea or black tea with milk (Hollman et al. Citation2001), blackcurrant and apple juice (Young et al. Citation1999), red wine, onions and black tea (de Vries et al. Citation2001), onion soup (Romaszko et al. Citation2014) onions and tomatoes (Boyle et al. Citation2000), shallots (Wiczkowski et al. Citation2008), onions (Moon et al. Citation2000), onions and black tea (O’Reilly et al. Citation2001) and canned green tea (Jin et al. Citation2004) in which the plasma and urine samples were hydrolyzed before analysis and provide no information about quercetin phase-2 metabolites. In studies using tomatoes (Simonetti et al. Citation2005), a herbal extract (St John’s wort Hypericum perforatum) (Schulz et al. Citation2005), a mixed polyphenol drink (Mullen et al. Citation2010), blueberries (Feliciano, Istas, et al. Citation2016), cranberries (Feliciano, Boeres, et al. Citation2016; Wang, Singh, et al. Citation2016; Feliciano et al. Citation2017; Peron et al. Citation2017) maté (Gómez-Juaristi et al. Citation2018) and apple snacks (Yuste et al. Citation2019; Rubió et al. Citation2021; Macià et al. Citation2022), plasma and urine from volunteers were analyzed without hydrolysis. The apple snack study provided volunteers with ca 35–40 μmol quercetin glycosides, predominantly quercetin-3-glucoside, −3-arabinoside and −3-rhamnoside. Characteristic quercetin gut microbiota metabolites were readily detected in urine and plasma, but quercetin phase-2 conjugates were not, reflecting a relatively small dose in a solid matrix impairing absorption in the small intestine.
Graefe et al. conducted a four-way comparison in which 12 volunteers consumed onion soup (331 μmol quercetin glycosides), quercetin-4′-glucoside (331 μmol), buckwheat tea (662 μmol quercetin glycosides), and quercetin-3-rutinoside (662 μmol), and analyzed plasma and urine samples both before and after enzymic hydrolysis by LC–coulometric array for plasma and LC–UV for urine. Unfortunately, the calibrant(s) used are not clearly defined. The pharmacokinetic data for onion soup and quercetin-4′-glucoside were essentially identical, as were the data for buckwheat tea and quercetin-3-rutinoside except for a higher mean Cmax with buckwheat tea (2.1 ± 2.2 vs 1.0 ± 1.1 μmol/l), but with distinct differences between the two groupings. Despite the lower quercetin-glycoside dose onion soup produced a relatively rapid Cmax at 0.7 h which was approximately four-fold larger than the buckwheat tea where the Cmax occurred beyond 4 h. Quercetin-4′-glycoside produced a Cmax at 0.7 h some 7-fold larger than quercetin-3-rutinoside at ca 7 h post-consumption. Interestingly, there were significant differences for the Cmax quotients (largest/smallest)—onions 5.6, quercetin-4′-glucoside 9.4, buckwheat tea 37.3 and quercetin-3-rutinoside 52. Percentage recoveries (mean ± s.d.) of quercetin and isorhamnetin from urine over 48 h were 6.4 ± 2.5% for onions, 4.5 ± 1.7% for quercetin-4′-glucoside, 1 ± 0.8% for buckwheat tea and 0.9 ± 0.9% for quercetin-3-rutinoside (Graefe et al. Citation2001). The greater variation for buckwheat and quercetin-3-rutinoside probably reflects variation in the gut microbiota and the extent to which the quercetin aglycone is degraded rather than absorbed. In buckwheat seeds quercetin-3-rutinoside dominates (0.8–1.7%) accompanied by quercetin-3-glucoside (ca 0.05%) (Fabjan et al. Citation2003).
An investigation of 90 free-living individuals with mild cognitive impairment reported Q3′S (mean ± s.d. 18.1 ± 0.01 nmol/l) and Q3′G (mean ± s.d. 4.5 ± 0.05 nmol/l) have been reported in the cerebrospinal fluid demonstrating their ability to cross the blood–brain barrier. Quercetin aglycone and Q7G were below the LOQ (1.65 and 8.36 nmol/l, respectively). Concentrations (mean ± s.d.) in plasma for the same population were Q3′S 970 ± 2014 nmol/l, Q3G 105 ± 181 nmol/l, Q7G 707 ± 556 nmol/l and quercetin aglycone 344 ± 179 nmol/l. The corresponding median values for plasma were Q3′S 91.9 nmol, Q3G 17.3 nmol/l, Q7G 542 nmol/l and Q 312 nmol/l (Le Sayec et al. Citation2023) indicating extremely skewed distributions (Pearson skewness coefficients of 1.31, 1.45, 0.89 and 0.53, respectively).
3.3.3. Studies on dose–response and repeated multiple consumption
When volunteers consumed a mixed polyphenol-rich drink supplying 5.2 μmol quercetin glycosides plus 2.3 μmol preexisting quercetin-3-glucuronide, quercetin phase-2 conjugates were below the LOD in plasma and urine (Mullen et al. Citation2010). However, flavonols are widely distributed in dietary components and more than one source of quercetin might often be consumed in a meal, and beverages such as green tea, black tea and maté are commonly consumed at short intervals throughout the day. This scenario presents an opportunity for a gradual accumulation of quercetin phase-2 metabolites in plasma especially when early and late absorption allow overlap of successive bolus doses. This phenomenon could impact significantly on the ability of quercetin phase-2 conjugates to exert any biological effect in vivo, but it has been little investigated.
When nine volunteers consumed at 2-h intervals eight cups of black tea (each supplying ca 14 μmol quercetin-glycosides) mean total plasma quercetin (after acid hydrolysis) increased from ca 6 nmol/l to ca 36 nmol/l and declined overnight to ca 31 nmol/l. This protocol was continued for two further days, generating maxima of ca 42 and ca 46 nmol/l and declining thereafter to ca 30 nmol/l. A concentration of not less than ca 25 nmol/l was maintained for ca 70 h. The same protocol was used for black tea plus 10% semi-skimmed milk, and for green tea (ca 13 μmol quercetin-glycosides per cup), with very similar results (Hollman et al. Citation2001).
Repeating a single daily dose of blueberries for 30 days did not significantly increase the mean ± s.d. daily excretion (39.7 ± 36 μmol and 50 ± 72 μmol) or plasma concentration of Q3G, which even after the 30th dose was only 9 ± 8.5 nmol/l (Feliciano, Istas, et al. Citation2016) although the magnitude of the s.d. indicates very large variability and the likelihood that these values may have increased for certain individuals. The quercetin glycoside profile of the blueberries was not provided but based on other data it is likely that quercetin-3-galactoside would dominate accompanied by significant amounts of quercetin-3-glucoside, and smaller amounts of −3-rhamnoside, a −3-pentoside (? xyloside) and −3-rutinoside (Vrhovsek et al. Citation2012). Similarly, extending a study of a herbal extract containing quercetin-3-galactoside, −3-glucoside and −3-rutinoside to one dose per day over 14 days had no detectable effect on plasma profile of total quercetin after hydrolysis (Schulz et al. Citation2005). When for a week five volunteers consumed on separate occasions three doses (750, 1000 and 1500 ml) of a blackcurrant and apple juice beverage delivering per day 4.8, 6.4 or 9.6 mg (16, 21 or 32 μmol) quercetin as undefined glycosides the recovery in urine after hydrolysis ranged from 0.29 to 0.47% of the dose. The juice was consumed in 3, 4 or 6 portions of 250 ml spread throughout the day. Despite repeat consumption for one week at short intervals this intake of quercetin glycosides was insufficient to consistently elevate the plasma quercetin after hydrolysis significantly above the levels recorded when the volunteers consumed their basic diet. The basic diet was described as each volunteer’s normal diet from which tea, wine, spices, vegetables and fruit were excluded. These basic diets produced plasma quercetin concentrations after hydrolysis of 49 ± 33 nmol/l, presumably the Cmax values, but this is not stated by the authors, nor did they indicate whether the scatter is s.d. or s.e. (Young et al. Citation1999). The origin of the plasma quercetin when volunteers were consuming their basic diet is unclear, but possibly washout of metabolites associated with foods consumed prior to the commencement of this study and bound to serum albumin or sequestered in tissues, as recently discussed for gut microbiota catabolites (Lamuela-Raventós et al. Citation1999; Pereira-Caro et al. Citation2023). Two other studies sought but failed to find quercetin phase-2 conjugates in washout urine samples (Kahle et al. Citation2011; Gómez-Juaristi et al. Citation2018), but ca 20 nmol/l quercetin (after acid hydrolysis) was recorded by Hollman et al. after 24 h washout, and this declined to ca 6 nmol/l over the following 72 h on a low flavonol diet (Hollman et al. Citation2001), and Heiss et al. recorded Q, Q3S and Q7G (each ca 100 nmol in the final 24 h of 48 h on a low (poly)phenol diet) (Heiss et al. Citation2022). The only other dose–response study located (Rodriguez-Mateos et al. Citation2016; Feliciano et al. Citation2017) provides data for total Q3G in plasma after 10 volunteers consumed five doses of cranberry juice delivering quercetin (13–68 μmol), quercetin-3-rhamnoside (5–24 μmol) and quercetin-3-galactoside (4–20 μmol). The Q3G Cmax values increased in an approximately linear fashion with dose (ca 50–380 nmol/l) at a Tmax of ca 1 h with a suggestion of a second maximum at ca 8 h.
Ten volunteers consumed a diluted cranberry juice delivering 6.2 μmol of quercetin glycosides made up of quercetin-3-galactoside (3.9 μmol), −3-arabinoside (1.1. μmol), −3-rhamnoside (0.7 μmol) and −3-xyloside (0.5 μmol). QG were not detected in urine, but quercetin-3-galactoside, quercetin-3-rhamnoside, and quercetin-3-arabinoside were found at 2.7, 1.5 and 0.8 pmol/mg creatinine, respectively (Wang, Singh, et al. Citation2016). Volunteer body weights were not given but these probably correspond to ca 5, 2.5 and 1.5 μmol per day (Feher Citation2017). In contrast, when six volunteers consumed a beverage prepared from dried cranberry extract and added quercetin delivering 1.47 mmol of quercetin made up of quercetin-3-galactoside (420 μmol), quercetin-3-pentoside (164 μmol), quercetin-3-rhamnoside (195 μmol) and quercetin aglycone (689 μmol) QG and QS were detected in urine at 2-h post-consumption and peaked at 4-h post-consumption. QS were reported as dominant using quercetin aglycone as calibrant (Peron et al. Citation2017) but this relationship may have been distorted as discussed in 2.1, and there was no reference to the excretion of quercetin-glycosides. For further discussion of the absorption of intact glycosides, see section 3.3.9.
3.3.4. Studies on breast milk
The mechanism(s) by which quercetin and/or its phase-2 conjugates transfer to the milk has not been defined. Seventeen mothers provided breast milk samples at 1, 4 and 13 wk post-partum which were analyzed after enzymic hydrolysis yielding 40–77.6, 33.1–108.6 and 32.5–95.9 nmol/l quercetin, respectively, which accounted for some 2%–3% of the total flavonoids quantified (Song, Jouni, and Ferruzzi Citation2013). Similar studies with 13 free-living breastfeeding mothers produced milk containing 24.2–85.4 nmol/l quercetin (Nalewajko-Sieliwoniuk et al. Citation2020), whereas a larger study yielded mean values for quercetin after hydrolysis of 112.9 nmol/l (6% of total, N = 29), 150.6 nmol/l (7%, N = 30), and 142.7 nmol/l (7%, N = 30) for low, medium and high intakes of dietary (poly)phenols, respectively. The corresponding mean data for 3′,4′-dihydroxyphenylacetic acid were 180.3 nmol/l (9%, N = 26), 232.6 nmol/l (12% N = 29) and 277 nmol/l (11%, N = 29).
Eleven free-living, breastfeeding mothers were asked to follow a low-quercetin diet for five days and then consume a standardized onion soup providing 3 μmol/kg quercetin glucosides and return to the low-quercetin diet for a further five days. Milk and maternal urine samples were collected for analysis of quercetin aglycone and total quercetin after deconjugation. At the start of the low-quercetin diet stage of the study quercetin and 3′MQ in breast milk after hydrolysis averaged 45 nmol/l (range: 19–102 nmol/l; 5.4-fold). For some individuals the aglycones after hydrolysis were detectable within 3 h of consuming the soup but for others uptake was not observed prior to 6 h post consumption. The average Tmax was ca 12 h with an average Cmax of 68 nmol/l returning to 42 nmol/l at 48 h post-consumption. Maternal elimination in urine was rapid and ranged from 1.09 to 3.42% of the dose with 3′MQ accounting for 13.6–29.0% of the total aglycones after hydrolysis (Romaszko et al. Citation2014). Romaszko et al. measured flavonol aglycones prior to hydrolysis but unfortunately do not provide any data for them, but it is important to note that UDP-glucuronosyl-transferase enzymes develop postnatally and at least for antivirals clearance and T0.5 are much reduced in the neonate compared with the adult and UGT take ca 20 months to approach the adult values (Pacifici Citation2005; Collier Citation2009). None of these studies were able to quantify the amount of milk produced daily by the mothers, and hence it was not possible to calculate the precise dose that the neonates received, but Romaszko et al. estimated it was ca 33 nmol/day (Romaszko et al. Citation2014) corresponding immediately post-partum to ca 9 nmol/kg some two orders of magnitude less than the mean daily consumption of a free-living adult.
It is interesting to note that the bitter threshold for quercetin aglycone in water has been reported as 1 nmol/l (Yang et al. Citation2022) but whether the concentration of quercetin and its associated phase-2 metabolites could be sufficient to influence the acceptability of the milk has not been investigated.
A study in which maternal mice were dosed with quercetin aglycone at 1% of diet recorded Q, 3′MQ and 12 phase-2 conjugates in maternal milk and Q plus 8 phase-2 conjugates in neonate plasma. Although neonate and maternal plasma profiles were similar, maternal milk was dominated by quercetin aglycone (mean ca 15 μmol/l, 25% of total) and Q3′S (mean ca 12 μmol/l, ca 20% of total) compared with maternal plasma where these two metabolites accounted for only ca 2% of the total and 3′MQ7G4′S and Q7G3′S dominated (mean ca 45% of total, ca 14 μmol/l and mean ca 25% of total, ca 7 μmol/l, respectively).(Fujiwara et al. Citation2023) These metabolites were quantified with authentic standards (Tanaka et al. Citation2022) but note that the plasma profiles of mice are significantly different from human plasma profiles—see . Assuming a mouse consumes daily food corresponding to 10% of its body weight this corresponds to ca 30 mg quercetin (ca 100 μmol) which corresponds to a massive 3.3 mmol/kg or ca 200 mmol/day (ca 60 g/day) for a 65 kg human—and while these observations are of interest, extrapolation to humans must be made with caution.
3.3.5. Pharmacokinetic data
Pharmacokinetic data from volunteer studies can be misleading. Usually, such data are presented as mean ± s.d. or mean ± s.e., often with the s.d. and sometimes the s.e. being larger than the mean valueFootnote2 implying impossible negative values for plasma Cmax or amount excreted in 24 h. Expression as the quotient (largest/smallest) or (largest/LOQ) is preferable but rarely provided and unless data for individual volunteers are provided this cannot be calculated post hoc. Values up to 200 have been recorded for this quotient (Domínguez-Fernandez et al. 2022) and when presented with the mean and range to indicate the kurtosis give a much more easily appreciated indication of person-to-person variation than is provided by mean ± s.d. and especially mean ± s.e.
Recognition of the magnitude of this variation is important because any biological effect observed will be a function of metabolite concentration and it is possible that some individuals might never reach the threshold for benefit and would then require targeted dietary advice or supplementation. When available, the quotient and range are provided in this review. For practical reasons in volunteer studies, blood samples are rarely collected during the 8-to-24-h period post-dosing, and this makes it impossible to calculate an accurate 24-h AUC because such calculations as are made assume a linear decline in concentration during that period. This will almost always produce over-estimates for metabolites entering the circulation from the small intestine but might produce under-estimates for gut microbiota-generated metabolites entering the circulation from the colon if their concentration is still increasing at the penultimate sampling point. The potential for such distortion is well illustrated by data from a study where volunteers consumed an herbal extract and plasma samples were taken at short intervals up to 48 h post-consumption. Mean total quercetin concentration declined ca 70% from 6-h to 10-h post-consumption but only slowly thereafter and the total decline from 6-h to 24-h post consumption was only ca 80%. Assumption of a linear decline from 10 to 24 h would have significantly increased the calculated AUC (Schulz et al. Citation2005). Typically, volunteer studies provide values described as half-lives (T0.5) but because these are obtained after oral dosing they are better described as apparent half-lives because they have been determined while absorption and elimination are both occurring. Apparent half-lives over-estimate the true half-lives and exaggerate the potential for the metabolites to accumulate after repeat dosing, a topic addressed also in section 3.3.1.
3.3.6. Inter-individual variation and temporal variation in quercetin metabolism
Almeida et al. reviewed quercetin bioavailability and paid particular attention to inter-individual variation, concluding that genetic polymorphisms were important determinants of variations in quercetin phase-2 conjugates, but that further work was required to define these relationships more precisely (Almeida et al. Citation2018). Erlund et al. observed that when rutin was consumed females absorbed the released quercetin more efficiently than males and suggested that this was associated with oral contraceptive use, but this phenomenon was not observed when the same volunteers consumed the same doses of quercetin aglycone (Erlund et al. Citation2000) and might therefore be associated with differences in gut microbiota hydrolysis of the rutin.
In assessing the sources of inter-individual variation one factor that has been neglected is the influence of different calibrants distorting the relative yield of individual metabolites as discussed in section 2. However, while important, this is an artifact and not a true inter-individual variation.
As stated above (section 2.2), unless data for each volunteer are provided it is difficult to assess the true magnitude of person-to-person variation, and temporal variation for a given volunteer is rarely studied. In a supplementation study lasting three months, Cialdella-Kam et al. provided plasma data for volunteers in the placebo group who were otherwise following their usual diet. The mean spot plasma concentrations for Q3G, Q3′S, 3′MQ3G (quantified with authentic standards) and QdiG varied little over the three-month period with values of ca 40, 10, 160 and 3 nmol/l, respectively (Cialdella-Kam et al. Citation2013).
Using hepatic S9 preparations from 13 individuals, in total 13 metabolites were quantified but no volunteer produced them all. Only Q7G and Q3′G were produced by all 13 volunteers, 3′MQ3 and Q3G by 12/13, Q3′S, 3′MQ3G and 3′MQ7G by 9/13, 4′MQ and Q7S by 6/13, 4′MQ7G by 3/13, Q4′G and 4′MQ3G by 2/13, plus 3′MQ4′S by S9 from only one individual (van der Woude et al. Citation2004). Except for one individual for whom 4′MQ3G was the only methylated hepatic S9 metabolite, and one individual who produced equal amounts of 3′- and 4′-methylated metabolites, 3′-methylation exceeded 4′-methylation by a considerable margin. For quercetin aglycone the 3′: 4′-methylation ratio was 5: 2 in HepG2 cells (van der Woude et al. Citation2004) and O’Leary et al. reported a similar methylation ratio when Q3G and Q7G were separately incubated with HepG2 (O’Leary et al. Citation2003). Chalet et al. observed that in HT29, 3D intestinal cell culture and human duodenal fluid quercetin-3′-methylated metabolites always exceeded the 4′-methylated (Chalet et al. Citation2019). When 14 volunteers consumed apple products, it was observed that the 3′-: 4′-methylation ratio varied extensively between individuals (0.004 to 6.66, 1665-fold) and for some individuals with time, at least for the methylation of 3′,4′-dihydroxycinnamic acid. Of the 11 volunteers who were tested with the same product on a second occasion, seven volunteers showed only a modest change (±7%) in their 3′-: 4′-methylation ratio, one showed a marked increase in 3′-methylation, two changed from favoring 3′-methylation to favoring 4′-methylation and one changed from favoring 4′-methylation to favoring 3′-methylation (Rubió et al. Citation2021) and presumably similar variation should be expected for quercetin methylation. The reasons for this inter-individual, and especially the temporal, variation are unclear. However, it is interesting to note that luteolin (the flavone analog of quercetin) is preferentially 4′-methylated in vitro by COMT, but in vivo the 3′-methylated metabolite dominates because the 4′-methylated metabolite is preferentially demethylated by CYP1A2 and 3A4/5 (Chen et al. Citation2013). Using human and rat liver microsomes it has been demonstrated that CYP3A4, 2C9 and particularly 1A2 can 4′-demethylate 4′MQ, but 3′MQ was not 3′-demethylated by rat liver microsomes (Nielsen et al. Citation1998; Breinholt et al. Citation2002). Variation in the expression and/or induction of CYP enzymes might contribute to the person-to-person and temporal variations in methylation noted above. Indeed, it has been reported that quercetin aglycone consumption can suppress CYP1A2 demethylation of caffeine (Chen et al. Citation2009).
In unpublished work, we utilized two isogenic onion lines which differed only in their quercetin glycosides content (83.4 mg vs. 3.0 mg/100 g fresh weight), and eight volunteers on separate occasions consumed 368 g of these delivering 320 μmol and 14 μmol, respectively, after cooking. LC–MS analysis of plasma samples after enzymic deconjugation (β-glucuronidase and sulfatase) and a reexamination of these data (see ) showed that the 23-fold molar increase in quercetin glucosides consumed resulted in a disproportionately small 6.4-fold increase (56.6 ± 9.1 and 361 ± 53.8 μmol) in the amount of 3′MQ conjugates (after hydrolysis) in the circulation. After consumption of the low-quercetin white onions, the mean molar ratio [3′MQ: quercetin] was 0.41 ± 0.075 (mean ± s.d.) compared with 0.086 ± 0.015 after quercetin-rich yellow onions (p = 0.0015) suggesting that the capacity of humans to methylate quercetin is low and easily saturated. The absorbed quercetin was present in plasma solely as glucuronide and/or sulfate conjugates of quercetin and 3′MQ: the aglycones quercetin, 3′MQ and 4′MQ were not detected. Data are only shown for the period 30 to 90 min post-consumption because at all other time points for the white onion study quercetin and 3′MQ were below the limit of quantification (30 nmol/l). Day et al. reported a [3′MQ: quercetin] mean molar ratio of 0.27 when volunteers consumed onions delivering 146 μmol quercetin glycosides (Day et al. Citation2001), Jaganath et al. reported a ratio of 0.36 after consumption of 176 μmol quercetin glycosides from tomato juice (Jaganath et al. Citation2006) and Mullen et al. reported 0.1 after consumption of 275 μmol of quercetin glucosides from onion (Mullen, Edwards, and Crozier Citation2006). In view of the comment by O’Leary et al. that in HepG2 methylation and sulfation of quercetin appear to be competing pathways (O’Leary et al. Citation2003), it is interesting to note that the study producing the very low 3′MQ: quercetin ratio produced a high plasma Q3′S (Cmax = 665 ± 201 μmol/l) ( and ) (Mullen, Edwards, and Crozier Citation2006). The other studies in record Q3′S at significantly lower concentrations than Q3G and because sulfation capacity is known to be limited glucuronidation is expected to dominate, especially at high Q-glycoside intakes. Although quantified with authentic standards this very large Q3′S Cmax is therefore unexpected and because Q3G and Q3′S at 10 nmol/l have opposing effects on in vitro angiogenesis (see section 5.2.3 and ) further investigation is desirable.
Figure 3. The apparent influence of quercetin-glycoside burden on the extent of 3′-methylation. The relationship shows a correlation coefficient r2 = 0.8961.
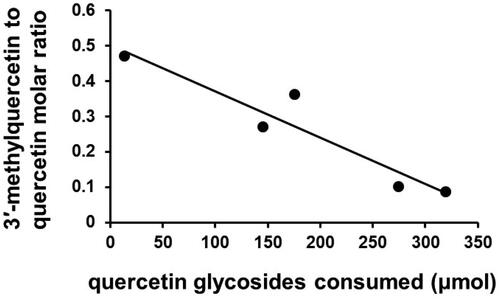
Table 4. The 3′-methyl-quercetin: quercetin molar ratio in hydrolyzed plasma after volunteers consumed high quercetin-glucoside yellow onions and low-quercetin-glucoside white onions.
Table 5. Transport and metabolism of xenobiotic glycosides.
When six volunteers consumed alcoholic cider (1.1 litre) which delivered quercetin glycosides (0.37 mg; 770 nmol), quercetin aglycone (1.2 mg; 4 μmol), 3′MQ aglycone (0.025 mg; 80 nmol) and 4′MQ aglycone (0.005 mg; 16 nmol), quercetin aglycone was below the LOD in hydrolyzed plasma but 3′MQ and 4′MQ detected with a combined Cmax of 0.14 ± 0.19 μmol/l (range: undetectable to 0.44 μmol/l) (DuPont et al. Citation2002) suggesting almost 100% methylation at this very low quercetin intake. This inference is supported by the results of a study where 12 volunteers consumed maté prepared from 4.91 g of leaf which delivered an undefined but small quantity of quercetin glycosides,Footnote3 an unquantifiable trace concentration of MQG was detected in plasma and urine but quercetin aglycone was below the LOQ (Gómez-Juaristi et al. Citation2018) again suggesting near 100% methylation. In a study where volunteers consumed apple sauce enriched with either onions or apple peel, there was significantly higher QS and QSG plasma concentrations in females than males (Lee et al. Citation2012).
3.3.7. Effects of other dietary components on quercetin uptake
Commodities supplying quercetin glycosides contain other (poly)phenols and non-phenolic phytochemicals, and commodities such as onions, tomatoes, apples, tea, unless as part of a volunteer study, are rarely consumed in isolation. Some interactions and possibly modulation of quercetin uptake and/or metabolism can be anticipated with real-world diets. To investigate the effect of isoflavones on quercetin metabolism five volunteers consumed at two-week intervals either a portion of sautéed onions supplying 1 mg/kg quercetin glucosides (3.3 μmol/kg), a portion of tofu supplying 0.66 mg isoflavone glycosides/kg (ca 2.5 μmol/kg), or onions and tofu together. Ninety minutes after consumption of the onion–tofu combination plasma Q3G and an incompletely characterized 3′MQG (presumably 3′MQ3G) were suppressed compared with onion alone, but the concentration of genistein-7-glucuronide was not significantly different from tofu alone. However, daidzein-7-glucuronide, daidzein-4′-glucuronide and genistein-4′-glucuronide concentrations were suppressed by the onion–tofu combination. Genistein-sulfate and daidzein-sulfate concentrations were also suppressed but Q3′S was only detected after consumption of the onion–tofu combination (Nakamura et al. Citation2014), possibly suggesting suppression of the competing methylation pathway by components in the tofu. Investigation of these interactions in vitro in Caco-2 cells demonstrated that incubating genistein with quercetin enhanced the apical to basolateral movement of quercetin without significantly altering the quercetin metabolic profile but suppressed genistein phase-2 conjugation. This suppression was also seen in HepG2 (Nakamura et al. Citation2014).
When fried onions were consumed with carbohydrate-rich cooked sweet potato the plasma concentration of quercetin phase-2 conjugates (measured after deconjugation) was suppressed by ca 90% and ca 60% at 1.5- and 3-h post-consumption, respectively, relative to the consumption of fried onions alone. The slight suppression when fried onions were consumed with lipid-rich cooked pork belly or protein-rich cooked chicken breast was not statistically significant. In vitro investigations using rat β-glucosidase established that the glucose and maltose released during sweet potato digestion suppressed hydrolysis of quercetin-3,4′-diglucoside. There was no effect of glucose or maltose on the hydrolysis of quercetin-3-glucoside or of galactose on the hydrolysis of quercetin-3,4′-diglucoside (Nuka et al. Citation2022). Twelve volunteers participated in an investigation of the effects of quercetin (500 mg; 1.65 mmol) taken daily for 13 days on the metabolism of an oral dose of caffeine (100 mg; 515 μmol). Quercetin reduced the activity of CYP1A2 by ca 10% and increased the activity of CYP2A6 by ca 25% as judged by quantification of caffeine metabolites in 24-h urines (Chen et al. Citation2009). Quercetin metabolites were not reported but quercetin does not require phase 1 activation for clearance. Volunteers (N = 6) consumed test beverages prepared from 100 mg (331 μmol) quercetin with varying amounts of commercial apple pectin (0, 600 mg, 2 g) and it was found that the 24-h excretion of quercetin and its metabolites, after hydrolysis, increased in a dose-dependent manner, approximately doubling at the higher pectin dose. This increase in quercetin excretion was evident after 8 h and was not influenced by the degree of pectin methylation (Nishijima et al. Citation2015). As discussed in section 3.3.1 consuming quercetin aglycone with green tea polyphenols doubled the concentration of EGCG and EGC in prostate tissue but there was no significant effect on the quercetin concentration (Henning et al. Citation2020). Hollman et al. concluded that consuming black tea with semi-skimmed milk (10% addition rate) did not change the mean plasma quercetin concentration (N = 8) determined after acid hydrolysis of phase-2 conjugates (Hollman et al. Citation2001), and Kyle et al. with a similar study reached the same conclusion (Kyle et al. Citation2007).
3.3.8. Absorption and metabolism studies on quercetin supplements
Seven volunteers consumed daily for 28 days four capsules each supplying 250 mg (830 μmol) quercetin aglycone, 50 mg (82 μmol) quercetin-3-rutinoside and 250 mg of undefined bioflavonoids. Total daily intake of quercetin was 3.65 mmol. Their plasma quercetin after hydrolysis increased from 0.10 ± 0.25 μmol/l to 1.5 ± 0.85 μmol/l whereas for the eight volunteers in the control group who received a placebo plasma quercetin after hydrolysis changed from undetectable to 0.07 ± 0.16 μmol/l.
When six volunteers consumed in random order red onion soup delivering 156.3 ± 3.4 µmol quercetin glucosides or a commercial quercetin supplement containing 1.8 ± 0.15 mmol quercetin aglycone it was found that quercetin after hydrolysis of conjugates in 24-h urine was not significantly different, 1.69 ± 0.79 µmol from red onion soup compared with 1.17 ± 0.44 µmol for the quercetin supplement tablet (Shi and Williamson Citation2015). However, this quantity of red onions could not have produced the same duodenal concentration of quercetin aglycone, and this disparity must be considered when assessing the significance of the duodenal concentration reported by Chalet et al. after dosing 500 mg (1.65 mmol) quercetin and implications for effects on duodenal enzymes, receptors and transporters (Chalet et al. Citation2018). When quercetin-enriched cereal bars supplying 430 μmol quercetin (400 μmol quercetin aglycone and 30 μmol quercetin-4′-glucoside) were compared with hard capsules supplying the same quantity of quercetin aglycone the cereal bars delivered a six-fold larger plasma Cmax (2.48 μmol/l vs 0.4 μmol/l after hydrolysis) and a five-fold larger 24-h AUC for quercetin after deconjugation compared with the capsules. The Cmax values for 3′MQ (194 vs 54 μmol/l) and 4′MQ (213 vs 21 μmol/l) were four-fold and nine-fold higher, respectively, after the enriched cereal bars (Egert et al. Citation2012). Interestingly, based on the mean Cmax values, the 3′-: 4′-methylation ratio after the cereal bars was 0.9 whereas it was 2.38 after the capsules.
After giving for three months a daily supplement of quercetin aglycone (500 mg; 1.65 mmol), Vitamin C (125 mg) and niacin (5 mg), quercetin aglycone (1000 mg; 3.3 mmol), Vitamin C (250 mg) and niacin (10 mg), or placebo (37, 32 and 31 volunteers, respectively), it was observed that relative to those on placebo the mean fasting plasma Q3G after one month was ca 4-fold and ca 9-fold larger for the volunteers on low and high doses, ca 300 nmol/l and ca 600 nmol/l, respectively. Mean 3′MQ3G increased similarly achieving ca 600 nmol/l and ca 2.2 μmol/l, respectively after one month. In contrast, mean QdiG only doubled to ca 5 nmol/l (but note quantified using quercetin aglycone), and mean Q3′S increased ca 7-fold to ca 50 nmol/l after 1 month. There was no significant change in these mean values over the next two months suggesting that a steady state had been achieved, but there was a marked increase in the width of the 95% confidence error bars for Q3G and Q3′S suggesting significant inter-volunteer variation. In contrast, on placebo there was no significant change in the mean values or the associated scatter over three months (Cialdella-Kam et al. Citation2013). Fifteen volunteers who were given on separate occasions a quercetin capsule supplying 200 mg (0.66 mmol) or 400 mg (1.32 mmol) had mean plasma Q3G of ca 0.4 μmol/l and ca 1 μmol/l, respectively, after 2 h plus trace amounts of quercetin and 3′MQ aglycones but no other metabolites were reported (Perez et al. Citation2014). Q-3-glucoside as a γ-cyclodextrin inclusion complex which delivered 7.7 μmol quercetin/kg body weight significantly elevated the plasma concentration of quercetin phase-2 metabolites compared with quercetin aglycone in a dextrin matrix as control. Because of the imperfectly matched test sample and control, and because the plasma was hydrolyzed prior to analysis, little can be gleaned from this study (Kapoor et al. Citation2021).
When the distal rhamnose moiety was removed enzymically from quercetin-3-rutinoside (yielding quercetin-3-glucoside), followed by enzymatically attaching up to seven additional glucose moieties to the residual glucose at C3 (α-oligo-glucosylation), the plasma concentration of quercetin metabolites after hydrolysis was increased 1.5 h post-consumption, ca 2.5-fold compared on a molar basis with quercetin-3-glucoside, and ca four-fold compared with quercetin-3,4′-diglucoside. Plasma isorhamnetin concentration increased ca 3-fold relative to quercetin-3-glucoside and ca four-fold relative to quercetin-3,4′-diglucoside. Qualitatively, quercetin-3-glucoside and the α-oligo-glucosyl-quercetin produced the same phase-2 conjugates profile (Murota et al. Citation2010).
When given to 25 volunteers at 6.6 μmol quercetin/kg with breakfast (two pieces of white bread and cheese) flow-mediated dilatation of the brachial artery was significantly improved 1.5 h post consumption and plasma quercetin metabolites after hydrolysis were increased compared with placebo (quercetin 144.9 ± 12.3 nmol/l compared with 12.6 ± 12.3 nmol/l; 3′MQ 245.5 ± 16.5 nmol/l compared with 41.7 ± 16.5 nmol/l) (Bondonno et al. Citation2020). The 3′MQ: quercetin mean molar ratios of 1.69 and 3.30 are unexpectedly high for volunteers with a mean body weight of 77.6 ± 14.9 kg corresponding to a mean intake of 512 μmol quercetin—see .
Chalet et al. reported that in vivo quercetin was poorly soluble in human duodenal fluid and to improve its solubility it has been formulated with food grade lecithin as film-coated tablets. This increased its solubility ca 10-fold from 0.25 mmol/l to 2.77 mmol/l and from 0.63 mmol/l to 7.2 mmol/l, respectively, in simulated fasted (pH 6.5) and fed (pH 5) duodenal fluids, but all values considerably higher than recorded in duodenal fluid in vivo (31 μmol/l) 90 min after volunteers consumed 500 mg (1.65 mmol) quercetin (Chalet et al. Citation2018). The performance of the lecithin-coated tablets was compared by giving 12 volunteers 500 mg (1.65 mmol) unmodified quercetin and the film-coated tablets at two doses, 500 mg (1.65 mmol) and 250 mg (0.83 mmol) quercetin. The 24-h AUC and Cmax values were 0.263 ± 0.066, 5.31 ± 0.51 and 2.78 ± 0.35 μmol.h/l and 36.2 ± 7.3, 738.7 ± 54.0 and 418.4 ± 49.0 μmol/l, respectively (Riva et al. Citation2019).
Ten volunteers received a herbal preparation delivering 500 mg quercetin three times daily but whether this was aglycone or glycosides was not defined. Plasma and urine were analyzed for quercetin aglycone with and without hydrolysis, but methylated aglycones were not reported, and the nature of the conjugates was not investigated. Median Cmax quercetin aglycone was 47.7 nmol/l (quotient 80) whereas the quercetin conjugates median Cmax was 1.1 μmol/l (quotient 7.5) (Moon et al. Citation2008).
3.3.9. Critical discussion of the evidence for absorption of intact quercetin-glycosides
As discussed in section 3.3.3, two studies in which volunteers consumed cranberry products produced disparate results regarding the absorption of intact flavonol glycosides, and this remains a controversial issue because glucuronides might have been incorrectly assigned as glycosides when authentic glucuronide standards were not available. Note, however, that it has been well-established that α- and β-galactosides and α- and β-glucosides of both 4-nitrophenol and 1- and 2-naphthol are transported by the everted rat intestine but the extent to which the glycoside is transferred to the serosal side, the extent of hydrolysis to the aglycone, and the extent of glucuronidation varies with the sugar—see (Mizuma et al. Citation1993; Mizuma, Ohta, and Awazu Citation1994). Flavonol-glycosides and flavonol-glucuronides can be distinguished with electrochemical detectors (glucuronide at 250 V, glucosides only above 400 V, Sesink, O’Leary, and Hollman Citation2001) but are not distinguishable by their UV–vis spectra. Glucuronides elute earlier than glucosides, but there is some overlap of late-eluting glucuronide regio-isomers and early-eluting glucoside regio-isomers (Sesink, O’Leary, and Hollman Citation2001; Mullen et al. Citation2004; Mullen, Edwards, and Crozier Citation2006), with further complications when conjugates with other hexose sugars are also present.
Table 6. The occurrence of flavonol glycosides in human plasma and urine.
Moon et al. (Citation2000) reported that flavonol glycosides could not be detected in plasma after volunteers consumed for one week onions delivering daily 225–310 μmol quercetin glycosides. Sesink et al. gave volunteers on separate occasions 325 μmol of Q-3-glucoside or Q-4′-glucoside and failed to detect any glycosides in plasma (Sesink, O’Leary, and Hollman Citation2001). Both studies used LC with electrochemical detection. However, when glycosides known to be present in the test meal/beverage have been identified in plasma or urine by the more sensitive LC–MS/MS and the use of authentic standards, mis-identification seems less likely, and the limited data available are summarized in . Note the inconsistency in glycosides reported in plasma/urine even for the same foodstuff consumed. Three Q-glucoside-glucuronides and two Q-glucoside-sulfates have been detected (LC–MS/MS) in human urine but not plasma (Hong and Mitchell Citation2004; Mullen et al. Citation2004; Mullen, Edwards, and Crozier Citation2006). These conjugates have not been characterized at regio-isomer level, although it is clear from MS fragmentation that the sulfate is attached directly to the quercetin. After volunteers consumed onions delivering 275 μmol quercetin glycosides one Q-glucoside-glucuronide (163 ± 23 nmol/24 h) and two Q-glucoside-sulfates (392 ± 60 and 821 ± 156 nmol/24 h) were quantified in urine as Q-4′-glucoside equivalents (Mullen et al. Citation2004; Mullen, Edwards, and Crozier Citation2006). The detection in plasma of a single volunteer of 3′MQ-3-glucoside when it was not detected in the onions consumed is suggestive of post-absorption COMT 3′-methylation of Q-3-glucoside (Boyle et al. Citation2000; Mullen et al. Citation2004; Mullen, Edwards, and Crozier Citation2006). That such methylation of a flavonoid glycoside can occur is confirmed by the detection of labeled peonidin-3-glucoside in human urine after volunteers were dosed with 6,8,10,3′,5′-13C5-cyanidin-3-glucoside (de Ferrars et al. Citation2014). Note that anthocyanin glycosides (arabinosides, glucosides and galactosides) have been reported in human plasma and urine by several research groups using LC–MS (Ohnishi et al. Citation2006; Wiczkowski, Romaszko, and Piskula Citation2010; de Ferrars et al. Citation2014; Yuste et al. Citation2019; Macià et al. Citation2022). Further support for the idiosyncratic human absorption of flavonoid glycosides is provided by the LC–MS/MS quantification of phloretin-xylosyl-glucoside in human urine (4–20 nmol/24 h) from 10 out of 29 volunteers who consumed an apple snack (Macià et al. Citation2023). There is also considerable inter-person variation in the occurrence of these Q-glycosides in plasma and urine (Mullen et al. Citation2004; Simonetti et al. Citation2005; Mullen, Edwards, and Crozier Citation2006). For example, Q-3-glucoside (trace levels, 1 of 6 volunteers), Q-4′-glucoside (Cmax 90 ± 20 nmol/l; Tmax ca 1.3 h), 3′-MQ-4′-glucoside (Cmax 750 ± 180 nmol/l; Tmax ca 1.8 h), Q-3,4′-diglucoside (trace levels, 1 of 6 volunteers) and Q-3-rutinoside (80–300 nmol/l for 8 of 12 volunteers) whereas the QG were produced by all six volunteers. Boyle et al. reported Q-3-glucoside in the plasma of all six volunteers but for three the Tmax was 4 h compared with 8 h for the remainder. The mean Cmax values for 3′MQ-4′-glucoside and Q-3-glucoside were ca 60 nmol/l and ca 110 nmol/l, respectively (Boyle et al. Citation2000). Quercetin-3-rutinoside has been detected in LDL-cholesterol (0.093 nmol/mg LDL-protein) (Lamuela-Raventós et al. Citation1999).
Table 7. Effects of quercetin conjugates on leukocytes and related cells.
To reach the plasma, Q-glycosides must access the enterocyte via the apically-located sodium-glucose cotransporter (SGLT1) and/or the apically-located facilitative transporter GLUT2 (SLC2A2), evade the attention of the apically expressed lactase phloridzin hydrolase (LPH) (EC 3.1.7.4) and multidrug resistance protein (MRP2) plus the broad specificity cytosolic-β-glucosidase (CBG) (EC 3.2.1.21), finally exiting to the serum via basally-located GLUT2.
LPH hydrolyzes Q-4′-glucoside, Q-3-glucoside, Q-3,4′-diglucoside and Q-3-galactoside but not Q-3-rutinoside, Q-3-arabinoside, Q-3-xyloside and Q-3-rhamnoside (Németh et al. Citation2003). Some studies have concluded that SGLT1 can transport Q-4′-glucoside (Walgren, Lin, et al. Citation2000) and Q-3-glucoside (Day et al. Citation2003), and because xylose and galactose are also transported by SGLT1 (Elferink et al. Citation2020), it is plausible that Q-3-galactoside and Q-3-xyloside might similarly interact. Interaction of quercetin glucosides and galactosides, particularly those at 4′, with human SGLT1 expressed in Xenopus oocytes has been demonstrated (Kottra and Daniel Citation2007). MRP2 can export Q-4′-glucoside (Walgren, Karnaky, et al. Citation2000; Walgren, Lin, et al. Citation2000) but Q-3-glucoside and Q-3-rutinoside are not substrates (Fang et al. Citation2019) in vitro. Studies with flavonoid aglycones indicate that compounds with 3′-OCH3, 4′-OH and 5-OH are unfavorable for substrate-binding (Fang et al. Citation2019) suggesting that isorhamnetin-glycosides and quercetin-3-glycosides would not be efficiently exported to the gut lumen, whereas masking of the 4′-hydroxyl in Q-4′-glucoside presumably allows at least partial export. CBG has a broad substrate specificity, hydrolyzing β-d-glucopyranosides, β-d-galactopyranosides, β-d-fucopyranosides, β-d-xylopyranosides plus α-l-arabinopyranosides, and tolerates substitution of flavonols at C-4′ and C-7, but importantly not at C-3 (Elferink et al. Citation2020).
GLUT2, which accepts glucose and galactose, is found on both the apical and basal membranes of the enterocyte and is trafficked to meet the demand for glucose (Manolescu et al. Citation2007; Kellett et al. Citation2008). GLUT2 can transport Q-3-glucoside in vitro (Li et al. Citation2020) and might therefore transport Q-3-galactoside and Q-3-xyloside. Combining these data, it is clear that LPH should hydrolyze many of the Q-glycosides that apparently are sometimes appearing in human plasma and urine, but Day et al. demonstrated that in vitro a trace amount of Q-3-glucoside was transported by SGLT1 when LPH activity was suppressed (Day et al. Citation2003). Congenital lactase deficiency is known although rare in southern Europe, but lactase non-persistence is more common, recorded as 19–37% of adults in northern, southern and western Europe (Storhaug, Fosse, and Fadnes Citation2017), and might therefor be a crucial factor influencing the absorption of intact glycosides which interact with LPH. Németh et al. (Citation2003) investigated the ability of protein extracts prepared from human jejunal mucosa (N = 10) to hydrolyze flavonoid glycosides and reported substantial variability, 68-fold for quercetin-3-glucoside, 83-fold for phloretin-2′-glucoside and 87-fold for quercetin-4′-glucoside.
It has also been reported that gut mucosal morphology and function varies extensively with ethnicity and impacts upon the ability to absorb sugars including rhamnose and xylose (Menzies et al. Citation1999), and this factor may also be important in explaining the inter-individual variation.
Although further critical investigation is required, we suggest that when LPH activity is absent or impaired those Q-glycosides which interact with SGLT1 and/or GLUT2 but which are not substrates for CBG and MRP2 may enter the circulation intact, especially at the high fluxes to be expected during volunteer studies. The mechanism(s) by which other Q-glycosides enter the circulation is uncertain.
4. Tissue uptake and intracellular metabolism
4.1. Cellular transport
Caco-2 cells and Caco-2/TC7 cocultures absorb quercetin aglycone by passive diffusion, but Chabane et al. also reported Caco-2 uptake by a pH-dependent mechanism mediated by the organic anion transporting protein B (OATPB). Uptake was greater when the apical compartment was set at pH 6.5 to model the gut lumen rather than pH 7.4 (Barrington et al. Citation2009; Chabane et al. Citation2009). Barrington et al. reported that intracellular QG were preferentially effluxed to the basolateral compartment (modeling the hepatic portal vein) whereas intracellular QS were preferentially effluxed to the apical compartment (modeling the gut lumen), but QSG like QG passed to the basolateral compartment. Once effluxed these conjugates cannot reenter the Caco-2 cells without deconjugation by the gut microbiota (Barrington et al. Citation2009). For further intracellular metabolism to occur quercetin phase-2 conjugates must transfer from the plasma to other tissues, and for excretion to occur they must transfer to the kidney proximal tubule or bile duct in the liver. Human embryonic kidney 293H cells overexpressing OAT1 exhibited an increased uptake of Q3′S whereas OAT3-overexpressing cells demonstrated enhanced uptake of Q3′G, but Q3G and Q7G were less efficiently transported. These conjugates were competitive inhibitors—Q3′S IC50 = 1.2 mmol/l for 4-aminohippuric acid transport by OAT1. For 5-carboxyfluorescein transport by OAT3 the IC50 values for Q3G, Q3′G and Q3′S were 0.43, 1.31 and 0.75 μmol/l, respectively (Wong et al. Citation2011): Q3′S was a more potent inhibitor of OATP1B1 in the liver (0.3 μmol/l) and OATP2B1 on the luminal surface of the enterocyte (0.4 μmol/l) (Nigam et al. Citation2015; Mohos et al. Citation2020).
In HepG2 cells Q3′S uptake utilized organic anion transporter protein OATP4C1 whereas HEK293 cells used OATP4C1 and OAT4. In contrast, Q3G was taken up primarily by passive diffusion (Wong et al. Citation2012). HepG2 also takes up Q7G (O’Leary et al. Citation2003) but dermal fibroblasts do not (Spencer et al. Citation2003). O’Leary et al. (Citation2003) reported that 3′MQ7G, 4′MQ7G, and Q3S were not efflux substrates for P-gp in HepG2 cells.
In vitro cell culture has also shown that Q3G can enter RAW264 macrophage-like cells, J774-1 sarcoma cells, d-THP-1 monocytic leukemia cells, MG6 microglial cells, and RBEC-1 brain capillary endothelial cells with the formation of quercetin aglycone and 3′/4′MQ. HepG2 transform Q3G and Q7G to Q3′S and possibly Q4′G (O’Leary et al. Citation2003) and RBEC-1 brain capillary endothelial cells also produced one prominent but uncharacterized metabolite, and MG6 microglial cells produced at least four uncharacterized metabolites thought to include QS/QSG and/or QG (Ishisaka et al. Citation2013, Citation2014).
Q3G was able to enter BAEC (bovine aorta endothelium cells) but there was neither hydrolysis by β-glucuronidase nor methylation by COMT. However, it was not possible to detect any uptake by HUVEC (human umbilical endothelium cells). Incubation of Q3G with RAW264 induced β-glucuronidase activity (Ishisaka et al. Citation2013). Bartholmé et al. demonstrated that lysosomal β-glucuronidase from human neutrophils was able to hydrolyze Q3G, Q3′G, 3′MQ3G, Q4′G and Q7G in vitro at pH 5.5. or lower. Of these, Q3G had the lowest Km (33 μmol/l) (Bartholomé et al. Citation2010) and was most effective at inhibiting the RANKL-dependent activation of tartrate-resistant acid phosphatase and LPS-dependent induction of IL-6. Q7G, the least stable at neutral pH, was the most toxic in activated macrophages (Nishikawa et al. Citation2022). It has been reported that in inflamed tissues the pH would be lowered by lactate arising from mitochondrial dysfunction thus facilitating β-glucuronidase hydrolysis (Ishisaka et al. Citation2013). Note that O’Leary et al. using recombinant human β-glucuronidase reported that Q4′G had the lowest Km (48 μmol/l) and Q3G was 167 μmol/l assayed at pH 7.2 (O’Leary et al. Citation2001) illustrating the pH effect reported by Bartholmé et al.
4.2. Glutathione conjugates
Susceptibility of QG to intracellular β-glucuronidase and the conversion of QG to QS implies at least transient intracellular exposure to quercetin aglycone. Quercetin aglycone is chemically reactive, especially at near neutral pH values as found in plasma and often in human tissues, and such pH values are routinely used for cell culture media and associated in vitro investigations. In tissues expressing tyrosinase (EC 1.14.18.1) or peroxidase (EC 1.11.1.7), such as dermal fibroblasts and melanoma cell lines, quercetin and 3′MQ aglycones will form a reactive ortho-quinone or para-quinone-methide. Above pH 7 such quinones could form spontaneously and formation has been observed in tissues lacking these enzymes, for example Caco-2 and HepG2 (van der Woude et al. Citation2005). 4′MQ cannot form an ortho-quinone or para-quinone-methide, but 3′MQ can (Spencer et al. Citation2003).
Such quinones and quinone-methides react readily with –SH and –NH2 nucleophiles such as glutathione and the glutathione conjugates are effluxed to the culture medium by MRP1 (ABCC1) a process sometimes described as phase-3 metabolism (Awad et al. Citation2002; Spencer et al. Citation2003; Omar et al. Citation2014; Li et al. Citation2016). Incubation of human aortic endothelial cells (HAEC) with quercetin caused a decline in intracellular GSSG sufficient to increase the GSH: GSSG ratio, upregulated MRP1 (ABCC1) and increased mRNA and protein concentration of the glutamate-cysteine ligase enzyme (EC 6.3.3.2) which performs the first step in GSH synthesis. These changes collectively were described as maximizing protection against oxidative damage (Li et al. Citation2016).
In the absence of glutathione the quinones may react with proteins, for example quercetin-quinone methide has been reported to inhibit glutathione-S-transferase (EC 2.5.1.18) in vitro by haptenization at cysteine 47 (van Zanden et al. Citation2003), and in vitro incubations of [14C]-quercetin with HepG2 and Caco-2 cells have produced labeled DNA adducts plus at least 10 labeled proteins with those at 55, 58 and 80 kDa being most prominent. These proteins were not identified but did not correspond to the major proteins observed with Coomassie blue staining suggesting that certain quantitatively minor proteins had been preferentially modified (Walle, Vincent, and Walle Citation2003). Such haptenization may have toxic sequelae (Dietz and Bolton Citation2011; Bolton Citation2014), but the transient nature of the protein and particularly the DNA adducts suggests that the mutagenicity observed in vitro might not occur in vivo (van der Woude et al. Citation2005).
A quercetin-glutathione conjugate has been tentatively identified by negative ion LC–MS/MS in plasma after volunteers consumed apple sauce enriched with apple peel or onion but was recorded after a 2-day washout, at a nearly constant 15 nmol/l (as quercetin-4′-glucoside equivalents) (Lee et al. Citation2012). The authors comment that this putative glutathione conjugate could not be detected in positive ion MS, surprising, because positive ion MS has been favored in studies reporting these conjugates, as discussed below. That plus the presence of an unexpected and unassigned fragment ion at m/z 173.0063 casts doubt on the tentative assignment. In vitro studies using human dermal fibroblasts, glial cells and murine hepatic suspensions have yielded 2′-, 6- and 8-glutathionyl-quercetin confirmed with authentic standards () plus two isomers of mono-glutathionyl-quercetin glucuronide, and three isomers of glutathionyl-methyl-quercetin (Spencer et al. Citation2003; Hong and Mitchell Citation2006; Vafeiadou et al. Citation2008). The potential significance of such haptenization is further discussed in section 5.2.6.
Figure 4. Structure of quercetin-glutathione conjugates.
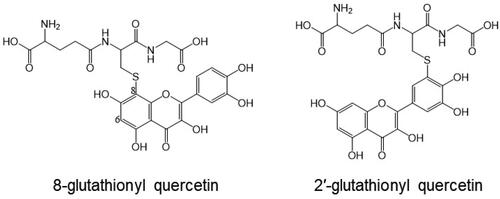
After volunteers consumed 200 g cooked onion supplying ca 250 μmol quercetin glycosides 24-h urines contained single mercapturic acid conjugates of 3-(3′,4′-dihydroxyphenyl)propanoic acid, 3,4-dihydroxybenzaldehyde and 1,2-dihydroxy-4-methylbenzene, plus two isomeric conjugates of 3′,4′-dihydroxyphenylacetic acid and three isomeric conjugates of 3′,4′-dihydroxycinnamic acid (Hong and Mitchell Citation2006). It was assumed that the low mass phenols were gut microbiota catabolites of quercetin which were conjugated with glutathione after absorption and the glutathione moiety hydrolyzed to yield the mercapturic acid.
5. Potential for biological effects
5.1. Concentrations and forms of quercetin conjugates in the blood after consumption of food
To exert a biological effect, a compound must reach the site of action in a form that is active and at a suitable concentration maintained for a sufficient period. Although individual metabolites differ significantly in their potency, those with the greatest potential for exerting a significant systemic biological effect are usually those present in plasma at the highest concentration for the greatest period after a single bolus dose, especially if they can be produced by multiple dietary components including those consumed at frequent short intervals.
and summarizes in bold the data where authentic calibrants have been used for at least some of the metabolites reported in plasma and urine. Data for other metabolites quantified in the same study using alternative calibrants have been included in plain text with a footnote defining the calibrant used. These limited data suggest that Q3G, 3’MQ3G and Q3′S will be the major plasma metabolites but with considerable inter-individual variation (not less than ca 10-fold for Q3G and 3’MQ3G) and markedly influenced by the diet as indicated by the different results obtained with tomato juice, onions, and a mixed polyphenol drink. This inter-individual variation is particularly well-illustrated by Jaganath et al. where the plasma profile is presented for each of six volunteers (Jaganath et al. Citation2006). The concentrations achieved, and the minimal impact of repeat doses even when consuming supplements supplying over 3 mmol quercetin (see section 3.3.7), suggests that normal diets will rarely produce quercetin phase-2 conjugates with Cmax values above 1 μmol/l even when onions are a significant contributor. Onions are rarely consumed at the dose used in the reported studies and it would be very unusual for onions to be consumed at regular short intervals during the day. This inferred maximum plasma concentration is borne out by data from 17 volunteers who at baseline had maximally ca 100 nmol/l Q3G (Perez et al. Citation2014) and 37 free-living volunteers following their normal but undefined diet when mean spot plasma concentrations for Q3G, 3’MQ3G and Q3′S quantified with authentic standards were ca 40, 160 and 10 nmol/l, respectively (Cialdella-Kam et al. Citation2013). Inter-individual variation is substantial for Q3G and 3’MQ3G in urine with quotients 44 and 62, respectively and exceeding 500 for Q3′G and Q4′G after volunteers consumed tomato juice ().
Because Cmax is transient, for any effect demonstrated in vitro to have real potential for a sustained in vivo effect it must be achieved in vitro at concentrations no higher than the Cmax, although translating from in vitro to in vivo is very difficult, especially when the effects are manifest by repeat consumption over a very long period. The effect of repeat consumption of beverages at short intervals has not been systematically investigated but modeling suggests that few metabolites will exceed 1 μmol/l. In contrast in vitro studies rarely even use concentrations below 500 nmol/l ( and ). As discussed previously, a significant limitation to detecting effects at low concentrations of test substance is the relatively poor sensitivity and replicate precision of the test system—often the s.d. may be 20% of the mean value even for standards and control samples, and much larger for treated samples, making small treatment-associated changes impossible to detect (Williamson and Clifford Citation2017). Improvements to the replicate precision of clinically relevant test systems could be beneficial. The data from Chalet et al. suggest that there is greater potential for effects to be produced in the GIT where greater concentrations might be expected on ordinary diets and certainly after supplement consumption.
Table 8. Effects of quercetin conjugates on endothelial cells.
Table 9. Effects of quercetin conjugates on other cell types.
5.2. Investigation in vivo of effects demonstrated in vitro
5.2.1. General comments on the design of experiments
In order to examine biological and health effects of metabolites and conjugates, primary or immortalized cells are mostly used. Kerimi et al. have reviewed the limitations associated with the use of cultured tumor cells when the objective is an extrapolation to healthy primary cells and real-world effects in vivo (Kerimi and Williamson Citation2018). There are an enormous number of papers on the effects of quercetin on cells in vitro, since quercetin is relatively cheap and readily available. However, studies using the high concentrations of aglycone do not mimic the normal situation in vivo, where cells are exposed to a range of metabolites, the profile varying with tissue. There are a growing number of studies which have examined the effects of metabolites and conjugates on cells. We first reported these types of study in reviews published in 2004 (Kroon et al. Citation2004) and 2005 (Williamson et al. Citation2005). Here we have mostly included papers published since that date. The papers on quercetin conjugates and macrophages, endothelial cells and other cells are summarized in .
Because of complex design and low throughput such in vitro experiments are not well suited for rapid screening of novel activities. A dose-response is required—it should commence at realistic concentrations at or below those proven to occur in vivo, but the study should aim to identify mechanism(s) once an effect has been demonstrated rather than merely increasing the concentration until an effect is observed. Physiologically an assay that requires more than 10 μmol/l in vitro for an effect to be observed will almost certainly not produce that effect in a human study in vivo with the exception of interactions in the gut, where millimolar luminal concentrations of some polyphenols may occur and quercetin glycosides could reach 10–100 μmol/l (Williamson Citation2013).
In vivo several conjugates of quercetin are present simultaneously in plasma postprandially, but most in vitro studies report on the activity of one conjugate and not a mixture, and studies using (poly)phenols in combination with other classes of phytochemical are even rarer, but once mechanism(s) are identified potentially synergistic and antagonistic combinations can be identified and tested.
Typically, for example, a demonstrated effect in vivo on endothelial function by a quercetin-rich food or supplement, would be complemented by determining the mechanism using conjugates on endothelial cells.
5.2.2. Macrophages
summarizes the results of 12 investigations using quercetin phase-2 conjugates with macrophages—no study tested the metabolites at 100 nmol/l but Q3G was shown to produce statistically significant effects at 200 nmol/l in one study (Li et al. Citation2017). Macrophages are white blood cells that play a role in stimulating the action of other immune cells in addition to bactericidal activities. They have been used as a model for testing the action of many bioactives including quercetin since they are readily obtainable from blood and as immortalized cell lines such as murine RAW264.7 cells and human U937 cells. Some of the effects of quercetin conjugates on macrophages are summarized in . Most papers have used murine macrophages, with limited work on human cells, and most papers have used lipopolysaccharide (LPS) as a stress. This is a potent pro-inflammatory agent, and one of the primary mechanisms of action is through NF-kB. Inhibition of LPS-induced inflammatory action and cytokine release indicates a protective effect, at least partly through inhibition of NF-kB activation. Quercetin as an aglycone has been shown in several reports to protect against LPS-induced cytokine release in cells. For example, quercetin at 30 μmol/l inhibited LPS-mediated activation of macrophage U937 cells and attenuated tumor necrosis factor-α (TNF-α), interleukin 6 (IL-6), and interleukin 1 (IL-1) production (Okoko and Oruambo Citation2009). Similar effects have been seen in numerous papers (Si et al. Citation2016; Cui et al. Citation2019; Tang et al. Citation2019; Tsai et al. Citation2021). Under some circumstances, the quercetin conjugate Q3G could also protect against the action of LPS. Q3G (10 μmol/l) was the most effective in suppressing IL6 expression in RAW264.7 cells, and while Q3′G and Q4′G would contribute more modestly at this concentration, Q7G would not (Nishikawa et al. Citation2022). Treatment of M2a macrophages in vitro with Q3G at 0.5 μmol/l down-regulated pro-inflammatory genes (Derlindati et al. Citation2012) providing evidence for the anti-atherogenic potential of Q3G at concentrations seen in plasma after supplementation and approached after volunteers consumed a large portion of quercetin-glucoside-rich onions. Kawai et al. using a monoclonal antibody specific for Q3G could not detect it in healthy aorta but found it in human atherosclerotic foam cells where it was associated primarily with macrophages (Kawai, Nishikawa, et al. Citation2008), and as discussed above uptake by macrophage-like cells has been confirmed in vitro. Although quercetin aglycone at 1 μmol/l increased PON2 mRNA and protein content in murine RAW264.7 macrophages, Q3G had no effect. Similarly, when 42 at-risk volunteers were given quercetin (150 mg/day; 497 μmol/day) for 42 days there was no change in PON2 mRNA in monocytes in vivo (Boesch-Saadatmandi et al. Citation2009, Citation2011).
5.2.3. Endothelium
summarizes the results of 16 in vitro studies one of which tested metabolites at 100 nmol/l and one at 10 nmol/l—both produced statistically significant effects. A study using rabbit coronary venular endothelial cells challenged with vascular endothelial growth factor (VEGF) to promote angiogenesis, a process which is desirable for tissue repair following injury, but highly undesirable when it occurs in tumors where often it is upregulated. Q3G (10 nmol/l) reduced angiogenesis but Q3′S (10 nmol/l) induced angiogenesis. It has been reported that Q aglycone at 10 μmol/l can inhibit VEGF-stimulated angiogenesis in HUVECs (Pratheeshkumar et al. Citation2012), but deglucuronidation is unlikely to explain the behavior of Q3G in rabbit tissue. Q3G and Q3′S at similar concentrations can be expected simultaneously at least transiently in the plasma of individuals following their routine unsupplemented diet but their effects on angiogenesis in vivo are unknown.
The endothelial cells make up the lining of the blood vessels, acting to separate the underlying smooth muscle from the blood, and transmit signals that control blood pressure, dilation, metabolic status as well as transport nutrients and signaling molecules. The endothelium is directly exposed to circulating quercetin conjugates in the blood, and model systems in vitro have been used to examine this interaction. An apparently small effect on the endothelium can translate to a large effect in vivo. The most used cellular model is HUVEC cells, but other cells have been used and summarizes the data reported for their interaction with quercetin conjugates. In addition, some laboratories have used rat aortic thoracic rings as a model for the endothelium, which has the advantage of retaining the underlying smooth muscle cells. Cells are often stimulated with a stressor, such as TNF-α, thromboxane, palmitate, glucose or oxidative agents, and the protective effects of quercetin conjugates measured.
A mixture of QG and QS (100 nmol/l), predominantly QS, suppressed in HUVECs the stress induced by high glucose concentrations (Chao et al. Citation2009). In the absence of a stressor, quercetin treatment of HUVECs induced HO-1 mRNA expression, whereas treatment with the conjugates Q3G and Q3’S led to a small decrease in HO-1 expression (Tumova, Kerimi, and Williamson Citation2019). Since HO-1 is a response to stress through induction of nrf2, then we can conclude that quercetin induces this stress, but the conjugates may even be protective. However, although induction through nrf2 is a stress, it results in a protective hermetic response of the cell. These data highlight the difference in response of cells to the aglycones and to the conjugates. Quercetin and Q3G protected against palmitate-induced oxidative stress in HUVECs (Guo et al. Citation2013). Q3G in vitro had no effect on human umbilical artery relaxation at 10 μmol/l but quercetin and 3′MQ were active at 100 nmol/l suggesting that the effects seen in vivo (Perez et al. Citation2014) were probably a consequence of Q3G and/or 3’MQ3G deglucuronidation. Q3G at 10 μmol/l produced a 35% reduction in the Ca2+-flux produced when neutrophils were challenged with N-formyl-methionyl-leucyl-phenylalanine but Q3′S and quercetin aglycone were inactive (Suri et al. Citation2008) and it is doubtful that exposure in vivo will be sufficient to produce a significant effect. In contrast to 3ʹMQ and 4ʹMQ aglycones, Q3G and Q3′S did not inhibit TNFα-mediated inflammatory responses in HAEC, even when tested at supra-physiological concentrations, 100 and 30 μmol/l, respectively (Lotito et al. Citation2011). However, Esperester and Ness have obtained a patent covering the intra-arterial application of quercetin and kaempferol glucuronides at 100 μmol/l, particularly Q3G and K3G, to protect organs for transplant (hearts, lungs, kidneys, etc) from inflammatory reactions associated with the operative procedure (Esperester and Nees Citation2014), but whether this treatment has ever been exploited is not known—sourcing the glucuronides would be a serious practical constraint.
5.2.4. Other cell types
summarizes the results of 16 studies, seven of which tested metabolites at 100 nmol/l, five producing statistically significant effects at that concentration. Three studies used human breast cancer cell lines (MCF-7 and MDA-MB-231) of which two recorded beneficial effects with Q3G (Yamazaki, Miyoshi, et al. Citation2014; Yamazaki, Sakakibara, et al. Citation2014) and the third with Q (Jiang, Dai, and Chen Citation2019) included because the aglycone upregulated SULT1E1 thus suggesting an ability to protect through estradiol inactivation as discussed in section 5.2.6. Significant effects were also observed at 100 nmol/l in studies using primary neuron cultures (Q3G) and lymphocytes (Q3G and 3’MQ3G) (Kawai 2014) . Q3G has been detected immunologically in human brain and deglucuronidation has been observed in vitro in brain capillary endothelial RBEC1 cells (Ishisaka et al. Citation2013, Citation2014). In contrast to effects observed in lymphocytes in vitro, when volunteers consumed a portion of high quercetin onions, there was no effect on expression of mRNA in lymphocytes harvested 3 or 6-h post consumption with plasma Q3G and 3’MQ3G reaching maximal concentrations of only 15 nmol/l and 4 nmol/l, respectively (de-Pascual-Teresa et al. Citation2004). Total quercetin after hydrolysis rarely reaches 150 nmol/l (see section 3.3.4) and whether the efficacy seen in vitro can realistically be expected in vivo is a major question in the field.
5.2.5. Inhibition of enzyme activities by quercetin conjugates
Quercetin conjugates have been shown to inhibit some enzymes. Xanthine oxidase (EC 1.1.3.22) is an enzyme that generates ROS (Fridovich Citation1970) and known to be inhibited by flavonoids since 1951 (Beiler and Martin Citation1951). Quercetin inhibits xanthine oxidase activity in vitro (Nagao, Seki, and Kobayashi Citation1999; Lin et al. Citation2002) and the X-ray crystal structure shows that quercetin binds to the active site, including Arg880 and Glu802, with part of the quercetin structure pointing toward the essential molybdenum atom (Cao, Pauff, and Hille Citation2014). In hyperuricemic men, quercetin consumption for one month lowered plasma uric acid, a product of xanthine oxidase and this was ascribed to the ability of some quercetin conjugates to inhibit xanthine oxidase (Shi and Williamson Citation2016). For quercetin glucuronides, the efficacy of inhibition was 4′->3′->7->3 (Day et al. Citation2000), with very strong inhibition by Q3’S (Shi and Williamson Citation2016), a dominant plasma metabolite (Day et al. Citation2001). Q3′S was also a potent inhibitor of human lipoxygenase activity with IC50 of 7 μmol/l, whereas Q3G was inactive (Loke, Proudfoot, Stewart, et al. Citation2008). Q3′S and Q3G at a concentration of 1 μmol/l attenuated peroxynitrite-induced nitro-tyrosine formation in human serum albumin in vitro (Yokoyama et al. Citation2009). In a cell-free system, neither quercetin nor Q3G interacted with PPAR-γ, although quercetin aglycone demonstrated some synergy with rosiglitazone action on PPAR-γ (Beekmann et al. Citation2015).
Reverse cholesterol transport removes excess cholesterol from macrophages via the ATP-binding cassette A1 transporter (ABCA1), which produces high density lipoprotein-cholesterol (HDLC) and is transcriptionally regulated by the nuclear liver X receptor α (LXRα). Q3G enhanced ABCA1 mRNA in vitro in macrophages via interaction with LXRα (Ohara et al. Citation2013). COX-2 (prostaglandin-endoperoxide synthase EC 1.14.99.1) is an enzyme which metabolizes arachidonic acid producing prostaglandins such as prostacyclin and prostanoids such as thromboxane and inhibition can alleviate inflammation and pain. Quercetin and Q3′S were inhibitory in vitro at 100 nmol/l, but Q3G and 3′MQ3G were stimulatory at the same concentration, and the situation in vivo is uncertain (Kawai 2014). The inhibition of digestive enzymes by quercetin aglycone is discussed in section 3.3.1.
5.2.6. Alternative mechanisms of action: the role of endogenous β-glucuronidase and aryl-sulfatases in the activation of quercetin conjugates
With a few exceptions, quercetin aglycone is more biologically active than its phase-2 conjugates. However, it has been suggested that the conjugates can be re-activated back to the aglycone by endogenous cellular deconjugating enzymes. This has even been called the “flavonoid paradox” (Menendez et al. Citation2011) to explain why polyphenols have a substantial biological effect in many in vivo studies but the conjugates do not appear to be sufficiently active to produce the observed effects. Most studies (see section 4.1) examining this deconjugation have focused on β-glucuronidase, which may be induced by Q3G at least in RAW264 macrophages in vitro (Ishisaka et al. Citation2013). Purified human recombinant β-glucuronidase was shown in 2001 to be active on many polyphenol glucuronides, including Q3G, Q4′G and Q7G (O’Leary et al. Citation2001), and in 2003, it was shown that Q3G and Q7G could be deglucuronidated in cells and converted to other conjugates such as Q3’S via the more biologically active aglycone (O’Leary et al. Citation2003). Subsequently it has been shown that human recombinant β-glucuronidase can also hydrolyze Q3′G (Bartholomé et al. Citation2010) and Q3G hydrolysis has been observed in macrophage-like RAW264, microglial MG6, and brain capillary endothelial RBEC1 cells (Ishisaka et al. Citation2013, Citation2014). β-Glucuronidase activity is increased during inflammation. Because inflamed tissues have a lower pH facilitating β-glucuronidase activity as a result of mitochondrial dysfunction generating lactate (Ishisaka et al. Citation2013) it was suggested that such hydrolysis was a mechanism by which quercetin conjugates become activated when required (Murakami, Ashida, and Terao Citation2008). The protective effect of Q3G in vascular smooth muscle cells against NADPH oxidase generated superoxide radicals was blocked by a β-glucuronidase inhibitor, strongly suggesting that the deconjugation was essential for the activity (Jimenez et al. Citation2015). Intravenous administration of Q3G led to a lowering of blood pressure, and an inhibition of the contractile response of aortic rings, and both effects were blocked by a β-glucuronidase inhibitor (Menendez et al. Citation2011). When macrophage cells were challenged with an inflammatory stress, deconjugation of applied Q3G was proposed to be one of the mechanisms of protection (Nishikawa et al. Citation2022). The activation of Q3G in volunteers after consumption of quercetin by plasma β-glucuronidase activity led to increase in arterial diameter (Perez et al., Citation2014). Note that neonatal hepatic β-glucuronidase activity is high at birth but declines to a plateau at 4 months which in combination with low UGT activity increases the potential for the neonate to be exposed to quercetin derived from quercetin-glucuronides in maternal milk (Collier, Citation2009).
Several aspects associated with this re-activation remain unclear:
Is the activity associated with the transient aglycone per se or its ortho-quinone/p-quinone-methide?
Is the fate of the transient aglycone a protein hapten, glutathione adduct/mercapturic acid (see also 4.2.) or is it re-inactivated by COMT methylation or sulfate conjugation (see also section section 3.3.1)?
Can desulfation also occur?
Aryl-sulfatase A and B are soluble lysosomal enzymes with optimal activity at pH 4–5.7, but aryl-sulfatase C is a membrane-bound microsomal enzyme with a pH 7–8 optimum and thus less active at the pH values associated with inflammation. These three enzymes have different physiological substrates, but all cleave the sulfate moiety from xenobiotics such as 4-methylumbelliferyl sulfate. Aryl-sulfatase C as isolated has two distinct components (estrone sulfatase EC 3.1.6.1 and steroid sulfatase EC 3.1.6.2). Estrone sulfatase is the dominant isoform in liver, kidney and pancreas but occurs with lower activity in most other organs including the gut (Munroe and Chang, Citation1987). In human liver microsomes, estrone sulfatase is inhibited competitively by quercetin (IC50 < 10 μmol/l), whereas steroid sulfatase is inhibited non-competitively. ARSC can hydrolyze all quercetin-sulfates except Q3S (Barron and Ibrahim, Citation1988a) but hydrolysis of the dominant human metabolite Q3’S was slower than either Q7S or Q4’S (Barron and Ibrahim, Citation1988b). It has been reported that while quercetin inhibited growth of normal human mammary epithelial cells (HMECs) and MDA-MB-231 breast cancer cells in a concentration-dependent manner (IC50 20 μmol/l and 50 μmol/l, respectively), Q3S was inactive, presumably because it was not a substrate for ARSC (Shimoi et al., Citation2004)—unfortunately the other regio-isomers have not been tested in this model. Although it has been reported that quercetin and Q3′S inhibit the growth of human breast cancer MCF-7 cells in a dose-dependent manner, the respective IC50 values of 23.1 and 27.6 μmol/l indicate that the in vivo effect will be minimal even in the presence of ARSC. However, there may be a protective role for ARSC through desulfation of QS. Quercetin (100 nmol/l) upregulates SULT1E1 in MCF7 cells and increases estradiol sulfation ca 2.5-fold at 400 nmol/l (Jiang, Dai, and Chen Citation2019) suggesting that any protection by quercetin against estrogen-driven carcinogenesis is by promoting estrogen inactivation rather than preventing estrogen activation by desulfation, but whether this is achievable in vivo is questionable. Soluble lysosomal aryl-sulfatase B (ARSB) can hydrolyze Q3′S. Inhibition of ARSB hydrolysis of Q3′S and/or inhibition of Q3′S efflux in HEK-293 cells suppressed SULT1A3 and hence production of Q3′S by SULT1A3. How Q3′S enters the lysosome is unclear, but possibly via an OATP transporter (Pei et al. Citation2022). Because Q3′S is a major human metabolite it seems that there is little if any suppression of its production in vivo.
6. Conclusions and recommendations for future work
There are at least 19 human phase-2 conjugates of quercetin. The number and relative concentrations vary with the individual and tissue but analyses using authentic standards indicate that 3′MQ3G, Q3G and Q3′S are present in the greatest quantities—see section 3.3.1, and . Consumption of quercetin-glycosides as part of routine diets and the use of quercetin or quercetin-glycoside supplements provide very different doses of quercetin and cannot always be directly compared. As discussed in sections 3.3.1 and 3.3.8, large doses of quercetin or its glycosides as supplements up to 17 mg/kg (56 μmol/kg, 3.6 mmol = 1.1 g for a 65 kg individual) dosed i.v. and 3.65 mmol taken orally are well tolerated. Daily repeat dosing of 3.65 mmol over four weeks produced a mean plasma quercetin Cmax after hydrolysis of 1.5 ± 0.85 μmol/l. However, in contrast the relatively low concentrations of quercetin glycosides in beverages such as green tea and black tea even when eight cups per day are consumed at 2-h intervals for three consecutive days produced only ca 46 nmol/l total phase-2 conjugates after acid hydrolysis (see section 3.3.3). The relatively rapid clearance of the quercetin phase-2 conjugates (apparent half-life of over 12 h, but true half-life may be <1 h, see section 3.3.1), even when biphasic, results in an exponential decline in the rate of increase—from ca 6 to ca 36 nmol/l on day 1, to ca 41 nmol/l on day 2 and to ca 46 nmol/l on day 3—suggesting that the steady state would not reach 100 nmol/l even if this pattern of consumption were continued. Although such beverages are popular, many who consume them regularly will not match the eight cups/day implying that for many individuals steady state plasma total quercetin phase-2 conjugates might not reach even 50 nmol/l, albeit elevated intermittently by quercetin glycosides in wine, fruit, vegetables, etc. consumed contemporaneously. However, a mean spot value (i.e., not steady state) of ca 210 nmol/l (N = 37) for the three main quercetin phase-2 conjugates collectively (quantified with authentic standards) has been recorded (see 5.1) and the extremely skewed distributions (see section 3.3.2) indicate that some individuals have a greater potential for benefit, and this contrast highlights a significant gap in the literature—what non-nutrient dietary (poly)phenol metabolites are present, and in what concentrations, in the plasma and tissues of free-living individuals following their habitual unsupplemented diet? Analysis of spot plasma samples collected from individuals of various ages, socio-economic background, fitness, and dietary preferences will help to fill this gap but monitoring throughout the day would be essential to gain an insight to the steady state, and this would be a tedious procedure for the volunteers, costly and time-consuming for the investigators.
Only one study has provided washout data for quercetin phase-2 conjugates reporting Q7G and Q3S, both ca 100 nmol in the last 24 h of a 48-h washout (see section 3.3.1) but a spot urine (i.e., collected over an undefined period) of 634 ± 368 nmol/l (mean ± s.d.) Q3S after a 24-h washout has also been reported (Domínguez-Fernandez et al. 2022). Interestingly Q3S and Q7G are relatively minor quercetin metabolites and were not reported even after volunteers consumed quercetin-glycoside-rich onions delivering 275 μmol, but because the LOQ for these two metabolites can be 5–10-fold higher than for quercetin and Q3G (Domínguez-Fernández et al. Citation2021; Le Sayec et al. Citation2023; Xu et al. Citation2023), they may have been overlooked. However, when these two are detected in washout urine the failure to detect Q3G suggests that Q3S and Q7G might have been preferentially retained in the tissues. Note that Q3S and Q7G were accompanied in urine by a similar quantity of quercetin aglycone strongly suggesting that hydrolysis had occurred, but in which tissue(s) is unclear.
Q7G is produced by UGT1A10 which is strongly expressed along the GIT, and in the liver and kidney. It is effluxed to the blood and present only in traces in duodenal fluid and is converted to Q3′S in the liver. It is not taken up by dermal fibroblasts in vitro and is the least stable and most toxic QG in macrophages, possibly following haptenization. Q7G is a relatively poor substrate for OAT3 in the kidney proximal tubule. Q3S suppressed triglyceride content in mature adipocytes at 1 μmol/l. It is not a substrate for P-gp or ARSC and did not suppress growth of breast cancer cells in vitro.
Tissue uptake merits further investigation, and as previously suggested (Pereira-Caro et al. Citation2023) an indication of tissue accumulation could be obtained by requesting volunteers to keep diet-diaries for seven days and then provide washout urine samples collected at 12 h-intervals over at least three days while on a low non-nutrient (poly)phenol diet. Analysis of the urines for metabolites associated exclusively with non-nutrient dietary (poly)phenols, as distinct from those also associated with phenylalanine, tyrosine and catecholamines metabolism, would identify metabolites accumulated in tissues but derived from commodities consumed prior to the three-day washout. However, it could not identify which tissue(s) were involved.
Data from dietary studies for metabolites in plasma and urine indicate that inter-individual variation is substantial and sometimes possibly masks a bimodal distribution. This phenomenon has rarely been acknowledged or discussed and along with temporal variation for an individual must be better defined and explained. It follows that if dietary quercetin glycosides, as distinct from supplements, are to have any impact on consumer health, it must be achieved at these low phase-2 conjugate concentrations, or the equivalent aglycone concentrations if deglucuronidation and/or desulfation do occur in vivo.
We have located 44 studies which used quercetin phase-2 conjugates with cultured cells or excised tissue and the summaries in have 39 entries for Q3G, 21 for Q3′S, 10 for 3′MQ3G and one for each of Q7G, Q3S, a Q3S/4S mixture and a QG/QS mixture. If the distinctive washout data for Q7G and Q3S, discussed above, are confirmed these minor conjugates merit further investigation in vitro. Only one study tested as low as 1 nmol/l, one other tested down to 10 nmol/l, five down to 100 nmol/l, but no other study used less than 200 nmol/l—i.e., only two out of 44 studies investigated metabolite concentrations proven to occur in the plasma of free-living individuals following their unsupplemented diet. Statistically significant effects were reported in one study at 10 nmol/l and in a further five studies at 100 nmol/l, but whether these would translate to biologically significant effects in vivo is unclear. Many of the other 38 studies required >10 μmol/l to generate a statistically significant effect, and such concentrations are unlikely to be achieved in vivo.
However, at concentrations of metabolite below 100 nmol/l, any associated biological effect is likely to be modest and statistically difficult to detect in vivo because of large replicate error on standards, blanks, and samples associated with complex multi-step procedures using biological reagents. Examination of published replicate scatter suggests that a 1% change in a clinically-relevant endpoint would be impossible to detect, but a 1% improvement in a clinically relevant endpoint repeated daily for 30 years might amount to a significant health benefit. Accordingly, there is an acute requirement for analytical methods with greater precision and greater sensitivity than is currently available for such clinically relevant endpoints, and for them to be applied to studies using in vitro concentrations below 100 nmol/l as well as in clinical interventions.
There is evidence (see section 5.2.6) in vitro that at least sometimes quercetin is responsible for the effects of QG demonstrating that β-glucuronidase is an essential activator, but the extent to which this occurs in vivo is unknown, and desulfation seems not to have been considered. If desulfation and/or deglucuronidation do occur in vivo the fate of the chemically unstable aglycone must be determined because there is a possibility of haptenization producing undesirable effects (see section 4.2) especially when volunteers take large supplements long-term. Labeled phase-2 conjugates will be required initially for in vitro cell culture investigations supported if safe.by i.v. infusion and LC–HRMS analysis of plasma and urine. Because of the established importance of mammalian glycosidases (see sections 3.3.8 and 3.3.9), volunteers should be screened where appropriate for lactase deficiency, lactase non-persistence and genotypes relevant to the mechanisms identified.
Synergy between individual quercetin phase-2 conjugates, with metabolites of other non-nutrient dietary (poly)phenols and/or other classes of non-nutrient dietary phytochemicals has not been systematically investigated. As discussed in sections 3.3.1 and 3.3.7, complex interactions occurred modulating quercetin and isoflavone metabolism when onions and tofu were consumed together. Quercetin aglycone increases tissue uptake of EGCG when volunteers consumed them together, and Q3G, EGCG and β-glucuronidase have all been identified immuno-histologically in foam cells. Such investigations are desirable but require proven mechanisms for each metabolite under test so that potentially synergistic and antagonistic combinations (e.g. Q3G and Q3′S in angiogenesis) can be selected for evaluation in vitro in preparation for volunteer studies. Random combinations, whether in vitro or in vivo, are difficult to interpret. Only when a thorough understanding of the mechanisms underlying the biological properties of quercetin and its phase-2 conjugates has been achieved will it be possible to provide authoritative and targeted dietary advice and an opinion on the merits of supplementation.
Supplementation studies (see section 3.3.8) have demonstrated that plasma concentrations of quercetin after hydrolysis can reach 2.5 μmol/l, with Q3G, 3′MQ3G and Q3′S reaching mean values of ca 600, ca 2,200 and ca 50 nmol/l, respectively, after one month of supplementation. These values changed little over the next two months of continued supplementation, albeit with quite marked inter-individual variation. Reference to indicates that such concentrations, especially if sustained, bring Q3G into contention with reference to potentially beneficial effects in macrophages, and 3′MQ3G with reference to beneficial effects on endothelial cells, especially if β-glucuronidase activation is available. While prevention of damage is undoubtedly better than cure, once damage has occurred whether this is superior to the use of approved clinical drug treatments is debatable. As discussed in section 3.3.1 human duodenal fluid following supplementation may be saturated with quercetin, Q3′G and Q4′G, perhaps sufficient to inhibit transporters such as SVCT2, trypsin and α-glucosidases but unlikely to inhibit pancreatic lipase.
These observations collectively lead us to conclude that there is still a discontinuity between the concentrations used in vitro and the plasma concentrations observed after food or supplementation. Although some studies have shown effects after quercetin supplementation in volunteers, definitive studies on quercetin-rich foods which specifically demonstrate the effects of quercetin are still lacking. There is a need for tightly focussed investigations designed to identify mechanisms of action which operate at low concentrations for an extended period of time as seen for habitual intake of normal diets.
| Abbreviations | ||
| ARSA | = | aryl-sulfatase A, cerebroside sulfatase (EC 3.1.6.1) |
| ARSB | = | aryl-sulfatase B (EC 3.1.6.1) |
| ARSC | = | aryl-sulfatase C (EC 3.1.6.1) |
| AUC | = | area under the curve |
| BCRP (ABCG2) | = | breast cancer resistance protein |
| Cmax | = | maximum concentration |
| CBG | = | cytosolic β-glucosidase |
| COMT | = | catechol-O-methyl transferase |
| COX2 | = | cyclooxygenase 2 |
| GIT | = | gastrointestinal tract |
| GLUT2 | = | facilitative glucose transporter 2 |
| GTP | = | green tea polyphenols |
| HAEC | = | human aortic endothelial cells |
| HO-1 | = | heme oxygenase |
| HUVEC | = | human umbilical vein endothelial cell |
| i.v. | = | intravenous |
| IL-1 | = | interleukin 1 |
| IL-6 | = | interleukin 6 |
| IL-8 | = | interleukin 8 |
| i.p. | = | intraperitoneal |
| LC–MS | = | liquid chromatography–mass spectrometry |
| LOD | = | limit of detection |
| LPH | = | lactase phlorizin hydrolase |
| LPS | = | lipopolysaccharide |
| MCT | = | monocarboxylate transporter |
| MRP | = | multidrug resistance-associated protein |
| NF-kB | = | nuclear factor kappa-light-chain-enhancer of activated B cells |
| OAT | = | organic anion transporter |
| OATP-B | = | organic anion transporting protein B |
| P-gp | = | P-glycoprotein |
| Q3G | = | quercetin-3-glucuronide |
| Q3′G | = | quercetin-3′-glucuronide |
| Q3S | = | quercetin-3-sulfate |
| 3′MQ | = | 3’-methylquercetin (isorhamnetin) |
| 4’MQ | = | 4’-methylquercetin (tamarixetin) |
| 3’MQ3G | = | 3′-methylquercetin-3-glucuronide (isorhamnetin-3-glucuronide) |
| 3′MQ7G4′S | = | 3′-methylquercetin-7-glucuronide-4′-sulfate (isorhamnetin-7-glucuronide-4′-sulfate) |
| Q3′S | = | quercetin-3′-sulfate |
| Q4′S | = | quercetin-4′-sulfate |
| Q7S | = | quercetin-7-sulfate |
| Q4′G | = | quercetin-4′-glucuronide |
| Q7G | = | quercetin-7-glucuronide |
| Q7G3′S | = | quercetin-7-glucuronide-3′-sulfate |
| QdiG | = | quercetin-diglucuronide (isomer(s) not defined) |
| QG | = | quercetin-glucuronide (isomer(s) not defined) |
| QS | = | quercetin-sulfate (isomer(s) not defined) |
| QSG | = | quercetin-sulfate-glucuronide (isomer(s) not defined) |
| SGLT1 | = | sodium-dependent glucose transporter |
| SULT | = | sulfotransferase |
| Tmax | = | time of maximum plasm concentration |
| T0.5 | = | time for 50% reduction in plasma concentration |
| TNF-α | = | tumor necrosis factor-α |
| UGT | = | uridine-diphosphate-glucuronosyl transferase |
Disclosure statement
No potential conflict of interest was reported by the authors.
Additional information
Funding
Notes
1 Glucose, galactose and xylose all interact with SGLT1.
2 For example, after 16 volunteers consumed apple sauce enriched with apple peel the Cmax s.d. value for total quercetin-sulfo-glucuronides exceeds the mean value 3.7-fold (Lee et al. Citation2012).
3 A separate study reported quercetin-3-rutinoside was dominant (3.7 mg/g d.m.) in maté leaf, plus quercetin-3-glycoside and tentatively quercetin-3-rhamnoside giving a total flavonols content of 4.7–5.1 mg/g d.m. (Bravo, Goya, and Lecumberri Citation2007). This suggests that the beverage used by Gomez-Juaristi et al. delivered ca 25 μmol quercetin mainly as the -3-rutinoside.
References
- Almeida, A. F., G. I. A. Borge, M. Piskula, A. Tudose, L. Tudoreanu, K. Valentová, G. Williamson, and C. N. Santos. 2018. Bioavailability of quercetin in humans with a focus on interindividual variation. Comprehensive Reviews in Food Science and Food Safety 17 (3):714–31. doi: 10.1111/1541-4337.12342.
- Andres-Lacueva, C., M. Monagas, N. Khan, M. Izquierdo-Pulido, M. Urpi-Sarda, J. Permanyer, and R. M. Lamuela-Raventos. 2008. Flavanol and flavonol contents of cocoa powder products: Influence of the manufacturing process. Journal of Agricultural and Food Chemistry 56 (9):3111–7. doi: 10.1021/jf0728754.
- Arts, I. C. W., D. P. Venema, and P. C. H. Hollman. 2003. Quantitative determination of flavonols in plant foods and biological fluids. In Methods in polyphenol analysis, ed. C. Santos-Buelga and G. Williamson, 214–28. Cambridge: Royal Society of Chemistry.
- Awad, H. M., M. G. Boersma, S. Boeren, H. v d Woude, J. van Zanden, P. J. van Bladeren, J. Vervoort, and I. M. Rietjens. 2002. Identification of o-quinone/quinone methide metabolites of quercetin in a cellular in vitro system. FEBS Letters 520 (1–3):30–4. doi: 10.1016/s0014-5793(02)02754-0.
- Aziz, A. A., C. A. Edwards, M. E. J. Lean, and A. Crozier. 1998. Absorption and excretion of conjugated flavonols, including quercetin-4’-O-β-glucoside and isorhamnetin-4’-O-β-glucoside by human volunteers after the consumption of onions. Free Radical Research 29 (3):257–69. doi: 10.1080/10715769800300291.
- Baba, S., T. Furuta, M. Horie, and H. Nakagawa. 1981. Studies on drug metabolism by use of isotopes XXVI: Determination of urinary metabolites of rutin in humans. Journal of Pharmaceutical Sciences 70 (7):780–2. doi: 10.1002/jps.2600700717.
- Baral, S., R. Pariyar, J. Kim, H. S. Lee, and J. Seo. 2017. Quercetin-3-O-glucuronide promotes the proliferation and migration of neural stem cells. Neurobiology of Aging 52:39–52. doi: 10.1016/j.neurobiolaging.2016.12.024.
- Barber, E., M. J. Houghton, and G. Williamson. 2021. Flavonoids as human intestinal α-glucosidase inhibitors. Foods (Basel, Switzerland) 10 (8):1939. doi: 10.3390/foods10081939.
- Barrington, R., G. Williamson, R. N. Bennett, B. D. Davis, J. S. Brodbelt, and P. A. Kroon. 2009. Absorption, conjugation and efflux of the flavonoids, kaempferol and galangin, using the intestinal CACO-2/TC7 cell model. Journal of Functional Foods 1 (1):74–87. doi: 10.1016/j.jff.2008.09.011.
- Barron, D., and R. K. Ibrahim. 1988a. Hydrochloric-acid and aryl-sulphatase as reagents for UV-spectral detection of 3-sulphated and 4’-sulphated flavonoids. Phytochemistry 27 (7):2335–8. doi: 10.1016/0031-9422(88)80155-9.
- Barron, D., and R. K. Ibrahim. 1988b. Synthesis of flavonoid sulfates. III. Synthesis of 3′,4′-ortho disulfates using sulfur trioxide-trimethylamine complex, and of 3′-suIfates using aryl sulfatase. Zeitschrift Für Naturforschung C 43 (9-10):631–5. doi: 10.1515/znc-1988-9-1002.
- Barron, D., C. Cren-Olive, and P. Needs. 2003. Chemical synthesis of flavonoid conjugates. In Methods in Polyphenol Analysis, ed. C. Santos-Buelga and G. Williamson, 187–213. Cambridge: Royal Society of Chemistry.
- Barron, D., C. Smarrito-Menozzi, R. Fumeaux, and F. Viton. 2016. Synthesis of dietary phenolic metabolites and isotopically labeled dietary phenolics. In Flavonoids and related compounds: Bioavailability and function, ed. J.P.E. Spencer and A. Crozier, 234–80. CRC Press.Boca Raton, London and New York
- Bartholomé, R., G. Haenen, C. H. Hollman, A. Bast, P. C. Dagnelie, D. Roos, J. Keijer, P. A. Kroon, P. W. Needs, and C. W. Arts. 2010. Deconjugation kinetics of glucuronidated phase II flavonoid metabolites by β-glucuronidase from neutrophils. Drug Metabolism and Pharmacokinetics 25 (4):379–87. doi: 10.2133/dmpk.dmpk-10-rg-002.
- Basit, A., N. K. Neradugomma, C. Wolford, P. W. Fan, B. Murray, R. H. Takahashi, S. C. Khojasteh, B. J. Smith, S. Heyward, R. A. Totah, et al. 2020. Characterization of differential tissue abundance of major non-CYP enzymes in human. Molecular Pharmaceutics 17 (11):4114–24. doi: 10.1021/acs.molpharmaceut.0c00559.
- Bazyar, H., J. Ahmad Zare, A. Ahangarpour, F. Zaman, S. A. Hosseini, V. Zohoori, V. Aghamohammadi, S. Yazdanfar, and M. Ghasemi Deh Cheshmeh. 2023. The effects of rutin supplement on blood pressure markers, some serum antioxidant enzymes, and quality of life in patients with type 2 diabetes mellitus compared with placebo. Frontiers in Nutrition 10:1214420. doi: 10.3389/fnut.2023.1214420.
- Bazyar, H., L. Moradi, F. Zaman, and A. Zare Javid. 2023. The effects of rutin flavonoid supplement on glycemic status, lipid profile, atherogenic index of plasma, brain-derived neurotrophic factor (BDNF), some serum inflammatory, and oxidative stress factors in patients with type 2 diabetes mellitus: A double-blind, placebo-controlled trial. Phytotherapy Research: PTR 37 (1):271–84. doi: 10.1002/ptr.7611.
- Beekmann, K., R. Laura, H. J. d H. Laura, L. Actis-Goretta, B. van der Burg, P. J. van Bladeren, and I. M. C. M. Rietjens. 2015. The effect of quercetin and kaempferol aglycones and glucuronides on peroxisome proliferator-activated receptor-gamma (PPAR-gamma). Food & Function 6 (4):1098–107. doi: 10.1039/c5fo00076a.
- Beiler, J. M., and G. J. Martin. 1951. The inhibition of xanthine oxidase by flavonoids and related compounds. The Journal of Biological Chemistry 192 (2):831–4. doi: 10.1016/S0021-9258(19)77805-3.
- Boersma, M. G., H. Woude, J. van der, S. Bogaards, J. Boeren, N. H. Vervoort, M. L. Cnubben, P. v B. van Iersel, and I. M. Rietjens. 2002. Regioselectivity of phase II metabolism of luteolin and quercetin by UDP-glucuronosyl transferases. Chemical Research in Toxicology 15 (5):662–70. doi: 10.1021/tx0101705.
- Boesch-Saadatmandi, C., A. Loboda, A. E. Wagner, A. Stachurska, A. Jozkowicz, J. Dulak, F. Döring, S. Wolffram, and G. Rimbach. 2011. Effect of quercetin and its metabolites isorhamnetin and quercetin-3-glucuronide on inflammatory gene expression: Role of miR-155. The Journal of Nutritional Biochemistry 22 (3):293–9. doi: 10.1016/j.jnutbio.2010.02.008.
- Boesch-Saadatmandi, C., R. T. Pospissil, A. C. Graeser, R. Canali, I. Boomgaarden, F. Doering, S. Wolffram, S. Egert, M. J. Mueller, and G. Rimbach. 2009. Effect of quercetin on paraoxonase 2 levels in RAW264.7 macrophages and in human monocytes-role of quercetin metabolism. International Journal of Molecular Sciences 10 (9):4168–77. doi: 10.3390/ijms10094168.
- Bolton, J. L. 2014. Quinone methide bioactivation pathway: Contribution to toxicity and/or cytoprotection? Current Organic Chemistry 18 (1):61–9. doi: 10.2174/138527281801140121123046.
- Bondonno, N. P., C. P. Bondonno, N. C. Ward, R. J. Woodman, J. M. Hodgson, and K. D. Croft. 2020. Enzymatically modified isoquercitrin improves endothelial function in volunteers at risk of cardiovascular disease. The British Journal of Nutrition 123 (2):182–9. doi: 10.1017/s0007114519002137.
- Boyle, S. P., V. L. Dobson, S. J. Duthie, J. A. Kyle, and A. R. Collins. 2000. Absorption and DNA protective effects of flavonoid glycosides from an onion meal. European Journal of Nutrition 39 (5):213–23. doi: 10.1007/s003940070014.
- Braune, A., M. Gütschow, W. Engst, and M. Blaut. 2001. Degradation of quercetin and luteolin by Eubacterium ramulus. Applied and Environmental Microbiology 67 (12):5558–67. doi: 10.1128/AEM.67.12.5558-5567.2001.
- Bravo, L., L. Goya, and E. Lecumberri. 2007. LC/MS characterization of phenolic constituents of maté (Ilex paraguariensis, St. Hil.) and its antioxidant activity compared to commonly consumed beverages. Food Research International 40 (3):393–405. doi: 10.1016/j.foodres.2006.10.016.
- Breinholt, V. M., E. A. Offord, C. Brouwer, S. E. Nielsen, K. Brøsen, and T. Friedberg. 2002. In vitro investigation of cytochrome P450-mediated metabolism of dietary flavonoids. Food and Chemical Toxicology: An International Journal Published for the British Industrial Biological Research Association 40 (5):609–16. doi: 10.1016/s0278-6915(01)00125-9.
- Cao, H., J. M. Pauff, and R. Hille. 2014. X-ray crystal structure of a xanthine oxidase complex with the flavonoid inhibitor quercetin. Journal of Natural Products 77 (7):1693–9. doi: 10.1021/np500320g.
- Carmella, S. G., E. J. La Voie, and S. S. Hecht. 1982. Quantitative analysis of catechol and 4-methylcatechol in human urine. Food and Chemical Toxicology: An International Journal Published for the British Industrial Biological Research Association 20 (5):587–90. doi: 10.1016/s0278-6915(82)80068-9.
- Cattivelli, A., L. Nissen, F. Casciano, D. Tagliazucchi, and A. Gianotti. 2023. Impact of cooking methods of red-skinned onion on metabolic transformation of phenolic compounds and gut microbiota changes. Food & Function 14 (8):3509–25. doi: 10.1039/d3fo00085k.
- Chabane, M. N., A. Al Ahmad, J. Peluso, C. D. Muller, and G. Ubeaud. 2009. Quercetin and naringenin transport across human intestinal Caco-2 cells. The Journal of Pharmacy and Pharmacology 61 (11):1473–83. doi: 10.1211/jpp/61.11.0006.
- Chalet, C., B. Hollebrands, G. S. Duchateau, and P. Augustijns. 2019. Intestinal phase-II metabolism of quercetin in HT29 cells, 3D human intestinal tissues and in healthy volunteers: A qualitative comparison using LC-IMS-MS and LC-HRMS. Xenobiotica; the Fate of Foreign Compounds in Biological Systems 49 (8):945–52. doi: 10.1080/00498254.2018.1509246.
- Chalet, C., J. Rubbens, J. Tack, G. S. Duchateau, and P. Augustijns. 2018. Intestinal disposition of quercetin and its phase-II metabolites after oral administration in healthy volunteers. The Journal of Pharmacy and Pharmacology 70 (8):1002–8. doi: 10.1111/jphp.12929.
- Chao, C. L., Y. C. Hou, P. D. Chao, C. S. Weng, and F. M. Ho. 2009. The antioxidant effects of quercetin metabolites on the prevention of high glucose-induced apoptosis of human umbilical vein endothelial cells. The British Journal of Nutrition 101 (8):1165–70. doi: 10.1017/S0007114508073637.
- Chen, Y., P. Xiao, D.-S. Ou-Yang, L. Fan, D. Guo, Y.-N. Wang, Y. Han, J.-H. Tu, G. Zhou, Y.-F. Huang, et al. 2009. Simultaneous action of the flavonoid quercetin on cytochrome P450 (CYP) 1A2, CYP2A6, N-acetyltransferase and xanthine oxidase activity in healthy volunteers. Clinical and Experimental Pharmacology & Physiology 36 (8):828–33. doi: 10.1111/j.1440-1681.2009.05158.x.
- Chen, Z. J., Y. Q. Dai, S. S. Kong, F. F. Song, L. P. Li, J. F. Ye, R. W. Wang, S. Zeng, H. Zhou, and H. D. Jiang. 2013. Luteolin is a rare substrate of human catechol-O-methyltransferase favoring a para-methylation. Molecular Nutrition & Food Research 57 (5):877–85. doi: 10.1002/mnfr.201200584.
- Cialdella-Kam, L., D. C. Nieman, W. Sha, M. P. Meaney, A. M. Knab, and R. A. Shanely. 2013. Dose-response to 3 months of quercetin-containing supplements on metabolite and quercetin conjugate profile in adults. The British Journal of Nutrition 109 (11):1923–33. doi: 10.1017/S0007114512003972.
- Clifford, M. N., and N. Kuhnert. 2022. LC–MS characterisation and quantification of known and unknown (poly)phenol metabolites—possible pitfalls and their avoidance. Molecular Nutrition & Food Research 66 (21):e2101013. doi: 10.1002/mnfr.202101013.
- Clifford, M. N., L. J. King, A. Kerimi, M. G. Pereira-Caro, and G. Williamson. 2022. Metabolism of phenolics in coffee and plant-based foods by canonical pathways: An assessment of the role of fatty acid β-oxidation to generate biologically-active and -inactive intermediates. Critical Reviews in Food Science and Nutrition 62:1–58. doi: 10.1080/10408398.2022.2131730.
- Collier, A. C. 2009. The ontogeny of detoxification enzymes in pediatric liver. Drug Metabolism Reviews 41:14.
- Combet, E., M. E. Lean, J. G. Boyle, A. Crozier, and D. F. Davidson. 2011. Dietary flavonols contribute to false-positive elevation of homovanillic acid, a marker of catecholamine-secreting tumors. Clinica Chimica Acta; International Journal of Clinical Chemistry 412 (1–2):165–9. doi: 10.1016/j.cca.2010.09.037.
- Cuccioloni, M., M. Mozzicafreddo, L. Bonfili, V. Cecarini, A. M. Eleuteri, and M. Angeletti. 2009. Natural occurring polyphenols as template for drug design. Focus on serine proteases. Chemical Biology & Drug Design 74 (1):1–15. doi: 10.1111/j.1747-0285.2009.00836.x.
- Cui, S., Q. Wu, J. Wang, M. Li, J. Qian, and S. Li. 2019. Quercetin inhibits LPS-induced macrophage migration by suppressing the iNOS/FAK/paxillin pathway and modulating the cytoskeleton. Cell Adhesion & Migration 13 (1):1–12. doi: 10.1080/193369182018.1486142.
- Day, A. J., F. Mellon, D. Barron, G. Sarrazin, M. R. A. Morgan, and G. Williamson. 2001. Human metabolism of dietary flavonoids: Identification of plasma metabolites of quercetin. Free Radical Research 35 (6):941–52. doi: 10.1080/10715760100301441.
- Day, A. J., J. M. Gee, M. S. DuPont, I. T. Johnson, and G. Williamson. 2003. Absorption of quercetin-3-glucoside and quercetin-4’-glucoside in the rat small intestine: The role of lactase phlorizin hydrolase and the sodium-dependent glucose transporter. Biochemical Pharmacology 65 (7):1199–206. doi: 10.1016/s0006-2952(03)00039-x.
- Day, A. J., Y. Bao, M. R. A. Morgan, and G. Williamson. 2000. Conjugation position of quercetin glucuronides and effect on biological activity. Free Radical Biology & Medicine 29 (12):1234–43. doi: 10.1016/s0891-5849(00)00416-0.
- de Ferrars, R. M., C. Czank, Q. Zhang, N. P. Botting, P. A. Kroon, A. Cassidy, and C. D. Kay. 2014. The pharmacokinetics of anthocyanins and their metabolites in humans. British Journal of Pharmacology 171 (13):3268–82. [doi]. doi: 10.1111/bph.12676.
- de Vries, J. H., P. C. Hollman, I. van Amersfoort, M. R. Olthof, and M. B. Katan. 2001. Red wine is a poor source of bioavailable flavonols in men. The Journal of Nutrition 131 (3):745–8. doi: 10.1093/jn/131.3.745.
- Del Rio, D., A. Rodriguez-Mateos, J. P. Spencer, M. Tognolini, G. Borges, and A. Crozier. 2013. Dietary (poly)phenolics in human health: Structures, bioavailability, and evidence of protective effects against chronic diseases. Antioxidants & Redox Signaling 18 (14):1818–92. doi: 10.1089/ars.2012.4581.
- de-Pascual-Teresa, S., K. L. Johnston, M. S. DuPont, K. A. O’Leary, P. W. Needs, L. M. Morgan, M. N. Clifford, Y. Bao, and G. Williamson. 2004. Quercetin metabolites down regulate cyclooxygenase-2 transcription in human lymphocytes ex vivo but not in vivo. The Journal of Nutrition 134 (3):552–7. doi: 10.1093/jn/134.3.552.
- Derlindati, E., M. Dall’Asta, D. Ardigò, F. Brighenti, I. Zavaroni, A. Crozier, and D. Del Rio. 2012. Quercetin-3-O-glucuronide affects the gene expression profile of M1 and M2a human macrophages exhibiting anti-inflammatory effects. Food & Function 3 (11):1144–52. doi: 10.1039/c2fo30127j.
- Dietz, B. M., and J. L. Bolton. 2011. Biological reactive intermediates (BRIs) formed from botanical dietary supplements. Chemico-Biological Interactions 192 (1-2):72–80. doi: 10.1016/j.cbi.2010.10.007.
- Domínguez-Fernández, M., P. Young Tie Yang, I. A. Ludwig, M. N. Clifford, C. Cid, and A. Rodriguez-Mateos. 2022. In vivo study of the bioavailability and metabolic profile of (poly)phenols after sous-vide artichoke consumption. Food Chemistry 367:130620. doi: 10.1016/j.foodchem.2021.130620.
- Domínguez-Fernández, M., Y. Xu, P. Young Tie Yang, W. Alotaibi, R. Gibson, W. L. Hall, L. Barron, I. A. Ludwig, C. Cid, and A. Rodriguez-Mateos. 2021. Quantitative assessment of dietary (Poly)phenol intake: A high-throughput targeted metabolomics method for blood and urine samples. Journal of Agricultural and Food Chemistry 69 (1):537–54. doi: 10.1021/acs.jafc.0c07055.
- Donnini, S., F. Finetti, L. Lusini, L. Morbidelli, V. Cheynier, D. Barron, G. Williamson, J. Waltenberger, and M. Ziche. 2006. Divergent effects of quercetin conjugates on angiogenesis. The British Journal of Nutrition 95 (5):1016–23. doi: 10.1079/bjn20061753.
- Dueñas, M., H. Mingo-Chornet, J. J. Pérez-Alonso, R. Di Paola-Naranjo, A. M. González-Paramás, and C. Santos-Buelga. 2008. Preparation of quercetin glucuronides and characterization by HPLC-DAD-ESI/MS. European Food Research and Technology 227 (4):1069–76. doi: 10.1007/s00217-008-0821-2.
- Dueñas, M., S. González-Manzano, F. Surco-Laos, A. González-Paramas, and C. Santos-Buelga. 2012. Characterization of sulfated quercetin and epicatechin metabolites. Journal of Agricultural and Food Chemistry 60 (14):3592–8. doi: 10.1021/jf2050203.
- DuPont, M. S., R. N. Bennett, F. A. Mellon, and G. Williamson. 2002. Polyphenols from alcoholic apple cider are absorbed, metabolized and excreted by humans. The Journal of Nutrition 132 (2):172–5. doi: 10.1093/jn/132.2.172.
- Egert, S., and E. Wisker. 2011. Quercetin Part 1-chemical structure, content in foods, daily intake and bioavailability. Ernahrungs Umschau 58 (8):416.
- Egert, S., S. Wolffram, B. Schulze, P. Langguth, E. M. Hubbermann, K. Schwarz, B. Adolphi, A. Bosy-Westphal, G. Rimbach, and M. J. Müller. 2012. Enriched cereal bars are more effective in increasing plasma quercetin compared with quercetin from powder-filled hard capsules. The British Journal of Nutrition 107 (4):539–46. doi: 10.1017/s0007114511003242.
- Elferink, H., J. P. J. Bruekers, G. H. Veeneman, and T. J. Boltje. 2020. A comprehensive overview of substrate specificity of glycoside hydrolases and transporters in the small intestine. A gut feeling. Cellular and Molecular Life Sciences: CMLS 77 (23):4799–826. doi: 10.1007/s00018-020-03564-1.
- Erlund, I., T. Kosonen, G. Alfthan, J. Mäenpää, K. Perttunen, J. Kenraali, J. Parantainen, and A. Aro. 2000. Pharmacokinetics of quercetin from quercetin aglycone and rutin in healthy volunteers. European Journal of Clinical Pharmacology 56 (8):545–53. doi: 10.1007/s002280000197.
- Eseberri, I., J. Miranda, A. Lasa, A. Mosqueda-Solís, S. González-Manzano, C. Santos-Buelga, and M. P. Portillo. 2019. Effects of quercetin metabolites on triglyceride metabolism of 3T3-L1 preadipocytes and mature adipocytes. International Journal of Molecular Sciences 20 (2):264. doi: 10.3390/ijms20020264.
- Esperester, A., and S. Nees. 2014. Method for the anti-inflammatory protection of transplants using quercetin glucuronide. Boehringer Ingelheim International GmbH. USA.
- Ewald, C., S. Fjelkner-Modig, K. Johansson, I. Sjöholm, and B. Åkesson. 1999. Effect of processing on major flavonoids in processed onions, green beans, and peas. Food Chemistry 64 (2):231–5. doi: 10.1016/S0308-8146(98)00136-8.
- Fabjan, N., J. Rode, I. J. Kosir, Z. Wang, Z. Zhang, and I. Kreft. 2003. Tartary buckwheat (Fagopyrum tataricum Gaertn.) as a source of dietary rutin and quercitrin. Journal of Agricultural and Food Chemistry 51 (22):6452–5. doi: 10.1021/jf034543e.
- Fang, Y., W. Cao, F. Liang, M. Xia, S. Pan, and X. Xu. 2019. Structure affinity relationship and docking studies of flavonoids as substrates of multidrug-resistant associated protein 2 (MRP2) in MDCK/MRP2 cells. Food Chemistry 291:101–9. doi: 10.1016/j.foodchem.2019.03.111.
- Feher, J. 2017. Quantitative human physiology: An introduction. 2nd ed. Elsevier Inc.
- Feliciano, R. P., A. Boeres, L. Massacessi, G. Istas, M. R. Ventura, C. N. dos Santos, C. Heiss, and A. Rodriguez-Mateos. 2016. Identification and quantification of novel cranberry-derived plasma and urinary (poly)phenols. Archives of Biochemistry and Biophysics 599:31–41. doi: 10.1016/j.abb.2016.01.014.
- Feliciano, R. P., C. E. Mills, G. Istas, C. Heiss, and A. Rodriguez-Mateos. 2017. Absorption, metabolism and excretion of cranberry (Poly) phenols in humans: A dose response study and assessment of inter-individual variability. Nutrients 9 (3):268. doi: 10.3390/nu9030268.
- Feliciano, R. P., G. Istas, C. Heiss, and A. Rodriguez-Mateos. 2016. Plasma and urinary phenolic profiles after acute and repetitive intake of wild blueberry. Molecules (Basel, Switzerland) 21 (9):1120. doi: 10.3390/molecules21091120.
- Ferry, D. R., A. Smith, J. Malkhandi, D. W. Fyfe, P. G. deTakats, D. Anderson, J. Baker, and D. J. Kerr. 1996. Phase I clinical trial of the flavonoid quercetin: Pharmacokinetics and evidence for in vivo tyrosine kinase inhibition. Clinical Cancer Research 2 (4):659–68.
- Fridovich, I. 1970. Quantitative aspects of the production of superoxide anion radical by milk xanthine oxidase. The Journal of Biological Chemistry 245 (16):4053–7.
- Fujiwara, N., R. Mukai, M. Nishikawa, S. Ikushiro, A. Murakami, and A. Ishisaka. 2023. Transfer of quercetin ingested by maternal mice to neonatal mice via breast milk. Bioscience, Biotechnology, and Biochemistry 87 (4):442–7. doi: 10.1093/bbb/zbad007.
- Galindo, P., I. Rodriguez-Gómez, S. González-Manzano, M. Dueñas, R. Jiménez, C. Menéndez, F. Vargas, J. Tamargo, C. Santos-Buelga, F. Pérez-Vizcaíno, et al. 2012. Glucuronidated quercetin lowers blood pressure in spontaneously hypertensive rats via deconjugation. PloS One 7 (3):e32673. doi: 10.1371/journal.pone.0032673.
- Gauliard, B., D. Grieve, R. Wilson, A. Crozier, C. Jenkins, W. D. Mullen, and M. Lean. 2008. The effects of dietary phenolic compounds on cytokine and antioxidant production by A549 cells. Journal of Medicinal Food 11 (2):382–4. doi: 10.1089/jmf.2007.593.
- Gerhardt, G., V. Sinnwell, and L. Kraus. 1989. Isolation of quercetin-3-glucuronide from the leaves of Vaccinium myrtillus and Vaccinium uliginosum. Planta Medica (2):200–1.
- Gómez-Juaristi, M., S. Martínez-López, B. Sarria, L. Bravo, and R. Mateos. 2018. Absorption and metabolism of yerba maté phenolic compounds in humans. Food Chemistry 240:1028–38. doi: 10.1016/j.foodchem.2017.08.003.
- Graefe, E. U., J. Wittig, S. Mueller, A. K. Riethling, B. Uehleke, B. Drewelow, H. Pforte, G. Jacobasch, H. Derendorf, and M. Veit. 2001. Pharmacokinetics and bioavailability of quercetin glycosides in humans. Journal of Clinical Pharmacology 41 (5):492–9. doi: 10.1177/00912700122010366.
- Gugler, R., M. Leschik, and H. J. Dengler. 1975. Disposition of quercetin in man after single oral and intravenous doses. European Journal of Clinical Pharmacology 9 (2–3):229–34. doi: 10.1007/BF00614022.
- Guo, X. D., D. Y. Zhang, X. J. Gao, J. Parry, K. Liu, B. L. Liu, and M. Wang. 2013. Quercetin and quercetin-3-O-glucuronide are equally effective in ameliorating endothelial insulin resistance through inhibition of reactive oxygen species-associated inflammation. Molecular Nutrition & Food Research 57 (6):1037–45. doi: 10.1002/mnfr.201200569.
- Guo, Y., W. J. Weber, D. Yao, L. Caixeta, N. P. Zimmerman, J. Thompson, E. Block, T. G. Rehberger, B. A. Crooker, and C. Chen. 2022. Forming 4-methylcatechol as the dominant bioavailable metabolite of intraruminal rutin inhibits p-cresol production in dairy cows. Metabolites 12 (1) doi: 10.3390/metabo12010016.
- Heiss, C., G. Istas, R. P. Feliciano, T. Weber, B. Wang, C. Favari, P. Mena, D. Del Rio, and A. Rodriguez-Mateos. 2022. Daily consumption of cranberry improves endothelial function in healthy adults: A double blind randomized controlled trial. Food & Function 13 (7):3812–24. doi: 10.1039/d2fo00080f.
- Henning, S. M., P. W. Wang, R. P. Lee, A. Trang, G. Husari, J. P. Yang, E. M. Grojean, A. Ly, M. Hsu, D. Heber, et al. 2020. Prospective randomized trial evaluating blood and prostate tissue concentrations of green tea polyphenols and quercetin in men with prostate cancer. Food & Function 11 (5):4114–22. doi: 10.1039/d0fo00565g.
- Herranz-López, M., I. Borrás-Linares, M. Olivares-Vicente, J. Gálvez, A. Segura-Carretero, and V. Micol. 2017. Correlation between the cellular metabolism of quercetin and its glucuronide metabolite and oxidative stress in hypertrophied 3T3-L1 adipocytes. Phytomedicine: International Journal of Phytotherapy and Phytopharmacology 25:25–8. doi: 10.1016/j.phymed.2016.12.008.
- Ho, L., M. G. Ferruzzi, E. M. Janle, J. Wang, B. Gong, T.-Y. Chen, J. Lobo, B. Cooper, Q. L. Wu, S. T. Talcott, et al. 2013. Identification of brain-targeted bioactive dietary quercetin-3-O-glucuronide as a novel intervention for Alzheimer’s disease. FASEB Journal: Official Publication of the Federation of American Societies for Experimental Biology 27 (2):769–81. doi: 10.1096/fj.12-212118.
- Hollman, P. C. H., and I. C. W. Arts. 2000. Flavonols, flavones and flavanols—nature, occurrence and dietary burden. Journal of the Science of Food and Agriculture 80 (7):1081–93. doi: 10.1002/(SICI)1097-0010(20000515)80:7<1081::AID-JSFA566>3.0.CO;2-G.
- Hollman, P. C. H., K. van Het Hof, L. Tijburg, and M. B. Katan. 2001. Addition of milk does not affect the absorption of flavonols from tea in man. Free Radical Research 34 (3):297–300. doi: 10.1080/10715760100300261.
- Hong, Y. J., and A. E. Mitchell. 2006. Identification of glutathione-related quercetin metabolites in humans. Chemical Research in Toxicology 19 (11):1525–32. doi: 10.1021/tx0601758.
- Hong, Y., and A. E. Mitchell. 2004. Metabolic profiling of flavonol metabolites in human urine by liquid chromatography and tandem mass spectrometry. Journal of Agricultural and Food Chemistry 52 (22):6794–801. doi: 10.1021/jf040274w.
- Hu, M., Y. Huang, X. Du, G. Liu, B. Qi, and Y. Li. 2023. The synergistic effect of epigallocatechin-3-gallate and quercetin co-loaded hydrogel beads on inflammatory bowel disease. Food & Function 14 (10):4539–51. doi: 10.1039/d2fo04029h.
- Ishisaka, A., K. Kawabata, S. Miki, Y. Shiba, S. Minekawa, T. Nishikawa, R. Mukai, J. Terao, and Y. Kawai. 2013. Mitochondrial dysfunction leads to deconjugation of quercetin glucuronides in inflammatory macrophages. PloS One 8 (11):e80843. doi: 10.1371/journal.pone.0080843.
- Ishisaka, A., R. Mukai, J. Terao, N. Shibata, and Y. Kawai. 2014. Specific localization of quercetin-3-O-glucuronide in human brain. Archives of Biochemistry and Biophysics 557:11–7. doi: 10.1016/j.abb.2014.05.025.
- Ishizawa, K., Y. Izawa-Ishizawa, S. Ohnishi, Y. Motobayashi, K. Kawazoe, S. Hamano, K. Tsuchiya, S. Tomita, K. Minakuchi, and T. Tamaki. 2009. Quercetin glucuronide inhibits cell migration and proliferation by platelet-derived growth factor in vascular smooth muscle cells. Journal of Pharmacological Sciences 109 (2):257–64. doi: 10.1254/jphs.08236fp.
- Jaganath, I. B., W. Mullen, C. A. Edwards, and A. Crozier. 2006. The relative contribution of the small and large intestine to the absorption and metabolism of rutin in man. Free Radical Research 40 (10):1035–46. doi: 10.1080/10715760600771400.
- Janisch, K. M., G. Williamson, P. Needs, and G. W. Plumb. 2004. Properties of quercetin conjugates: Modulation of LDL oxidation and binding to human serum albumin. Free Radical Research 38 (8):877–84. doi: 10.1080/10715760410001728415.
- Jenner, A. M., J. Rafter, and B. Halliwell. 2005. Human fecal water content of phenolics: The extent of colonic exposure to aromatic compounds. Free Radical Biology & Medicine 38 (6):763–72. doi: 10.1016/j.freeradbiomed.2004.11.020.
- Jiang, W., Z. Dai, and G. Chen. 2019. Estrogen sulfotransferase induction inhibits breast cancer cell line MCF-7 proliferation. Biomedical Journal of Scientific & Technical Research 22 (5):16960–7. doi: 10.26717/bjstr.2019.22.003812.
- Jimenez, R., R. Lopez-Sepulveda, M. Romero, M. Toral, A. Cogolludo, F. Perez-Vizcaino, and J. Duarte. 2015. Quercetin and its metabolites inhibit the membrane NADPH oxidase activity in vascular smooth muscle cells from normotensive and spontaneously hypertensive rats. Food & Function 6 (2):409–14. doi: 10.1039/c4fo00818a.
- Jin, D., H. Hakamata, K. Takahashi, A. Kotani, and F. Kusu. 2004. Determination of quercetin in human plasma after ingestion of commercial canned green tea by semi-micro HPLC with electrochemical detection. Biomedical Chromatography: BMC 18 (9):662–6. doi: 10.1002/bmc.370.
- Jones, D. J. L. 2001. The identification and characterisation of quercetin metabolites in humans and rats. PhD Dissertation/Thesis, MRC Toxicology Unit, University of Leicester.
- Kaeswurm, J. A. H., A. Scharinger, J. Teipel, and M. Buchweitz. 2021. Absorption coefficients of phenolic structures in different solvents routinely used for experiments. Molecules (Basel, Switzerland) 26 (15):4656. doi: 10.3390/molecules26154656.
- Kahle, K., M. Kempf, P. Schreier, W. Scheppach, D. Schrenk, T. Kautenburger, D. Hecker, W. Huemmer, M. Ackermann, and E. Richling. 2011. Intestinal transit and systemic metabolism of apple polyphenols. European Journal of Nutrition 50 (7):507–22. doi: 10.1007/s00394-010-0157-0.
- Kahle, K., M. Kraus, W. Scheppach, and E. Richling. 2005. Colonic availability of apple polyphenols–A study in ileostomy subjects. Molecular Nutrition & Food Research 49 (12):1143–50. doi: 10.1002/mnfr.200500132.
- Kahle, K., M. Kraus, W. Scheppach, M. Ackermann, F. Ridder, and E. Richling. 2006. Studies on apple and blueberry fruit constituents: Do the polyphenols reach the colon after ingestion? Molecular Nutrition & Food Research 50 (4-5):418–23. doi: 10.1002/mnfr.200500211.
- Kapoor, M. P., M. Moriwaki, K. Uguri, D. Timm, and Y. Kuroiwa. 2021. Bioavailability of dietary isoquercitrin-gamma-cyclodextrin molecular inclusion complex in Sprague-Dawley rats and healthy humans. Journal of Functional Foods 85:104663. doi: 10.1016/j.jff.2021.104663.
- Kawai, Y. 2014. β-Glucuronidase activity and mitochondrial dysfunction: The sites where flavonoid glucuronides act as anti-inflammatory agents. Journal of Clinical Biochemistry and Nutrition 54 (3):145–50. doi: 10.3164/jcbn.14-9.
- Kawai, Y., H. Tanaka, K. Murota, M. Naito, and J. Terao. 2008. Epicatechin gallate accumulates in foamy macrophages in human atherosclerotic aorta: Implication in the anti-atherosclerotic actions of tea catechins. Biochemical and Biophysical Research Communications 374 (3):527–32. doi: 10.1016/j.bbrc.2008.07.086.
- Kawai, Y., T. Nishikawa, Y. Shiba, S. Saito, K. Murota, N. Shibata, M. Kobayashi, M. Kanayama, K. Uchida, and J. Terao. 2008. Macrophage as a target of quercetin glucuronides in human atherosclerotic arteries: Implication in the anti-atherosclerotic mechanism of dietary flavonoids. The Journal of Biological Chemistry 283 (14):9424–34. doi: 10.1074/jbc.M706571200.
- Kay, C. D., M. N. Clifford, P. Mena, J. G. McDougall, C. Andres-Lacueva, A. Cassidy, D. Del Rio, N. Kuhnert, C. Manach, G. Pereira-Caro, et al. 2020. Special article recommendations for standardizing nomenclature for dietary (poly)phenol catabolites. The American Journal of Clinical Nutrition 112 (4):1051–68. doi: 10.1093/ajcn/nqaa204.
- Kellett, G. L., E. Brot-Laroche, O. J. Mace, and A. Leturque. 2008. Sugar absorption in the intestine: The role of GLUT2. Annual Review of Nutrition 28 (1):35–54. doi: 10.1146/annurev.nutr.28.061807.155518.
- Kerimi, A., and G. Williamson. 2018. Differential impact of flavonoids on redox modulation, bioenergetics, and cell signaling in normal and tumor cells: A comprehensive review. Antioxidants & Redox Signaling 29 (16):1633–59. doi: 10.1089/ars.2017.7086.
- Kerimi, A., N. U. Kraut, J. A. da Encarnacao, and G. Williamson. 2020. The gut microbiome drives inter- and intra-individual differences in metabolism of bioactive small molecules. Scientific Reports 10 (1):19590. doi: 10.1038/s41598-020-76558-5.
- Kimira, M., Y. Arai, K. Shimoi, and S. Watanabe. 1998. Japanese intake of flavonoids and isoflavonoids from foods. Journal of Epidemiology 8 (3):168–75. doi: 10.2188/jea.8.168.
- Kottra, G., and H. Daniel. 2007. Flavonoid glycosides are not transported by the human Na+/glucose transporter when expressed in Xenopus laevis oocytes, but effectively inhibit electrogenic glucose uptake. The Journal of Pharmacology and Experimental Therapeutics 322 (2):829–35. doi: 10.1124/jpet.107.124040.
- Kroon, P. A., M. N. Clifford, A. Crozier, A. J. Day, J. L. Donovan, C. Manach, and G. Williamson. 2004. How should we assess the effects of exposure to dietary polyphenols in vitro? The American Journal of Clinical Nutrition 80 (1):15–21. doi: 10.1093/ajcn/80.1.15.
- Krumholz, L. R., and M. P. Bryant. 1986. Eubacterium oxidoreducens sp. nov. requiring H2 or formate to degrade gallate, pyrogallol, phloroglucinol and quercetin. Archives of Microbiology 144 (1):8–14. doi: 10.1007/BF00454948.
- Krumholz, L. R., and M. P. Bryant. 1988. Characterization of the pyrogallol-phloroglucinol isomerase of Eubacterium oxidoreducens. Journal of Bacteriology 170 (6):2472–9. doi: 10.1128/jb.170.6.2472-2479.1988.
- Krumholz, L. R., R. L. Crawford, M. E. Hemling, and M. P. Bryant. 1986. A rumen bacterium degrading quercetin and trihydroxybenzenoids with concurrent use of formate or H2. Progress in Clinical and Biological Research 213:211–4.
- Krumholz, L. R., R. L. Crawford, M. E. Hemling, and M. P. Bryant. 1987. Metabolism of gallate and phloroglucinol in Eubacterium oxidoreducens via 3-hydroxy-5-oxohexanoate. Journal of Bacteriology 169 (5):1886–90. doi: 10.1128/jb.169.5.1886-1890.1987.
- Kyle, J. A., P. C. Morrice, G. McNeill, and G. G. Duthie. 2007. Effects of infusion time and addition of milk on content and absorption of polyphenols from black tea. Journal of Agricultural and Food Chemistry 55 (12):4889–94. doi: 10.1021/jf070351y.
- Labib, S., A. Erb, M. Kraus, T. Wickert, and E. Richling. 2004. The pig caecum model: A suitable tool to study the intestinal metabolism of flavonoids. Molecular Nutrition & Food Research 48 (4):326–32. doi: 10.1002/mnfr.200400022.
- Lamuela-Raventós, R. M., M.-I. Covas, M. Fitó, J. Marrugat, and M. C. de la Torre-Boronat. 1999. Detection of dietary antioxidant phenolic compounds in human LDL. Clinical Chemistry 45 (10):1870–2. doi: 10.1093/clinchem/45.10.1870.
- Le Sayec, M., D. Carregosa, K. Khalifa, C. de Lucia, D. Aarsland, C. N. Santos, and A. Rodriguez-Mateos. 2023. Identification and quantification of (poly)phenol and methylxanthine metabolites in human cerebrospinal fluid: Evidence of their ability to cross the BBB. Food & Function 14 (19):8893–902. doi: 10.1039/D3FO01913F.
- Lee, J., S. E. Ebeler, J. A. Zweigenbaum, and A. E. Mitchell. 2012. UHPLC-(ESI)QTOF MS/MS profiling of quercetin metabolites in human plasma postconsumption of applesauce enriched with apple peel and onion. Journal of Agricultural and Food Chemistry 60 (34):8510–20. doi: 10.1021/jf302637t.
- Lessard-Lord, J., P.-L. Plante, and Y. Desjardins. 2022. Purified recombinant enzymes efficiently hydrolyze conjugated urinary (poly)phenol metabolites. Food & Function 13 (21):10895–911. doi: 10.1039/D2FO02229J.
- Li, C., W.-J. Zhang, J. Choi, and B. Frei. 2016. Quercetin affects glutathione levels and redox ratio in human aortic endothelial cells not through oxidation but formation and cellular export of quercetin-glutathione conjugates and upregulation of glutamate-cysteine ligase. Redox Biology 9:220–8. doi: 10.1016/j.redox.2016.08.012.
- Li, F., X. Y. Sun, X. W. Li, T. Yang, and L. W. Qi. 2017. Enrichment and separation of quercetin-3-O-beta-d-glucuronide from lotus leaves (nelumbo nucifera gaertn.) and evaluation of its anti-inflammatory effect. Journal of Chromatography. B, Analytical Technologies in the Biomedical and Life Sciences 1040:186–91. doi: 10.1016/j.jchromb.2016.12.017.
- Li, Q., Q. Wei, E. Yuan, J. Yang, and Z. Ning. 2014. Interaction between four flavonoids and trypsin: Effect on the characteristics of trypsin and antioxidant activity of flavonoids. International Journal of Food Science & Technology 49 (4):1063–9. doi: 10.1111/ijfs.12401.
- Li, S. Y., J. Liu, Z. Li, L. Q. Wang, W. N. Gao, Z. Q. Zhang, and C. J. Guo. 2020. Sodium-dependent glucose transporter 1 and glucose transporter 2 mediate intestinal transport of quercetrin in Caco-2 cells. Food & Nutrition Research 64 (0):3745–3753. doi: 10.29219/fnr.v64.3745.
- Liao, Y. R., and J. Y. Lin. 2014. Quercetin, but not its metabolite quercetin-3-glucuronide, exerts prophylactic immunostimulatory activity and therapeutic antiinflammatory effects on lipopolysaccharide-treated mouse peritoneal macrophages ex vivo. Journal of Agricultural and Food Chemistry 62 (13):2872–80. doi: 10.1021/jf405630h.
- Lin, C. M., C. S. Chen, C. T. Chen, Y. C. Liang, and J. K. Lin. 2002. Molecular modeling of flavonoids that inhibits xanthine oxidase. Biochemical and Biophysical Research Communications 294 (1):167–72. doi: 10.1016/S0006-291X(02)00442-4.[doi];S0006-291X(02)00442-4 [pii].
- Lodi, F., R. Jimenez, L. Moreno, P. A. Kroon, P. W. Needs, D. A. Hughes, C. Santos-Buelga, A. Gonzalez-Paramas, A. Cogolludo, R. Lopez-Sepulveda, et al. 2009. Glucuronidated and sulfated metabolites of the flavonoid quercetin prevent endothelial dysfunction but lack direct vasorelaxant effects in rat aorta. Atherosclerosis 204 (1):34–9. doi: 10.1016/j.atherosclerosis.2008.08.007.
- Loke, W. M., J. M. Proudfoot, A. J. McKinley, P. W. Needs, P. A. Kroon, J. M. Hodgson, and K. D. Croft. 2008. Quercetin and its in vivo metabolites inhibit neutrophil-mediated low-density lipoprotein oxidation. Journal of Agricultural and Food Chemistry 56 (10):3609–15. doi: 10.1021/jf8003042.
- Loke, W. M., J. M. Proudfoot, S. Stewart, A. J. McKinley, P. W. Needs, P. A. Kroon, J. M. Hodgson, and K. D. Croft. 2008. Metabolic transformation has a profound effect on anti-inflammatory activity of flavonoids such as quercetin: Lack of association between antioxidant and lipoxygenase inhibitory activity. Biochemical Pharmacology 75 (5):1045–53. doi: 10.1016/j.bcp.2007.11.002.
- Lotito, S. B., W. J. Zhang, C. S. Yang, A. Crozier, and B. Frei. 2011. Metabolic conversion of dietary flavonoids alters their anti-inflammatory and antioxidant properties. Free Radical Biology & Medicine 51 (2):454–63. doi: 10.1016/j.freeradbiomed.2011.04.032.
- Lu, Q. Y., L. F. Zhang, G. Eibl, and V. L. W. Go. 2014. Overestimation of flavonoid aglycones as a result of the ex vivo deconjugation of glucuronides by the tissue beta-glucuronidase. Journal of Pharmaceutical and Biomedical Analysis 88:364–9. doi: 10.1016/j.jpba.2013.09.013.
- Macià, A., M.-P. Romero, A. Pedret, R. Solà, M. N. Clifford, and L. Rubió-Piqué. 2023. Assessment of human inter-individual variability of phloretin metabolites in urine after apple consumption. AppleCOR study. Food & Function 14 (23):10387–400. doi: 10.1039/D3FO02985A.
- Macià, A., M.-P. Romero, S. Yuste, I. Ludwig, A. Pedret, R. M. Valls, P. Salamanca, R. Solà, M. José Motilva, and L. Rubió. 2022. Phenol metabolic fingerprint and selection of intake biomarkers after acute and sustained consumption of red-fleshed apple versus common apple in humans. The AppleCOR study. Food Chemistry 384:132612. doi: 10.1016/j.foodchem.2022.132612.
- Makris, D. P., and J. T. Rossiter. 2000. Heat-induced, metal-catalyzed oxidative degradation of quercetin and rutin (quercetin 3-O-rhamnosylglucoside) in aqueous model systems. Journal of Agricultural and Food Chemistry 48 (9):3830–8. doi: 10.1021/jf0001280.
- Makris, D. P., and J. T. Rossiter. 2001. Domestic processing of onion bulbs (Allium cepa) and asparagus spears (Asparagus officinalis): Effect on flavonol content and antioxidant status. Journal of Agricultural and Food Chemistry 49 (7):3216–22. doi: 10.1021/jf001497z.
- Manolescu, A. R., K. Witkowska, A. Kinnaird, T. Cessford, and C. Cheeseman. 2007. Facilitated hexose transporters: New perspectives on form and function. Physiology (Bethesda, Md.) 22 (4):234–40. doi: 10.1152/physiol.00011.2007.
- Martinez-Gonzalez, A. I., E. Alvarez-Parrilla, Á. G. Díaz-Sánchez, L. A. de la Rosa, J. A. Núñez-Gastélum, A. A. Vazquez-Flores, and G. A. Gonzalez-Aguilar. 2017. In vitro inhibition of pancreatic lipase by polyphenols: A kinetic, fluorescence spectroscopy and molecular docking study. Food Technology and Biotechnology 55 (4):519–30. doi: 10.17113/ftb.55.04.17.5138.
- Mathrani, A., W. Yip, I. R. Sequeira-Bisson, D. Barnett, O. Stevenson, M. W. Taylor, and S. D. Poppitt. 2023. Effect of a 12-week polyphenol rutin intervention on markers of pancreatic β-cell function and gut microbiota in adults with overweight without diabetes. Nutrients 15 (15):3360. doi: 10.3390/nu15153360.
- Mauri, P. L., L. Iemoli, C. Gardana, P. Riso, P. Simonetti, M. Porrini, and P. G. Pietta. 1999. Liquid chromatography/electrospray ionization mass spectrometric characterization of flavonol glycosides in tomato extracts and human plasma. Rapid Communications in Mass Spectrometry 13 (10):924–31. doi: 10.1002/(SICI)1097-0231(19990530)13:10<924::AID-RCM588>3.0.CO;2-G.
- McAnlis, G. T., J. McEneny, J. Pearce, and I. S. Young. 1999. Absorption and antioxidant effects of quercetin from onions, in man. European Journal of Clinical Nutrition 53 (2):92–6. doi: 10.1038/sj.ejcn.1600682.
- Mcdonald, M. S., M. Hughes, J. Burns, M. E. J. Lean, D. Matthews, and A. Crozier. 1998. Survey of the free and conjugated myricetin and quercetin content of red wines of different geographical origins. Journal of Agricultural and Food Chemistry 46 (2):368–75. doi: 10.1021/jf970677e.
- Menendez, C., M. Dueñas, P. Galindo, S. González-Manzano, R. Jimenez, L. Moreno, M. J. Zarzuelo, I. Rodríguez-Gómez, J. Duarte, C. Santos-Buelga, et al. 2011. Vascular deconjugation of quercetin glucuronide: The flavonoid paradox revealed? Molecular Nutrition & Food Research 55 (12):1780–90. [doi]. doi: 10.1002/mnfr.201100378.
- Menzies, I. S., M. J. Zuckerman, W. S. Nukajam, S. G. Somasundaram, B. Murphy, A. P. Jenkins, R. S. Crane, and G. G. Gregory. 1999. Geography of intestinal permeability and absorption. Gut 44 (4):483–9. doi: 10.1136/gut.44.4.483.
- Miean, K. H., and S. Mohamed. 2001. Flavonoid (myricetin, quercetin, kaempferol, luteolin, and apigenin) content of edible tropical plants. Journal of Agricultural and Food Chemistry 49 (6):3106–12. doi: 10.1021/jf000892m.
- Mizuma, T., K. Ohta, and S. Awazu. 1994. The beta-anomeric and glucose preferences of glucose transport carrier for intestinal active absorption of monosaccharide conjugates. Biochimica et Biophysica Acta 1200 (2):117–22. doi: 10.1016/0304-4165(94)90125-2.
- Mizuma, T., K. Ohta, M. Hayashi, and S. Awazu. 1993. Comparative study of active absorption by the intestine and disposition of anomers of sugar-conjugated compounds. Biochemical Pharmacology 45 (7):1520–3. doi: 10.1016/0006-2952(93)90053-y.
- Mochizuki, M., K. Kajiya, J. Terao, K. Kaji, S. Kumazawa, T. Nakayama, and K. Shimoi. 2004. Effect of quercetin conjugates on vascular permeability and expression of adhesion molecules. BioFactors (Oxford, England) 22 (1-4):201–4. doi: 10.1002/biof.5520220142.
- Mohos, V., E. Fliszár-Nyúl, O. Ungvári, K. Kuffa, P. W. Needs, P. A. Kroon, Á. Telbisz, C. Özvegy-Laczka, and M. Poór. 2020. Inhibitory effects of quercetin and its main methyl, sulfate, and glucuronic acid conjugates on cytochrome P450 enzymes, and on OATP, BCRP and MRP2 transporters. Nutrients 12 (8):2306. doi: 10.3390/nu12082306.
- Moon, J. H., R. Nakata, S. Oshima, T. Inakuma, and J. Terao. 2000. Accumulation of quercetin conjugates in blood plasma after the short-term ingestion of onion by women. American Journal of Physiology. Regulatory, Integrative and Comparative Physiology 279 (2):R461–R467. doi: 10.1152/ajpregu.2000.279.2.R461.
- Moon, Y. J., L. Wang, R. DiCenzo, and M. E. Morris. 2008. Quercetin pharmacokinetics in humans. Biopharmaceutics & Drug Disposition 29 (4):205–17. doi: 10.1002/bdd.605.
- Morand, C., V. Crespy, C. Manach, C. Besson, C. Demigné, and C. Rémésy. 1998. Plasma metabolites of quercetin and their antioxidant properties. The American Journal of Physiology 275 (1):R212–R219. doi: 10.1152/ajpregu.1998.275.1.R212.
- Mukai, R., K. Kawabata, S. Otsuka, A. Ishisaka, Y. Kawai, Z. S. Ji, H. Tsuboi, and J. Terao. 2012. Effect of quercetin and its glucuronide metabolite upon 6-hydroxydopamine-induced oxidative damage in Neuro-2a cells. Free Radical Research 46 (8):1019–28. doi: 10.3109/10715762.2012.673720.
- Mullen, W. 2009. Investigation of the fate of dietary flavonols in humans and rats using HPLC-MS2 techniques. PhD diss. University of Glasgow.
- Mullen, W., A. Boitier, A. J. Stewart, and A. Crozier. 2004. Flavonoid metabolites in human plasma and urine after the consumption of red onions: Analysis by liquid chromatography with photodiode array and full scan tandem mass spectrometric detection. Journal of Chromatography. A 1058 (1-2):163–8. doi: 10.1016/S0021-9673(04)01476-1.
- Mullen, W., C. A. Edwards, and A. Crozier. 2006. Absorption, excretion and metabolite profiling of methyl-, glucuronyl-, glucosyl- and sulpho-conjugates of quercetin in human plasma and urine after ingestion of onions. The British Journal of Nutrition 96 (1):107–16. doi: 10.1079/bjn20061809.
- Mullen, W., G. Borges, M. E. Lean, S. A. Roberts, and A. Crozier. 2010. Identification of metabolites in human plasma and urine after consumption of a polyphenol-rich juice drink. Journal of Agricultural and Food Chemistry 58 (4):2586–95. doi: 10.1021/jf904096v.
- Munroe, D. G., and P. L. Chang. 1987. Tissue-specific expression of human arylsulfatase-C isozymes and steroid sulfatase. Am J Hum Genet 40 (2):102–14.
- Murakami, A., H. Ashida, and J. Terao. 2008. Multitargeted cancer prevention by quercetin. Cancer Letters 269 (2):315–25. doi: 10.1016/j.canlet.2008.03.046.
- Murota, K., N. Matsuda, Y. Kashino, Y. Fujikura, T. Nakamura, Y. Kato, R. Shimizu, S. Okuyama, H. Tanaka, T. Koda, et al. 2010. Alpha-oligoglucosylation of a sugar moiety enhances the bioavailability of quercetin glucosides in humans. Archives of Biochemistry and Biophysics 501 (1):91–7. doi: 10.1016/j.abb.2010.06.036.
- Nagao, A., M. Seki, and H. Kobayashi. 1999. Inhibition of xanthine oxidase by flavonoids. Bioscience, Biotechnology, and Biochemistry 63 (10):1787–90. doi: 10.1271/bbb.63.1787.
- Nakamura, T., K. Murota, S. Kumamoto, K. Misumi, N. Bando, S. Ikushiro, N. Takahashi, K. Sekido, Y. Kato, and J. Terao. 2014. Plasma metabolites of dietary flavonoids after combination meal consumption with onion and tofu in humans. Molecular Nutrition & Food Research 58 (2):310–7. doi: 10.1002/mnfr.201300234.
- Nalewajko-Sieliwoniuk, E., M. Hryniewicka, D. Jankowska, A. Kojło, M. Kamianowska, and M. Szczepański. 2020. Dispersive liquid-liquid microextraction coupled to liquid chromatography tandem mass spectrometry for the determination of phenolic compounds in human milk. Food Chemistry 327:126996. doi: 10.1016/j.foodchem.2020.126996.
- Németh, K., G. W. Plumb, J.-G. Berrin, N. Juge, R. Jacob, H. Y. Naim, G. Williamson, D. M. Swallow, and P. A. Kroon. 2003. Deglycosylation by small intestinal epithelial cell β-glucosidases is a critical step in the absorption and metabolism of dietary flavonoid glycosides in humans. European Journal of Nutrition 42 (1):29–42. doi: 10.1007/s00394-003-0397-3.
- Nielsen, S. E., V. Breinholt, U. Justesen, C. Cornett, and L. O. Dragsted. 1998. In vitro biotransformation of flavonoids by rat liver microsomes. Xenobiotica; the Fate of Foreign Compounds in Biological Systems 28 (4):389–401. doi: 10.1080/004982598239498.
- Nigam, S. K., K. T. Bush, G. Martovetsky, S. Y. Ahn, H. C. Liu, E. Richard, V. Bhatnagar, and W. Wu. 2015. The organic anion transporter (OAT) family: A systems biology perspective. Physiological Reviews 95 (1):83–123. doi: 10.1152/physrev.00025.2013.
- Nishijima, T., Y. Takida, Y. Saito, T. Ikeda, and K. Iwai. 2015. Simultaneous ingestion of high-methoxy pectin from apple can enhance absorption of quercetin in human subjects. The British Journal of Nutrition 113 (10):1531–8. doi: 10.1017/s0007114515000537.
- Nishikawa, M., Y. Kada, M. Kimata, T. Sakaki, and S. Ikushiro. 2022. Comparison of metabolism and biological properties among positional isomers of quercetin glucuronide in LPS- and RANKL-challenged RAW264.7 cells. Bioscience, Biotechnology, and Biochemistry 86 (12):1670–9. doi: 10.1093/bbb/zbac150.
- Nishimuro, H., H. Ohnishi, M. Sato, M. Ohnishi-Kameyama, I. Matsunaga, S. Naito, K. Ippoushi, H. Oike, T. Nagata, H. Akasaka, et al. 2015. Estimated daily intake and seasonal food sources of quercetin in Japan. Nutrients 7 (4):2345–58. doi: 10.3390/nu7042345.
- Nuka, E., M. Takahashi, M. Okitsu, C. Nayama, H. Nishijima, R. Sogawa, K. Kawabata, J. Terao, and R. Mukai. 2022. Lowering effect of combined sweet potato and onion intake on plasma quercetin concentration and underlying mechanism involving intestinal β-glucosidase activity. Bioscience, Biotechnology, and Biochemistry 86 (12):1695–8. doi: 10.1093/bbb/zbac155.
- Ohara, K., H. Wakabayashi, Y. Taniguchi, K. Shindo, H. Yajima, and A. Yoshida. 2013. Quercetin-3-O-glucuronide induces ABCA1 expression by LXR alpha activation in murine macrophages. Biochemical and Biophysical Research Communications 441 (4):929–34. doi: 10.1016/j.bbrc.2013.10.168.
- Ohnishi, R., H. Ito, N. Kasajima, M. Kaneda, R. Kariyama, H. Kumon, T. Hatano, and T. Yoshida. 2006. Urinary excretion of anthocyanins in humans after cranberry juice ingestion. Bioscience, Biotechnology, and Biochemistry 70 (7):1681–7. doi: 10.1271/bbb.60023.
- Okoko, T., and I. F. Oruambo. 2009. Inhibitory activity of quercetin and its metabolite on lipopolysaccharide-induced activation of macrophage U937 cells. Food and Chemical Toxicology: An International Journal Published for the British Industrial Biological Research Association 47 (4):809–12. doi: 10.1016/j.fct.2009.01.013.
- O’Leary, K. A., A. J. Day, P. W. Needs, F. A. Mellon, N. M. O’Brien, and G. Williamson. 2003. Metabolism of quercetin-7- and quercetin-3-glucuronides by an in vitro hepatic model: The role of human β-glucuronidase, sulfotransferase, catechol-O-methyltransferase and multi-resistant protein 2 (MRP2) in flavonoid metabolism. Biochemical Pharmacology 65 (3):479–91. doi: 10.1016/s0006-2952(02)01510-1.
- O’Leary, K. A., A. J. Day, P. W. Needs, W. S. Sly, N. M. O’Brien, and G. Williamson. 2001. Flavonoid glucuronides are substrates for human liver β-glucuronidase. FEBS Letters 503 (1):103–6. doi: 10.1016/s0014-5793(01)02684-9.
- Omar, K., M. H. Grant, C. Henderson, and D. G. Watson. 2014. The complex degradation and metabolism of quercetin in rat hepatocyte incubations. Xenobiotica; the Fate of Foreign Compounds in Biological Systems 44 (12):1074–82. doi: 10.3109/00498254.2014.932032.
- O’Reilly, J. D., A. I. Mallet, G. T. McAnlis, I. S. Young, B. Halliwell, T. A. Sanders, and H. Wiseman. 2001. Consumption of flavonoids in onions and black tea: Lack of effect on F2-isoprostanes and autoantibodies to oxidized LDL in healthy humans. The American Journal of Clinical Nutrition 73 (6):1040–4. doi: 10.1093/ajcn/73.6.1040.
- Ottaviani, J. I., R. Y. Fong, G. Borges, H. Schroeter, and A. Crozier. 2018. Use of LC-MS for the quantitative analysis of (poly)phenol metabolites does not necessarily yield accurate results: Implications for assessing existing data and conducting future research. Free Radical Biology & Medicine 124:97–103. doi: 10.1016/j.freeradbiomed.2018.05.092.
- Pacifici, G. M. 2005. Pharmacokinetics of antivirals in neonate. Early Human Development 81 (9):773–80. doi: 10.1016/j.earlhumdev.2005.06.001.
- Park, J. Y., M. S. Lim, S. I. Kim, H. J. Lee, S. S. Kim, Y. S. Kwon, and W. Chun. 2016. Quercetin-3-O-beta-D-glucuronide suppresses lipopolysaccharide-induced JNK and ERK phosphorylation in LPS-challenged RAW264.7 cells. Biomolecules & Therapeutics 24 (6):610–5. doi: 10.4062/biomolther.2016.026.
- Park, J.-Y., S.-I. Kim, H. J. Lee, S.-S. Kim, Y.-S. Kwon, and W. Chun. 2016. Isorhamnetin-3-O-glucuronide suppresses JNK and p38 activation and increases heme-oxygenase-1 in lipopolysaccharide-challenged RAW264.7 cells. Drug Development Research 77 (3):143–51. doi: 10.1002/ddr.21301.
- Pei, S., Y. Dou, W. Zhang, D. Qi, Y. Li, M. Wang, W. Li, H. Shi, Z. Gao, C. Yao, et al. 2022. O-Sulfation disposition of curcumin and quercetin in SULT1A3 overexpressing HEK293 cells: The role of arylsulfatase B in cellular O-sulfation regulated by transporters. Food & Function 13 (20):10558–73. doi: 10.1039/d2fo01436j.
- Pereira-Caro, G., S. Cáceres-Jimenez, L. Bresciani, P. Mena, T. M. Almutairi, S. Dobani, L. Kirsty Pourshahidi, C. I. R. Gill, J. M. Moreno Rojas, M. N. Clifford, et al. 2023. Excretion by subjects on a low (poly)phenol diet of phenolic gut microbiota catabolites sequestered in tissues or associated with catecholamines and surplus amino acids. International Journal of Food Sciences and Nutrition 74 (4):532–43. doi: 10.1080/09637486.2023.2226369.
- Perez, A., S. Gonzalez-Manzano, R. Jimenez, R. Perez-Abud, J. M. Haro, A. Osuna, C. Santos-Buelga, J. Duarte, and F. Perez-Vizcaino. 2014. The flavonoid quercetin induces acute vasodilator effects in healthy volunteers: Correlation with beta-glucuronidase activity. Pharmacological Research 89:11–8. doi: 10.1016/j.phrs.2014.07.005.
- Peron, G., S. Sut, A. Pellizzaro, P. Brun, D. Voinovich, I. Castagliuolo, and S. Dall’Acqua. 2017. The antiadhesive activity of cranberry phytocomplex studied by metabolomics: Intestinal PAC-A metabolites but not intact PAC-A are identified as markers in active urines against uropathogenic Escherichia coli. Fitoterapia 122:67–75. doi: 10.1016/j.fitote.2017.08.014.
- Pimpão, R. C., M. R. Ventura, R. B. Ferreira, G. Williamson, and C. N. Santos. 2015. Phenolic sulfates as new and highly abundant metabolites in human plasma after ingestion of a mixed berry fruit puree. The British Journal of Nutrition 113 (3):454–63. doi: 10.1017/S0007114514003511.
- Pratheeshkumar, P., A. Budhraja, Y. O. Son, X. Wang, Z. Zhang, S. Ding, L. Wang, A. Hitron, J. C. Lee, M. Xu, et al. 2012. Quercetin inhibits angiogenesis mediated human prostate tumor growth by targeting VEGFR- 2 regulated AKT/mTOR/P70S6K signaling pathways. PloS One 7 (10):e47516. doi: 10.1371/journal.pone.0047516.
- Ramešová, S., R. Sokolová, I. Degano, J. Bulíčková, J. Zabka, and M. Gál. 2012. On the stability of the bioactive flavonoids quercetin and luteolin under oxygen-free conditions. Analytical and Bioanalytical Chemistry 402 (2):975–82. doi: 10.1007/s00216-011-5504-3.
- Ranka, S., J. M. Gee, L. Biro, G. Brett, S. Saha, P. Kroon, J. Skinner, A. R. Hart, A. Cassidy, M. Rhodes, et al. 2008. Development of a food frequency questionnaire for the assessment of quercetin and naringenin intake. European Journal of Clinical Nutrition 62 (9):1131–8. doi: 10.1038/sj.ejcn.1602827.
- Raza, M. A., and D. Shahwar. 2013. Trypsin inhibitory potential and microbial transformation of rutin isolated from Citrus sinensis. Medicinal Chemistry Research 22 (8):3698–702. doi: 10.1007/s00044-012-0379-1.
- Razmara, R. S., A. Daneshfar, and R. Sahraei. 2010. Solubility of quercetin in water + methanol and water + ethanol from (292.8 to 333.8) K. Journal of Chemical & Engineering Data 55 (9):3934–6. doi: 10.1021/je9010757.
- Riva, A., M. Ronchi, G. Petrangolini, S. Bosisio, and P. Allegrini. 2019. Improved oral absorption of quercetin from quercetin phytosome (R), a new delivery system based on food grade lecithin. European Journal of Drug Metabolism and Pharmacokinetics 44 (2):169–77. doi: 10.1007/s13318-018-0517-3.
- Rodriguez-Mateos, A., R. P. Feliciano, A. Boeres, T. Weber, C. N. dos Santos, M. R. Ventura, and C. Heiss. 2016. Cranberry (poly)phenol metabolites correlate with improvements in vascular function: A double-blind, randomized, controlled, dose-response, crossover study. Molecular Nutrition & Food Research 60 (10):2130–40. doi: 10.1002/mnfr.201600250.
- Rohn, S., N. Buchner, G. Driemel, M. Rauser, and L. W. Kroh. 2007. Thermal degradation of onion quercetin glucosides under roasting conditions. Journal of Agricultural and Food Chemistry 55 (4):1568–73. doi: 10.1021/jf063221i.
- Romaszko, E., W. Wiczkowski, J. Romaszko, J. Honke, and M. K. Piskula. 2014. Exposure of breastfed infants to quercetin after consumption of a single meal rich in quercetin by their mothers. Molecular Nutrition & Food Research 58 (2):221–8. doi: 10.1002/mnfr.201200773.
- Rubió, L., M. P. Romero, R. Solà, M. J. Motilva, M. N. Clifford, and A. Macià. 2021. Variation in the methylation of caffeoylquinic acids and urinary excretion of 3’-methoxycinnamic acid-4’-sulfate after apple consumption by volunteers. Molecular Nutrition & Food Research 65 (19):e2100471. doi: 10.1002/mnfr.202100471.
- Ruotolo, R., L. Calani, F. Brighenti, A. Crozier, S. Ottonello, and D. Del Rio. 2014. Glucuronidation does not suppress the estrogenic activity of quercetin in yeast and human breast cancer cell model systems. Archives of Biochemistry and Biophysics 559:62–7. doi: 10.1016/j.abb.2014.03.003.
- Russell, W. R., S. H. Duncan, L. Scobbie, G. Duncan, L. Cantlay, A. G. Calder, S. E. Anderson, and H. J. Flint. 2013. Major phenylpropanoid-derived metabolites in the human gut can arise from microbial fermentation of protein. Molecular Nutrition & Food Research 57 (3):523–35. doi: 10.1002/mnfr.201200594.
- Saenger, T., F. Hübner, and H.-U. Humpf. 2017. Short-term biomarkers of apple consumption. Molecular Nutrition & Food Research 61 (3):1600629. doi: 10.1002/mnfr.201600629.
- Sato, Y., M. Nagata, K. Tetsuka, K. Tamura, A. Miyashita, A. Kawamura, and T. Usui. 2014. Optimized methods for targeted peptide-based quantification of human uridine 5’-diphosphate-glucuronosyltransferases in biological specimens using liquid chromatography-tandem mass spectrometry. Drug Metabolism and Disposition: The Biological Fate of Chemicals 42 (5):885–9. doi: 10.1124/dmd.113.056291.
- Sawai, Y., K. Kohsaka, Y. Nishiyama, and K. Ando. 1987. Serum concentrations of rutoside metabolites after oral administration of a rutoside formulation to humans. Arzneimittel-Forschung 37:729–32.
- Schneider, H., A. Schwiertz, M. D. Collins, and M. Blaut. 1999. Anaerobic transformation of quercetin-3-glucoside by bacteria from the human intestinal tract. Archives of Microbiology 171 (2):81–91. doi: 10.1007/s002030050682.
- Schulz, H.-U., M. Schürer, D. Bässler, and D. Weiser. 2005. Investigation of the bioavailability of hypericin, pseudohypericin, hyperforin and the flavonoids quercetin and isorhamnetin following single and multiple oral dosing of a hypericum extract containing tablet. Arzneimittel-Forschung 55 (1):15–22. doi: 10.1055/s-0031-1296820.
- Sesink, A. L., K. A. O’Leary, and P. C. Hollman. 2001. Quercetin glucuronides but not glucosides are present in human plasma after consumption of quercetin-3-glucoside or quercetin-4’-glucoside. The Journal of Nutrition 131 (7):1938–41. doi: 10.1093/jn/131.7.1938.
- Shi, Y., and G. Williamson. 2015. Comparison of the urinary excretion of quercetin glycosides from red onion and aglycone from dietary supplements in healthy subjects: A randomized, single-blinded, cross-over study. Food & Function 6 (5):1443–8. doi: 10.1039/c5fo00155b.
- Shi, Y., and G. Williamson. 2016. Quercetin lowers plasma uric acid in pre-hyperuricaemic males: A randomised, double-blinded, placebo-controlled, cross-over trial. The British Journal of Nutrition 115 (5):800–6. doi: 10.1017/S0007114515005310.
- Shimoi, K., I. Tomita, T. Nakayama, and B. T. Zhu. 2004. Differential biological activity of quercetin-3-sulfate in normal and cancerous human breast cells. Cancer Research 64 (7_Supplement):316–
- Si, T. L., Q. Liu, Y. F. Ren, H. Li, X. Y. Xu, E. H. Li, S. Y. Pan, J. L. Zhang, and K. X. Wang. 2016. Enhanced anti-inflammatory effects of DHA and quercetin in lipopolysaccharide-induced RAW264.7 macrophages by inhibiting NF-kappaB and MAPK activation. Molecular Medicine Reports 14 (1):499–508. doi: 10.3892/mmr.2016.5259.
- Simonetti, P., C. Gardana, P. Riso, P. Mauri, P. Pietta, and M. Porrini. 2005. Glycosylated flavonoids from tomato purée are bioavailable in humans. Nutrition Research 25 (8):717–26. doi: 10.1016/j.nutres.2005.05.001.
- Song, B. J., Z. E. Jouni, and M. G. Ferruzzi. 2013. Assessment of phytochemical content in human milk during different stages of lactation. Nutrition (Burbank, Los Angeles County, Calif.) 29 (1):195–202. doi: 10.1016/j.nut.2012.07.015.
- Song, J., O. Kwon, S. Chen, R. Daruwala, P. Eck, J. B. Park, and M. Levine. 2002. Flavonoid inhibition of sodium-dependent Vitamin C transporter 1 (SVCT1) and glucose transporter isoform 2 (GLUT2), intestinal transporters for Vitamin C and glucose. The Journal of Biological Chemistry 277 (18):15252–60. doi: 10.1074/jbc.M110496200.
- Spencer, J. P. E., G. G. C. Kuhnle, R. J. Williams, and C. Rice-Evans. 2003. Intracellular metabolism and bioactivity of quercetin and its in vivo metabolites. The Biochemical Journal 372 (Pt 1):173–81. doi: 10.1042/bj20021972.
- Srinivas, K., J. W. King, L. R. Howard, and J. K. Monrad. 2010. Solubility and solution thermodynamic properties of quercetin and quercetin dihydrate in subcritical water. Journal of Food Engineering 100 (2):208–18. doi: 10.1016/j.jfoodeng.2010.04.001.
- Storhaug, C. L., S. K. Fosse, and L. T. Fadnes. 2017. Country, regional, and global estimates for lactose malabsorption in adults: A systematic review and meta-analysis. The Lancet. Gastroenterology & Hepatology 2 (10):738–46. doi: 10.1016/s2468-1253(17)30154-1.
- Suomela, J. P., M. Ahotupa, B. Yang, T. Vasankari, and H. Kallio. 2006. Absorption of flavonols derived from Sea Buckthorn (Hippophae rhamnoides L.) and their effect on emerging risk factors for cardiovascular disease in humans. Journal of Agricultural and Food Chemistry 54 (19):7364–9. doi: 10.1021/jf061889r.
- Suri, S., M. A. Taylor, A. Verity, S. Tribolo, P. W. Needs, P. A. Kroon, D. A. Hughes, and V. G. Wilson. 2008. A comparative study of the effects of quercetin and its glucuronide and sulfate metabolites on human neutrophil function in vitro. Biochemical Pharmacology 76 (5):645–53. doi: 10.1016/j.bcp.2008.06.010.
- Suri, S., X. H. Liu, S. Rayment, D. A. Hughes, P. A. Kroon, P. W. Needs, M. A. Taylor, S. Tribolo, and V. G. Wilson. 2010. Quercetin and its major metabolites selectively modulate cyclic GMP-dependent relaxations and associated tolerance in pig isolated coronary artery. British Journal of Pharmacology 159 (3):566–75. doi: 10.1111/j.1476-5381.2009.00556.x.
- Tanaka, S., A. Trakooncharoenvit, M. Nishikawa, S. Ikushiro, and H. Hara. 2019. Comprehensive analyses of quercetin conjugates by LC/MS/MS revealed that isorhamnetin-7-O-glucuronide-4’-O-sulfate is a major metabolite in plasma of rats fed with quercetin glucosides. Journal of Agricultural and Food Chemistry 67 (15):4240–9. doi: 10.1021/acs.jafc.8b06929.
- Tanaka, S., A. Trakooncharoenvit, M. Nishikawa, S. Ikushiro, and H. Hara. 2022. Heteroconjugates of quercetin with 4’-O-sulfate selectively accumulate in rat plasma due to limited urinary excretion. Food & Function 13 (3):1459–71. doi: 10.1039/d1fo03478b.
- Tang, J., P. Diao, X. Shu, L. Li, and L. Xiong. 2019. Quercetin and quercitrin attenuates the inflammatory response and oxidative stress in LPS-induced RAW264.7 cells: In vitro assessment and a theoretical model. BioMed Research International 2019:7039802–8. doi: 10.1155/2019/7039802.
- Tribolo, S., F. Lodi, C. Connor, S. Suri, V. G. Wilson, M. A. Taylor, P. W. Needs, P. A. Kroon, and D. A. Hughes. 2008. Comparative effects of quercetin and its predominant human metabolites on adhesion molecule expression in activated human vascular endothelial cells. Atherosclerosis 197 (1):50–6. doi: 10.1016/j.atherosclerosis.2007.07.040.
- Tribolo, S., F. Lodi, M. S. Winterbone, S. Saha, P. W. Needs, D. A. Hughes, and P. A. Kroon. 2013. Human metabolic transformation of quercetin blocks its capacity to decrease endothelial nitric oxide synthase (eNOS) expression and endothelin-1 secretion by human endothelial cells. Journal of Agricultural and Food Chemistry 61 (36):8589–96. doi: 10.1021/jf402511c.
- Tsai, C. F., G. W. Chen, Y. C. Chen, C. K. Shen, D. Y. Lu, L. Y. Yang, J. H. Chen, and W. L. Yeh. 2021. Regulatory effects of quercetin on M1/M2 macrophage polarization and oxidative/antioxidative balance. Nutrients 14 (1):67. doi: 10.3390/nu14010067.
- Tsiara, I., A. Riemer, M. S. P. Correia, A. Rodriguez-Mateos, and D. Globisch. 2023. Immobilized enzymes on magnetic beads for separate mass spectrometric investigation of human phase II metabolite classes. Analytical Chemistry 95 (33):12565–71. doi: 10.1021/acs.anachem.3c02988.
- Tumova, S., A. Kerimi, and G. Williamson. 2019. Long term treatment with quercetin in contrast to the sulfate and glucuronide conjugates affects HIF1 alpha stability and Nrf2 signaling in endothelial cells and leads to changes in glucose metabolism. Free Radical Biology & Medicine 137:158–68. doi: 10.1016/j.freeradbiomed.2019.04.023.
- Ulbrich, K., N. Reichardt, A. Braune, L. W. Kroh, M. Blaut, and S. Rohn. 2015. The microbial degradation of onion flavonol glucosides and their roasting products by the human gut bacteria Eubacterium ramulus and Flavonifractor plautii. Food Research International 67:349–55. doi: 10.1016/j.foodres.2014.11.051.
- Vafeiadou, K., D. Vauzour, A. Rodriguez-Mateos, M. Whiteman, R. J. Williams, and J. P. E. Spencer. 2008. Glial metabolism of quercetin reduces its neurotoxic potential. Archives of Biochemistry and Biophysics 478 (2):195–200. doi: 10.1016/j.abb.2008.07.014.
- van der Woude, H., G. M. Alink, B. E. J. van Rossum, K. Walle, H. van Steeg, T. Walle, and I. Rietjens. 2005. Formation of transient covalent protein and DNA adducts by quercetin in cells with and without oxidative enzyme activity. Chemical Research in Toxicology 18 (12):1907–16. doi: 10.1021/tx050201m.
- van der Woude, H., M. G. Boersma, J. Vervoort, and I. M. C. M. Rietjens. 2004. Identification of 14 quercetin phase II mono- and mixed conjugates and their formation by rat and human phase II in vitro model systems. Chemical Research in Toxicology 17 (11):1520–30. doi: 10.1021/tx049826v.
- van Zanden, J. J., O. Ben Hamman, M. L. van Iersel, S. Boeren, N. H. Cnubben, M. L. Bello, J. Vervoort, P. J. van Bladeren, and I. M. Rietjens. 2003. Inhibition of human glutathione S-transferase P1-1 by the flavonoid quercetin. Chemico-Biological Interactions 145 (2):139–48. doi: 10.1016/s0009-2797(02)00250-8.
- Vrhovsek, U., D. Masuero, L. Palmieri, and F. Mattivi. 2012. Identification and quantification of flavonol glycosides in cultivated blueberry cultivars. Journal of Food Composition and Analysis 25 (1):9–16. doi: 10.1016/j.jfca.2011.04.015.
- Vvedenskaya, I. O., R. T. Rosen, J. E. Guido, D. J. Russell, K. A. Mills, and N. Vorsa. 2004. Characterization of Flavonols in Cranberry (Vaccinium macrocarpon) Powder. Journal of Agricultural and Food Chemistry 52 (2):188–95. doi: 10.1021/jf034970s.
- Walgren, R. A., J. T. Lin, R. K. Kinne, and T. Walle. 2000. Cellular uptake of dietary flavonoid quercetin 4’-β-glucoside by sodium-dependent glucose transporter SGLT1. J. Pharmacol. Exp. Ther. 294:837–43.
- Walgren, R. A., K. J. Karnaky, Jr., G. E. Lindenmayer, and T. Walle. 2000. Efflux of dietary flavonoid quercetin 4’-β-glucoside across human intestinal Caco-2 cell monolayers by apical multidrug resistance- associated protein-2. The Journal of Pharmacology and Experimental Therapeutics 294 (3):830–6.
- Walle, T., T. S. Vincent, and U. K. Walle. 2003. Evidence of covalent binding of the dietary flavonoid quercetin to DNA and protein in human intestinal and hepatic cells. Biochemical Pharmacology 65 (10):1603–10. doi: 10.1016/s0006-2952(03)00151-5.
- Walle, T., U. K. Walle, and P. V. Halushka. 2001. Carbon dioxide is the major metabolite of quercetin in humans. The Journal of Nutrition 131 (10):2648–52. doi: 10.1093/jn/131.10.2648.
- Wang, L. L., Z. C. Zhang, W. Hassan, Y. Li, J. Liu, and J. Shang. 2016. Amelioration of free fatty acid-induced fatty liver by quercetin-3-O-beta-D-glucuronide through modulation of peroxisome proliferator-activated receptor-alpha/sterol regulatory element-binding protein-1c signaling. Hepatology Research: The Official Journal of the Japan Society of Hepatology 46 (2):225–38. doi: 10.1111/hepr.12557.
- Wang, Y., A. P. Singh, H. N. Nelson, A. J. Kaiser, N. C. Reker, T. L. Hooks, T. Wilson, and N. Vorsa. 2016. Urinary clearance of cranberry flavonol glycosides in humans. Journal of Agricultural and Food Chemistry 64 (42):7931–9. doi: 10.1021/acs.jafc.6b03611.
- Wiczkowski, W., E. Romaszko, and M. K. Piskula. 2010. Bioavailability of cyanidin glycosides from natural chokeberry (Aronia melanocarpa) juice with dietary-relevant dose of anthocyanins in humans. Journal of Agricultural and Food Chemistry 58 (23):12130–6. doi: 10.1021/jf102979z.
- Wiczkowski, W., J. Romaszko, A. Bucinski, D. Szawara-Nowak, J. Honke, H. Zielinski, and M. K. Piskula. 2008. Quercetin from shallots (Allium cepa L. var. aggregatum) is more bioavailable than its glucosides. The Journal of Nutrition 138 (5):885–8. doi: 10.1093/jn/138.5.885.
- Williamson, G. 2013. Possible effects of dietary polyphenols on sugar absorption and digestion. Molecular Nutrition & Food Research 57 (1):48–57. doi: 10.1002/mnfr.201200511.
- Williamson, G., and M. N. Clifford. 2017. Role of the small intestine, colon and microbiota in determining the metabolic fate of polyphenols. Biochemical Pharmacology 139:24–39. doi: 10.1016/j.bcp.2017.03.012.
- Williamson, G., C. D. Kay, and A. Crozier. 2018. The bioavailability, transport, and bioactivity of dietary flavonoids: A review from a historical perspective. Comprehensive Reviews in Food Science and Food Safety 17 (5):1054–112. doi: 10.1111/1541-4337.12351.
- Williamson, G., D. Barron, K. Shimoi, and J. Terao. 2005. In vitro biological properties of flavonoid conjugates found in vivo. Free Radical Research 39 (5):457–69. doi: 10.1080/10715760500053610.
- Williamson, G., I. Aeberli, L. Miguet, Z. Zhang, M. B. Sanchez, V. Crespy, D. Barron, P. Needs, P. A. Kroon, H. Glavinas, et al. 2007. Interaction of positional isomers of quercetin glucuronides with the transporter ABCC2 (cMOAT, MRP2). Drug Metabolism and Disposition: The Biological Fate of Chemicals 35 (8):1262–8. doi: 10.1124/dmd.106.014241.
- Winter, J., L. H. Moore, V. R. Dowell, and V. D. Bokkenheuser. 1989. C-ring cleavage of flavonoids by human intestinal bacteria. Applied and Environmental Microbiology 55 (5):1203–8. doi: 10.1128/aem.55.5.1203-1208.1989.
- Winterbone, M. S., S. Tribolo, P. W. Needs, P. A. Kroon, and D. A. Hughes. 2009. Physiologically relevant metabolites of quercetin have no effect on adhesion molecule or chemokine expression in human vascular smooth muscle cells. Atherosclerosis 202 (2):431–8. doi: 10.1016/j.atherosclerosis.2008.04.040.
- Wong, C. C., N. P. Botting, C. Orfila, N. Al-Maharik, and G. Williamson. 2011. Flavonoid conjugates interact with organic anion transporters (OATs) and attenuate cytotoxicity of adefovir mediated by organic anion transporter 1 (OAT1/SLC22A6). Biochemical Pharmacology 81 (7):942–9. doi: 10.1016/j.bcp.2011.01.004.
- Wong, C. C., Y. Akiyama, T. Abe, J. D. Lippiat, C. Orfila, and G. Williamson. 2012. Carrier-mediated transport of quercetin conjugates: Involvement of organic anion transporters and organic anion transporting polypeptides. Biochemical Pharmacology 84 (4):564–70. doi: 10.1016/j.bcp.2012.05.011.
- Wright, B., L. A. Moraes, C. F. Kemp, W. Mullen, A. Crozier, J. A. Lovegrove, and J. M. Gibbins. 2010. A structural basis for the inhibition of collagen-stimulated platelet function by quercetin and structurally related flavonoids. British Journal of Pharmacology 159 (6):1312–25. doi: 10.1111/j.1476-5381.2009.00632.x.
- Wu, Q., P. A. Kroon, H. Shao, P. W. Needs, and X. Yang. 2018. Differential effects of quercetin and two of its derivatives, isorhamnetin and isorhamnetin-3-glucuronide, in inhibiting the proliferation of human breast-cancer MCF-7 cells. Journal of Agricultural and Food Chemistry 66 (27):7181–9. doi: 10.1021/acs.jafc.8b02420.
- Wu, Q., P. W. Needs, Y. Lu, P. A. Kroon, D. Ren, and X. Yang. 2018. Different antitumor effects of quercetin, quercetin-3’-sulfate and quercetin-3-glucuronide in human breast cancer MCF-7 cells. Food & Function 9 (3):1736–46. doi: 10.1039/c7fo01964e.
- Xu, M., H. Huang, X. Mo, Y. Zhu, X. Chen, X. Li, X. Peng, Z. Xu, L. Chen, S. Rong, et al. 2021. Quercetin-3-O-glucuronide alleviates cognitive deficit and toxicity in A beta(1-42)-induced AD-like mice and SH-SY5Y cells. Molecular Nutrition & Food Research 65 (6):e2000660. doi: 10.1002/mnfr.202000660.
- Xu, Y., Y. Li, X. Ma, W. Alotaibi, M. Le Sayec, A. Cheok, E. Wood, S. Hein, P. Young Tie Yang, W. L. Hall, et al. 2023. Comparison between dietary assessment methods and biomarkers in estimating dietary (poly)phenol intake. Food & Function 14 (3):1369–86. doi: 10.1039/d2fo02755k.
- Yamazaki, S., H. Sakakibara, H. Takemura, M. Yasuda, and K. Shimoi. 2014. Quercetin-3-O-glucuronide inhibits noradrenaline binding to α2-adrenergic receptor, thus suppressing DNA damage induced by treatment with 4-hydroxyestradiol and noradrenaline in MCF-10A cells. The Journal of Steroid Biochemistry and Molecular Biology 143:122–9. doi: 10.1016/j.jsbmb.2014.02.014.
- Yamazaki, S., N. Miyoshi, K. Kawabata, M. Yasuda, and K. Shimoi. 2014. Quercetin-3-O-glucuronide inhibits noradrenaline-promoted invasion of MDA-MB-231 human breast cancer cells by blocking beta(2)-adrenergic signaling. Archives of Biochemistry and Biophysics 557:18–27. doi: 10.1016/j.abb.2014.05.030.
- Yang, H. H., K. Hwangbo, M. S. Zheng, J. H. Cho, J. K. Son, H. Y. Kim, S. H. Baek, H. C. Choi, S. Y. Park, and J. R. Kim. 2014. Quercetin-3-O-beta-D-glucuronide isolated from polygonum aviculare inhibits cellular senescence in human primary cells. Archives of Pharmacal Research 37 (9):1219–33. doi: 10.1007/s12272-014-0344-2.
- Yang, Q. Q., Z. R. Wang, X. H. Chen, Z. H. Guo, L. Y. Wen, and J. Q. Kan. 2022. Evaluation of bitter compounds in Zanthoxylum schinifolium Sieb. et Zucc. by instrumental and sensory analyses. Food Chemistry 390:133180. doi: 10.1016/j.foodchem.2022.133180.
- Yao, Z., Y. Gu, Q. Zhang, L. Liu, G. Meng, H. Wu, Y. Xia, X. Bao, H. Shi, S. Sun, et al. 2019. Estimated daily quercetin intake and association with the prevalence of type 2 diabetes mellitus in Chinese adults. European Journal of Nutrition 58 (2):819–30. doi: 10.1007/s00394-018-1713-2.
- Yokoyama, A., H. Sakakibara, A. Crozier, Y. Kawai, A. Matsui, J. Terao, S. Kumazawa, and K. Shimoi. 2009. Quercetin metabolites and protection against peroxynitrite-induced oxidative hepatic injury in rats. Free Radical Research 43:913–921.
- Young, J. F., S. E. Nielsen, J. Haraldsdóttir, B. Daneshvar, S. T. Lauridsen, P. Knuthsen, A. Crozier, B. Sandström, and L. O. Dragsted. 1999. Effect of fruit juice intake on urinary quercetin excretion and biomarkers of antioxidative status. The American Journal of Clinical Nutrition 69 (1):87–94. doi: 10.1093/ajcn/69.1.87.
- Yuste, S., I. A. Ludwig, L. Rubió, M.-P. Romero, A. Pedret, R.-M. Valls, R. Solà, M.-J. Motilva, and A. Macià. 2019. In vivo biotransformation of (poly)phenols and anthocyanins of red-fleshed apple and identification of intake biomarkers. Journal of Functional Foods 55:146–55. doi: 10.1016/j.jff.2019.02.013.
- Zenkevich, I. G., and T. I. Pushkareva. 2017. Systematization of the results of the chromatography–mass spectrometry identification of the products of quercetin oxidation by atmospheric oxygen in aqueous solutions. Journal of Analytical Chemistry 72 (10):1061–75. doi: 10.1134/S1061934817080147.
- Zhou, J.-F., W.-J. Wang, Z.-P. Yin, G.-D. Zheng, J.-G. Chen, J.-E. Li, L.-L. Chen, and Q.-F. Zhang. 2021. Quercetin is a promising pancreatic lipase inhibitor in reducing fat absorption in vivo. Food Bioscience 43:101248. doi: 10.1016/j.fbio.2021.101248.