
Abstract
With the rising prevalence of obesity globally, increasing proportions of the population may not be covered by current recommended daily allowances (RDAs) that are supposed to provide 97.5% of the population with a sufficient nutrient status but are typically based on a healthy young 70 kg male reference person. Using the EPIC-Norfolk (UK) and the NHANES (US) cohorts, we estimated the effect of body weight on the dose-concentration relationship to derive weight-based requirements to achieve an ‘adequate’ plasma concentration of vitamin C estimated to be 50 µmol/L. Inverse correlations between body weight and vitamin C were observed in both cohorts (p < 0.0001). Moreover, only about 2/3 of the cohorts achieved an adequate plasma vitamin C status by consuming the RDA or above, while only 1/3 to 1/2 of the cohorts achieved adequacy by an intake of the local RDA ± 10%. Using vitamin C as an example, the present data demonstrate that a considerable and expectedly increasing proportion of the world population is unable to achieve an adequate target plasma concentration with the current recommended daily intakes of vitamin C. This needs to be considered in future public health recommendations.
SIGNIFICANCE STATEMENT
In this paper, we highlight the inverse association between body weight and vitamin C status. Our study strongly suggests that a large proportion of the population is not covered by the current recommended intakes of vitamin C.
Introduction
Vitamin C is essential for human wellbeing. While originally thought to be of interest only in the prevention of scurvy, i.e., the mortal manifestation of long-term severe vitamin C deficiency, more and more health authorities are starting to consider the increasingly compelling evidence that adequate vitamin C status may play an important role in the risk reduction of much more common diseases such as cardiovascular disease and cancer (Myint et al. Citation2008, Khaw et al. Citation2001, Simon, Hudes, and Tice Citation2001, Simon, Hudes, and Browner Citation1998, Loria et al. Citation2000, Aune et al. Citation2018). Thus, over the past several decades, recommended daily intakes of dietary vitamin C have gradually increased in a number of countries during the renewal of nutrition recommendations (Carr and Lykkesfeldt Citation2021). In the US, the recommendation for vitamin C intake was last increased with the guideline from the Institute of Medicine (Citation2000), and although the proportion of US adults with vitamin C intakes below the EAR has increased since then (Sun et al. Citation2022), overall vitamin C status has not changed significantly between the NHANES 2003–2006 and 2017–2018 surveys (Powers et al. Citation2023).
Simultaneously, there is a growing interest in the factors affecting vitamin C status. We recently examined a series of lifestyle and demographic factors for their impact on vitamin C status in non-hospitalized individuals and reported that body weight seems to be one of the most important factors determining the dose to concentration relationship in the general population (Carr and Lykkesfeldt Citation2023a, Citation2023b, Carr, Block, and Lykkesfeldt Citation2022). Most guidelines on dietary recommendations are based on healthy, relatively young men weighing about 70 kg. At the same time, the overarching purpose of setting dietary guidelines such as the RDA/RDI/DRI/RNI/RI (Recommended Dietary Allowance/Recommended Dietary Intake/Dietary Reference Intake/Reference Nutrient Intake/Recommended Intake) is to define the average daily dietary intake level that is sufficient to meet the nutrient requirements of nearly all healthy individuals in a particular subpopulation or in the population as a whole (Carr and Lykkesfeldt Citation2021). This number is achieved by estimating the average requirement (EAR) and then adding two times the expected standard deviation to this number, usually set arbitrarily to 10% (2000, Blomhoff et al. Citation2023, EFSA Panel on Dietetic Products, Nutrition and Allergies 2013, D-A-CH (Deutsche Gesellschaft für Ernährung et al. 2013). From the empirical rule, this should constitute an intake that can be expected to provide an adequate nutrient supply for about 97.5% of the population.
However, there are two major problems associated with this approach. First, the EAR should represent the average requirement of the population. However, the true average requirement is extremely difficult if not impossible to assess as no well-validated functional assays of vitamin C requirement exists. Instead, target values based on indirect evidence such as surrogate biological markers or epidemiological evidence are used that may not represent the true EAR. Furthermore, the standard deviation of the EAR is not based on population derived data but rather arbitrarily set to 10%. In reality, the standard deviation of the EAR may be much larger than 10%. Thus, both the EAR and its standard deviation—i.e., the two numbers used to calculate the RDA—may be seriously flawed. Second, the alarming trend of an increasing prevalence of obesity among both children and adults in many countries—often referred to as the obesity pandemic (The Lancet Gastroenterology, Hepatology 2021, Flegal et al. Citation2010)—has so far not been taken into account by the various national and international authorities despite appearing to have a major influence on vitamin C requirement both on the individual and population level (Block et al. Citation1999, Ford et al. Citation2003).
The concept of weight influence in nutritional recommendations is already well known: all authorities that have published separate vitamin C recommendations for men and women have used the difference in mean weight between men and women as the basis for extrapolating their recommendation for women from that of men (2000, Blomhoff et al. Citation2023, D-A-CH (Deutsche Gesellschaft für Ernährung et al. 2013, EFSA Panel on Dietetic Products, Nutrition and Allergies 2013). Likewise, recommendations for children at various ages are almost always extrapolated from an average body weight within a certain age-span relative to the before mentioned healthy young 70 kg man (2000, Blomhoff et al. Citation2023, D-A-CH (Deutsche Gesellschaft für Ernährung et al. 2013, EFSA Panel on Dietetic Products, Nutrition and Allergies 2013), thereby acknowledging the relationship between weight and vitamin C requirements. Regardless, with the global increase in body weight, a substantial and growing proportion of the population may not be covered by the recommended nutrient intakes. In other words, a vitamin C recommendation based on the indirectly estimated requirement of a healthy young 70 kg man and an arbitrarily set standard deviation of 10% used in the calculation of the RDA may no longer be a sufficient reference in the pursuit of dietary guidelines supposed to cover 97.5% of the population.
In the present study, we investigated vitamin C as an example of how increased body weight may impact nutritional sufficiency based on the relationship between dietary intake and plasma concentration. We interrogated two of the largest and most well-documented cohorts—the EPIC-Norfolk cohort from the UK and the NHANES cohort covering the USA—in order to estimate the effect of body weight on the vitamin C dose vs concentration relationship and to derive weight-based requirements to achieve an ‘adequate’ plasma concentration of vitamin C estimated to be 50 µmol/L by several authorities (EFSA Panel on Dietetic Products, Nutrition and Allergies 2013, Blomhoff et al. Citation2023, D-A-CH (Deutsche Gesellschaft für Ernährung et al. 2013).
Methods
EPIC-Norfolk cohort
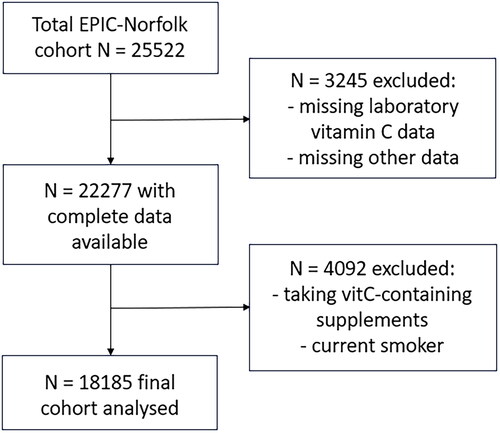
This study included data from the EPIC-Norfolk cohort, which recruited participants from the city of Norwich in the UK and surrounding small towns and rural areas, the population comprising primarily British Caucasians. In this cohort, men and women aged between 40 and 79 years were identified from 35 collaborating general practice registers from Norfolk and were invited by mail to participate in the baseline survey. Participants attended baseline health checks between 1993–1997 and were assessed using health checks and questionnaires; 25522 people provided consent to participate in the study during this time period. Our study included 18185 participants who had vitamin C laboratory values available and after excluding those who were taking vitamin C supplements and current smokers (). Ethical approval was obtained from the UK Norwich Research Ethics Committee (approval code: 98NC01). The detailed baseline description of the study cohort has been published elsewhere (Day et al. Citation1999).
Figure 1. Participant eligibility for the final EPIC-Norfolk cohort.
Variables
Socio-demographic, economic, and lifestyle variables including anthropometric measurements and biochemical parameters were used in the analysis. Age, sex, smoking status (current, former, never) and vitamin C supplement usage were recorded as reported by the participants and cross-checked with the documentary evidence. Weight was measured when wearing light clothing without shoes and after voiding urine according to a standard protocol. Height was measured to the nearest 0.1 cm using a stadiometer with shoes removed according to a standard protocol. BMI was calculated as weight (kg)/height (m)2.
Assessment of vitamin C levels and intake
Plasma vitamin C concentrations were obtained from non-fasting venous blood samples at the health check between 1993–1997. Plasma vitamin C was measured from blood collected into citrate tubes. After overnight storage in a dark box at 4–7 °C, blood samples were centrifuged and plasma was stabilized in a standardized volume of metaphosphoric acid and stored at −70 °C. Vitamin C concentrations were estimated using a fluorometric assay within one week of sampling (Riemersma et al. Citation1990).
Dietary vitamin C intake was derived from 7-day food diary at the first health check. Food intake was assessed using pre-structured 7-day diet diaries (Lentjes et al. Citation2014, McKeown et al. Citation2001). Portion sizes were estimated by participants who made use of household measures, manufacturers’ information or a series of color photographs provided in the 7-day diary booklet. Using specifically created DINER (Data Into Nutrients for Epidemiological Research) software, data from diaries were coded and entered by trained nutritionists using a standard validated procedure (Welch et al. Citation2001).
NHANES cohort
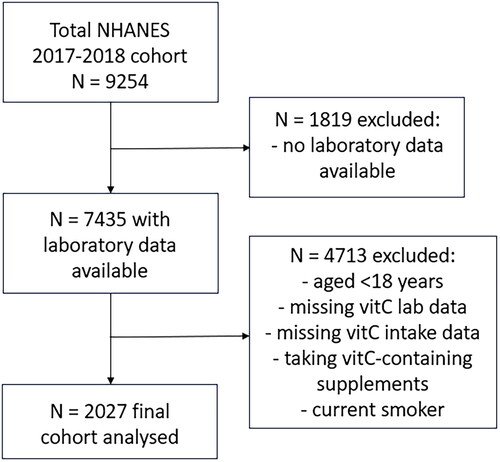
NHANES 2017/2018 data was extracted from the Centers for Disease Control and Prevention’s National Center for Health Statistics site: https://www.cdc.gov/nchs/nhanes/index.htm, as described previously (Carr and Lykkesfeldt Citation2023a). Briefly, the final cohort (n = 2027; ) comprised male and female participants aged 18 years or older, who had vitamin C laboratory variables and had completed two 24-h dietary recalls, were not consuming vitamin C containing supplements and who were nonsmokers (those who answered yes to ‘smoked in last 5 days’ or currently smoke ‘every day’ or ‘some days’ were excluded). The demographic and anthropometric variables collected included: age (years), sex, smoking status (current, former, never), weight (kg) and BMI (kg/m2). Non-fasting serum vitamin C (µmol/L) was measured using HPLC with electrochemical detection (Pirkle Citation2020), and dietary vitamin C intake (mg/d) was derived from the mean of two 24-h dietary recalls using the What We Eat In America Questionnaire and the USDA Food and Nutrient Database for Dietary Studies 2.0 (FNDDS 2.0).
Figure 2. Participant eligibility for the final NHANES 2017–2018 cohort.
Data analyses
Median and interquartile range (Q1, Q3) were used for continuous variables and counts with percentages were used for categorical variables. Group differences were assessed using non-parametric Mann–Whitney U tests or Kruskal–Wallis tests with Dunn’s post-hoc test to correct for multiple comparisons. A p value of < 0.05 signified statistical significance. Linear correlations were determined using Pearson coefficient. Sigmoidal (four parameter logistic) curves with asymmetrical 95% confidence intervals were fitted to dose-concentration data to estimate the vitamin C intakes required to reach ‘adequate’ serum vitamin C concentrations of 50 µmol/L and maximal serum concentrations attained at steady-state intakes of 200 mg/d. To estimate intake differences and relative requirements, the difference between the upper 95% CI of the lower requirement curve was subtracted from the lower 95% CI of the higher requirement curve at their intercepts with the adequate concentration line of 50 µmol/L. Data analyses and graphical presentations were carried out using GraphPad Prism 9 (GraphPad, San Diego, CA, USA).
Results
Characteristics of the EPIC and NHANES cohorts
The characteristics of the EPIC cohort (n = 18185) are outlined in . Although current smokers have been removed from the cohort, it still comprises about 50% of former smokers. Since the samples and data from the EPIC-Norfolk cohort were collected more than 25 years ago (1993–1997), and demographics and health parameters have changed over this time, we also assessed a more recent cohort, the US NHANES 2017/2018 cohort (characteristics in ). The major differences between the two cohorts are the significantly smaller size of the NHANES cohort (n = 2027) and the type of the dietary survey used; seven-day food diary for EPIC and two 24-h dietary recalls for NHANES. Comparison of the two cohorts showed that the NHANES participants were significantly younger (˗10 years), heavier (+7 kg), and had lower vitamin C intake (˗20 mg/d) and serum concentrations (˗9 µmol/L) than the EPIC cohort (p < 0.0001 for all).
Table 1. Characteristics of the EPIC and NHANES cohorts.
Stratifying the EPIC cohort by gender indicated that males were heavier (+14 kg), had a higher former smoking prevalence (+26%), and had lower vitamin C intake (˗6 mg/d) and plasma concentrations (˗11 µmol/L) than females (p < 0.05; ). Similarly, in the NHANES cohort, males were heavier (+11 kg) and had a higher former smoking prevalence (+16%), but despite having a higher vitamin C intake than females (+6 mg/d), also had a lower serum vitamin C status (˗8 µmol/L; p < 0.05; ).
Relationship of body weight with vitamin C intake and status
The correlations between body weight and vitamin C intake and status are depicted in . In the EPIC cohort, body weight showed no significant relationship with the dietary intake of vitamin C (slope = −0.039, r = 0.010, p = 0.18; ). Despite this, correlation of weight with the plasma vitamin C status of the total cohort showed a strong inverse association with increasing body weight (slope = −0.35; r = −0.25; p < 0.0001; ). At the median (IQR) intake of 79 (54, 115) mg/d, only people who weighed 83 (82, 84) kg or less would be estimated to reach an ‘adequate’ plasma vitamin C concentration of 50 µmol/L. Every 10 kg of weight gain would be expected to be associated with a decrease of 3.5 µmol/L plasma vitamin C concentration. Since people with low vitamin C intake may have low plasma vitamin C status, regardless of their body weight, we stratified the cohort by intake tertiles () and compared the slopes of the lower, medium and higher intake tertiles (). As anticipated, the lower intake tertile had a lower slope and correlation coefficient (slope = −0.31; r = −0.22) than the higher intake tertile (slope = −0.38; r = −0.31). The medium intake tertile had an intermediary slope of −0.35 and correlation coefficient of r = −0.28. The slopes of the low versus high intake regression lines were significantly different (p < 0.005). The difference between the slopes of the lower vs medium and medium vs higher intake tertiles did not reach statistical significance (p > 0.05).
Figure 3. Correlations of weight with vitamin C intake and status in the EPIC and NHANES cohorts. (a) Intake data from EPIC cohort (green line; n = 18185; slope = -0.04) and NHANES cohort (blue line; n = 2027; slope = 0.14). (b) Plasma/serum data from EPIC cohort (green line; n = 18185; slope -0.35) and NHANES cohort (blue line; n = 2027; slope = -0.26). (c) EPIC data from high intake tertile (green line; n = 6056; slope = -0.38), medium intake tertile (orange line; n = 6071; slope = -0.35) and low intake tertile (red line; n = 6058; slope = -0.31). The slopes of the high and low intake tertiles were significantly different (p = 0.005). (d) NHANES data from higher intake category (green line; n = 675; slope = -0.27) and lower intake category (red line; n = 676; slope = -0.22). The slopes were not statistically different (p = 0.2). Lines indicate Pearson linear correlation with 95% confidence intervals indicated by dotted lines. An ‘adequate’ vitamin C concentration of 50 µmol/L is indicated by the horizontal dashed line.
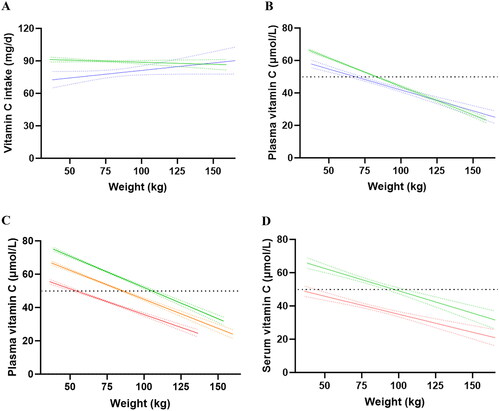
Table 2. Characteristics of vitamin C intake categories in the EPIC and NHANES cohorts.
In the NHANES cohort, weight was also not correlated with vitamin C intake (slope = 0.14, r = 0.022, p = 0.3; ), but did, like the EPIC cohort, reveal an inverse association with serum vitamin C concentrations (; slope = −0.26; r = −0.24; p < 0.0001). At the median intake of 59 (27, 106) mg/d (i.e., 25% lower than the EPIC cohort), only people weighing 68 (64, 73) kg or less would be estimated to reach the ‘adequate’ plasma vitamin C concentration of 50 µmol/L. Every 10 kg of weight gain would be associated with a decrease of 2.6 µmol/L serum vitamin C. Due to the smaller cohort size of the NHANES, only the slopes of the lower and upper 50 percentile intakes were compared (, ). As seen for the EPIC cohort, the lower intake category had a lower slope and correlation coefficient (slope = −0.22; r = −0.22) than the higher intake category (slope = −0.27; r = −0.25) but this difference did not reach statistical significance (p > 0.05).
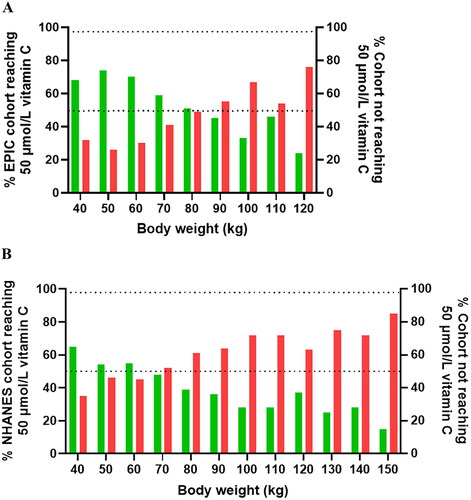
shows the proportion of the population reaching adequate vitamin C concentrations from their recorded intake stratified by weight categories. Overall, in the EPIC cohort, the proportion of participants who reached adequate vitamin C concentrations (i.e., 50 µmol/L) on their usual dietary intake was 60% (n = 10983). The weight at which at least 50% of the participants reached adequate vitamin C concentrations (i.e., 50 µmol/L) on their usual dietary intake was <90 kg (); this declined to <25% at weights of 120+ kg. In the NHANES cohort, the proportion of participants who reached adequate vitamin C concentrations was only 43% (n = 873). The weight corresponding to at least 50% of participants reaching adequate vitamin C status was <70 kg (), but this declined to a mere 15% at weights of 150+ kg.
Figure 4. Proportion of participants reaching (green bars)/not reaching (red bars) adequate vitamin C status at different weights in the EPIC (a) and NHANES (b) cohorts. The mean (SD) weight and vitamin C intake for the EPIC cohort was 73 (64, 82) kg and 79 (54, 115) mg/d; and for the NHANES cohort was 80 (69, 96) kg and 59 (27, 106) mg/d. Upper dashed line indicates 97.5% and middle dashed line indicates 50% of the participants.
Impact of weight on vitamin C requirements
The association between vitamin C intake and concentration is outlined in . The total EPIC cohort required an average vitamin C intake of 62 (61, 63) mg/d to reach adequate plasma concentrations of 50 µmol/L (). The ‘steady state’ vitamin C concentration reached at an intake of 200 mg/d was 65 (64, 65) µmol/L. When the cohort was stratified into weight tertiles (), and intake vs concentration plotted, the heavier weight tertile (i.e., 86 [82, 92] kg) required a vitamin C intake of 84 (82, 88) mg/d relative to the lighter weight tertile (i.e., 61 [59, 63] kg), which required only 47 (45, 49) mg/d of vitamin C in order to reach 50 µmol/L circulating vitamin C concentrations (). This corresponded to a 1.7-fold higher requirement for vitamin C for the heavier compared to lighter weight tertile. The medium weight tertile (73 [70, 76] kg) required a comparable intake to the total cohort, i.e., 61 (59, 63) mg/d, to reach ‘adequate’ circulating concentrations of the vitamin. The data in also indicated that even at relatively high dietary intakes of 200+ mg/d, the heavier and medium weight tertiles were unable to reach the same steady state circulating concentrations as the lighter weight tertile, i.e., 60 (58, 61) μmol/L versus 65 (64, 66) μmol/L versus 71 (70, 72) μmol/L for the heavier, medium and lighter weight tertiles, respectively. To calculate the amount of vitamin C required per 10 kg weight gain, the differences in 95% CIs between the lighter and heavier tertiles for intake (Δ31 mg) and weight (Δ18 kg) were determined, resulting in an approximated additional intake requirement for vitamin C of 17 mg for every 10 kg weight gain.
Figure 5. Vitamin C dietary intake versus plasma concentration curves in the EPIC cohort. (a) Intake versus concentration curve for total EPIC cohort (n = 18185). (b) Intake versus concentration curves for lighter weight tertile (green line; n = 6028), medium weight tertile (orange line; n = 6090) and heavier weight tertile (red line; n = 6067). (c) intake versus concentration curves for females (lighter weight tertile; green; n = 3287 vs heavier weight tertile; red; n = 3295) and (d) males (lighter weight tertile; green; n = 2812 vs heavier weight tertile; red; n = 2848). Sigmoidal (four parameter logistic) curves with asymmetrical 95% confidence intervals were fitted to dose-concentration data to estimate the vitamin C intakes required to reach ‘adequate’ serum vitamin C concentrations of 50 μmol/L (dashed line).
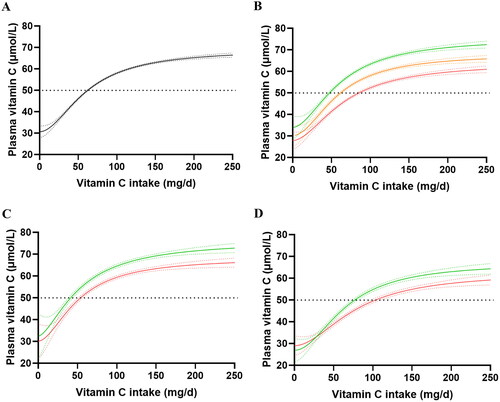
Table 3. Characteristics of weight tertiles in the EPIC and NHANES cohorts.
To compensate for the gender disparity in the weight tertiles, the data was stratified by gender and intake versus concentration curves were fitted to the lighter and heavier weight tertiles of each gender (). Comparable trends to that of the total cohort were observed; the lighter females (i.e., 58 [55, 60) kg) reached 50 μmol/L at intakes of 41 (38, 44) mg/d, whereas the heavier females (i.e., 78 [74, 85] kg) required intakes of 53 (51, 56) mg/d to reach adequate circulating concentrations of the vitamin. Similarly, the lighter males (i.e., 70 [67, 73) kg) reached 50 μmol/L at intakes of 76 (74, 79) mg/d, whereas the heavier males (i.e., 91 [87, 96] kg) required intakes of 103 (98, 109) mg/d to reach adequate circulating concentrations of the vitamin. Furthermore, at vitamin C intakes of 200 mg/d, the lighter female tertile reached steady state concentrations of 71 (70, 73) μmol/L versus 65 (64, 67) μmol/L for the heavier females. Similarly, the lighter male tertile reached steady state concentrations of 63 (61, 65) μmol/L versus 58 (56, 59) μmol/L for the heavier males at intakes of 200 mg/d. The NHANES cohort showed comparable vitamin C dose-concentration relationships to the EPIC cohort (Supplemental Materials Figure S1).
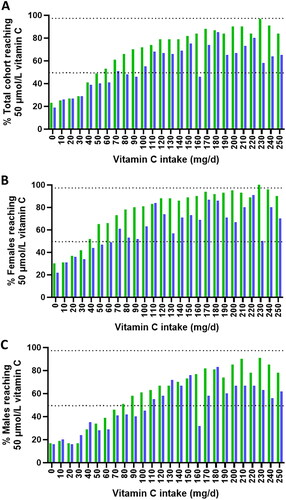
displays the proportions of participants in the EPIC and NHANES cohorts reaching adequate vitamin C status based on intake categories for the whole cohorts and stratified by gender. Collectively, the figures clearly show that intakes up to several fold the respective UK or US RDA are required for 97.5% of the population to reach the target plasma concentration of 50 µmol/L.
Figure 6. Proportion of participants in the EPIC and NHANES cohorts reaching adequate vitamin C concentrations at different dietary intake categories. The mean (SD) intake for the (a) total EPIC cohort (green bars) was 89 (50) mg/d and total NHANES cohort (blue bars) was 79 (77) mg/d, (b) EPIC females was 92 (50) mg/d and NHANES females was 74 (66) mg/d, (c) EPIC males was 88 (51) mg/d and NHANES males was 85 (87) mg/d. Upper dashed line indicates 97.5% and middle dashed line indicates 50% of the participants.
shows the proportion of the EPIC or NHANES cohorts achieving adequate vitamin C status from an intake corresponding to the UK or US RDA of 40 and 75/90 mg/d, respectively, as well as from an intake at or above these values. Indeed, only about one third of the participants in the EPIC cohort ingesting the UK RDA ± 10% (i.e., 40 ± 4 mg) reached a plasma concentration of 50 µmol/L while a mere 50% of the NHANES participants ingesting the US RDA ± 10% (i.e., 75 ± 7.5 mg for women and 90 ± 9 mg for men) reached adequate vitamin C levels. When accumulating all participants ingesting above the RDA, only about two thirds of the participants reached adequate vitamin C status in both cohorts.
Table 4. Proportion of nonsmoking men and women of the EPIC-Norfolk and NHANES 2017–2018 cohorts reaching ‘adequate’ plasma concentration of 50 µmol/L based on the ingestion of the RDA from UK (40 mg/d) or USA (75/90 mg/d for women, men).
Discussion
In the present study, we used the EPIC-Norfolk and NHANES cohorts to estimate the effect of body weight on vitamin C status and requirement in healthy individuals. Both cohorts showed highly significant inverse correlations between body weight and vitamin C status despite no significant relationship between body weight and vitamin C intake in either cohort. When stratifying the cohorts based on intake, it became clear that a stronger inverse association between vitamin C plasma concentration and weight was observed among those with higher compared to lower dietary intakes of vitamin C. We interpret this as the result of the nonlinear pharmacokinetics of vitamin C that results in a more efficient intestinal absorption and renal reabsorption of vitamin C at lower compared to higher intakes (Lykkesfeldt Citation2020, Lykkesfeldt and Tveden-Nyborg Citation2019). Thus, at lower intakes, the relatively higher intestinal absorption and renal reabsorption may to some extent ‘counteract’ the effect of dilution induced by increased weight. At higher intakes, where the active retainment of vitamin C is much less pronounced due to saturation, the relationship with weight becomes stronger and more negative due to volumetric dilution and perhaps also other obesity-related factors.
Higher body weight has previously be shown to negatively impact vitamin C status and several cross sectional population studies have reported an inverse correlation between body weight and plasma ascorbate concentrations (Tveden-Nyborg and Lykkesfeldt Citation2013, Carr and Rowe Citation2020). Of the several factors that may contribute to this relationship, the increased volume of distribution, which from a purely volumetric perspective results in a lower plasma concentration from the same intake, appears to be the most important factor. As mentioned earlier, weight is used as the sole means of calculating the lower recommended daily intake for women compared to men used in some countries including the US (Carr and Lykkesfeldt Citation2021). However, other factors particularly related to obesity may further affect the dose vs concentration relationship. For example, obesity has been associated with adipocyte dysregulation and systemic low-grade inflammation, which can increase oxidative stress and potentially result in an increased turnover of vitamin C (Fernández-Sánchez et al. Citation2011, Codoñer-Franch et al. Citation2011, Carr, Block, and Lykkesfeldt Citation2022). Also, increased prevalence of co-morbidities among people with obesity may contribute, for instance the higher risk of type 2 diabetes and nonalcoholic fatty liver disease, both of which are themselves associated with lower vitamin C status (Sinclair et al. Citation1991, Juhl, Lauszus, and Lykkesfeldt Citation2016, Tveden-Nyborg and Lykkesfeldt Citation2013, Carr et al. Citation2023). In fact, the EPIC cohort has shown a significant increase in type 2 diabetes risk in individuals with a low vitamin C status (Harding et al. Citation2008).
The inverse correlation between body weight and vitamin C status does not per se entail a higher vitamin C requirement with increased body weight. However, several indirect indicators point toward an increased requirement with higher weight. Looking at symptoms such as increased infection risk, poor wound healing, risk of depression and fatigue—all conditions of which have been associated with vitamin C deficiency (2000, EFSA Panel on Dietetic Products, Nutrition and Allergies 2013, Lykkesfeldt and Carr Citation2023)—show an increased prevalence with increased weight (Zhou et al. Citation2020, Phung et al. Citation2013, Dobner and Kaser Citation2018, Yang et al. Citation2021). Although many other factors obviously influence the risk of these conditions, such relationships indirectly support the notion that increased weight does result in an increased vitamin C requirement.
To determine an appropriate target value for adequate vitamin C status, functional assays are needed. However, as such assays are not available, other means have been used to approximate a reasonable target value. In this study, we adopted 50 µmol/L as the target value for an adequate vitamin C status based on a number of arguments. In brief, meta-analyses suggest that about 50 µmol/L is required to achieve a mean risk reduction of 30% in morbidity and mortality from chronic disease (Lykkesfeldt and Carr Citation2023). Moreover, experiments with radiolabeled vitamin C have shown that the intake necessary to maintain a plasma concentration of 50 µmol/L is required to replace the metabolic turnover of vitamin C (Kallner, Hartmann, and Hornig Citation1979). Also, pharmacokinetic data have suggested that 50 µmol/L is necessary to saturate immune cells and muscle tissue (Levine et al. Citation2001, Carr et al. Citation2013). More recently, experimental studies have revealed that the urinary threshold is about 50 µmol/L for vitamin C in healthy individuals (Ebenuwa et al. Citation2022). Finally, several authorities have arrived at the same target value following comprehensive background studies (Blomhoff et al. Citation2023, D-A-CH (Deutsche Gesellschaft für Ernährung et al. 2013, EFSA Panel on Dietetic Products, Nutrition and Allergies 2013).
Using this target value, we evaluated the proportion of weight categories in 10 kg increments achieving an adequate blood level of vitamin C and found for the EPIC cohort that at those weighing 50 kg had the highest probability of reaching adequate status (about 75%), while for those weighing 90 kg or more, less than 50% were able to achieve adequate status. For the NHANES cohort, the ‘optimal’ weight was 40 kg with a 65% probability of achieving adequate status based on the recorded intake, while from 70 kg and up, less than 50% were able to achieve adequate status based on their intake. These data strongly suggest that the ability to achieve adequate vitamin C status is severely impacted by higher body weight and discloses a major problem with the current recommendations, in particular for individuals living with higher weight. Looking specifically at higher weight women and lower weight men with comparable weights, a gender effect was still visible. Even though the effect of gender on vitamin C status has been shown to be primarily driven by the difference in weight between men and women, this may suggest that gender per se also has an independent effect on vitamin C status. Alternatively, it could also reflect a higher proportion of former smokers among males in the cohorts who may have a higher prevalence of chronic smoking-related health conditions, gender differences in dietary intake reporting (McKenzie et al. Citation2021, Macdiarmid and Blundell Citation1998), or gender differences between the amount and distribution of adipose tissue and its effect on inflammation (Bjorntorp Citation1996, Kawai, Autieri, and Scalia Citation2021).
When modeling the vitamin C status vs intake relationships, the expected sigmoidal saturation curves were found. The EPIC cohort plots confirmed the well-established saturation level estimate of about 70 µmol/L in healthy individuals (Levine et al. Citation1996, Lykkesfeldt et al. Citation1997) but also revealed a significant negative influence of weight, both on the intake necessary to achieve adequate status and on the maximum plasma status attained at an intake of 200 mg/d. The tendency was similar in the NHANES cohort but with the much lower number of participants, the 95% CIs were much larger, albeit still significantly different in most comparisons.
The negative correlation between plasma vitamin C status and body weight was previously observed in a small cohort three decades ago as a major determinant of plasma vitamin C concentration (Sinha, Block, and Taylor Citation1992). A similar conclusion was reached in a depletion/repletion study conducted in 68 individuals (Block et al. Citation1999). We recently reexamined those data and were able to estimate the required vitamin C intake based on weight (Carr, Block, and Lykkesfeldt Citation2022). The study suggested that an additional intake of 10 mg vitamin C/day is required for every 10 kg increase in body weight to attain a comparable plasma concentration to a 60 kg individual, with a reference vitamin C intake of ∼110 mg/day as recommended by several European authorities (Blomhoff et al. Citation2023, D-A-CH (Deutsche Gesellschaft für Ernährung et al. 2013, EFSA Panel on Dietetic Products, Nutrition and Allergies 2013). In the present interrogation of ‘real world’ data from the EPIC-Norfolk and NHANES studies, the corresponding estimates show that 17 mg and 22 mg additional vitamin C per day, respectively, is required per 10 kg additional body weight to reach adequate levels as compared to a 70 kg individual.
Looking in more detail at the intake necessary to achieve adequate plasma/serum vitamin C status, our data suggest that the current RDAs are severely underestimated, considering the goal of sufficiency for the vast majority of the population. The current recommended intake in the UK is 40 mg/d and constitutes the lowest recommendation in the World (Values, Department of Health Panel on Dietary Reference Citation1991). It is similar to the 45 mg/d recommended by the World Health Organization, Australia and New Zealand (Nations World Health Organization and Food and Agriculture Organization of the United 2004, Council and National Health and Medical Research Citation2006). These recommendations are primarily based on scurvy prevention (Carr and Lykkesfeldt Citation2021). However, based on the data from the EPIC Norfolk cohort representing the UK population, only 34% of those consuming the RDA were able to achieve adequate plasma vitamin C status. The number for the US population was 50% based on their approximately twice as high recommendation of 75 mg/d for women and 90 mg/d for men. In the EPIC cohort, an intake of 60 mg/d was necessary for 50% of the cohort to achieve adequate status, while 100 mg/d was necessary for the NHANES cohort, most likely reflecting their higher average body weight.
The RDA is typically calculated from the EAR, whereby the RDA equals 1.2 x EAR assuming a 10% standard deviation on the average requirement (2000, Carr and Lykkesfeldt Citation2021). Based on the present evaluation of the EPIC-Norfolk data, however, and assuming that adequacy can be represented by a plasma concentration of 50 µmol/L as discussed above, the standard deviation on the average requirement necessary to achieve this value (± 10%) was actually 45 mg/d (corresponding to 57%; n = 4288) suggesting that an RDA based on this approach could be calculated as 85 mg/d + 2 × 45 mg/d = 175 mg/d. The 85 mg/d has been derived from as the average intake necessary for 50% of the EPIC cohort males to reach 50 µmol/L. The corresponding EAR derived from the NHANES cohort was 115 mg/d. A different approach to encompass the large effect of body weight on requirements would of course be to introduce a weight-based recommendation system. In the recently published Nordic Nutrition Recommendations 2023, the committee abstained from introducing such a weight-based recommendation, although highlighting the issue using vitamin C as an example, due to the likely implications for many other micronutrients (Blomhoff et al. Citation2023).
The present study has some limitations. The data collection of the EPIC-Norfolk cohort occurred 25 years ago and may to some extent not represent the present demography or dietary/lifestyle habits of the UK population. The NHANES 2017–2018 cohort is quite recent but much smaller as reflected by the larger 95% confidence intervals. The cohorts differ significantly in number of participants, age, weight, former smokers, body weight, BMI, vitamin C intake and status. Despite these differences, however, the weight-based trends between the two cohorts were comparable. Both surveys used dietary recall diaries/questionnaires for the estimation of vitamin C intake. Dietary intake estimations based on memory are inherently imprecise due to human recall error, and also because they do not take vitamin C loss into account during e.g., food storage and by various food preparation techniques (Henríquez-Sánchez et al. Citation2009, Frei, Birlouez-Aragon, and Lykkesfeldt Citation2012, Lykkesfeldt Citation2020). As such, these data are much less reliable than plasma concentrations for estimating the vitamin C status of the individual, but for the present purpose of modeling dose vs concentration relationships, they constitute the best available data. Moreover, it should be noted that the established dose vs concentration curves closely match those identified under highly controlled experimental conditions (Levine et al. Citation1996, Levine et al. Citation2001), supporting their suitability for the present evaluation despite that some degree of selective intake reporting (as could also be over reporting of F&V intake) cannot be excluded. Although active smokers were excluded from the present analysis, a substantial proportion of the remaining cohorts were in fact former smokers, and this may have impacted the results to suggest a higher vitamin C requirement. Former smokers may be affected by smoking-related health conditions that impact their vitamin C status negatively. Moreover, it is well known that the lower vitamin C status of smokers is only partially related to the inhalation of smoke but also that smokers—and former smokers—have poorer diets compared to nonsmokers with regard to intake of fruits and vegetables (Lykkesfeldt et al. Citation1996, Lykkesfeldt et al. Citation2000, Morabia and Wynder Citation1990, Larkin et al. Citation1990, Zondervan et al. Citation1996). This could potentially result in a lower average intake. Finally, the study used a plasma/serum concentration of 50 µmol/L as a surrogate for adequate vitamin C status and although substantiated by multiple studies and authorities, it may not accurately reflect adequacy. However as long as proper functional assays or validated biological signatures reflecting adequate vitamin C requirements are not available, we believe that the presented value constitutes the best available estimation.
In conclusion, we demonstrate that only about two thirds of the EPIC-Norfolk and NHANES 2017–2018 cohorts achieved an ‘adequate’ vitamin C status by consuming the RDA or above, while only between one third and half of the cohorts achieved adequacy by an intake of the RDA ± 10%. The problems encountered in reaching adequate vitamin C status is significantly related to increased body weight, where individuals living with higher weight need substantially higher intakes to achieved plasma concentrations similar to those required for a young male reference individual of 70 kg. These results should be taken into account when revising public health nutrient recommendations in the future.
Author contributions
JL, ACC and PKM conceived and designed the research, ACC and JL analyzed the data, ACC and JL wrote the paper; PKM, SCV, AMJ, JC edited the paper. JL and ACC have primary responsibility for final content. All authors read and approved the final manuscript.
| Abbreviations | ||
| RDA | = | Recommended Dietary Allowance |
| RDI | = | Recommended Dietary Intake |
| DRI | = | Dietary Reference Intake |
| RNI | = | Reference Nutrient Intake |
| RI | = | Recommended Intake |
| EAR | = | Estimated Average Requirement |
Supplemental Material
Download PDF (327.5 KB)Acknowledgements
We would like to acknowledge the principal investigators and staff of the EPIC-Norfolk study. We are grateful to all the participants who have been part of the project and to the many members of the study teams at the University of Cambridge who have enabled this research.
Disclosure statement
No potential conflict of interest was reported by the author(s).
Data availability statement
NHANES 2017–2018 data are publicly available at https://www.cdc.gov/nchs/nhanes/index.htm.
EPIC-Norfolk data are available by request through https://www.epic-norfolk.org.uk/forresearchers/data-sharing/data-requests
Additional information
Funding
References
- Aune, D., N. Keum, E. Giovannucci, L. T. Fadnes, P. Boffetta, D. C. Greenwood, S. Tonstad, L. J. Vatten, E. Riboli, and T. Norat. 2018. Dietary intake and blood concentrations of antioxidants and the risk of cardiovascular disease, total cancer, and all-cause mortality: A systematic review and dose-response meta-analysis of prospective studies. The American Journal of Clinical Nutrition 108 (5):1069–91. doi: 10.1093/ajcn/nqy097.
- Bjorntorp, P. 1996. The regulation of adipose tissue distribution in humans. International Journal of Obesity and Related Metabolic Disorder 20 (4):291–302.
- Block, G., A. R. Mangels, B. H. Patterson, O. A. Levander, E. P. Norkus, and P. R. Taylor. 1999. Body weight and prior depletion affect plasma ascorbate levels attained on identical vitamin C intake: A controlled-diet study. Journal of the American College of Nutrition 18 (6):628–37. doi: 10.1080/07315724.1999.10718898.
- Blomhoff, R., R. Andersen, E. K. Arnesen, J. J. Christensen, H. Eneroth, M. Erkkola, I. Gudanaviciene, T. I. Halldorsson, A. Høyer-Lund, E. W. Lemming, et al. 2023. Nordic nutrition recommendations 2023. Copenhagen: Nordic Council of Ministers.
- Carr, A. C., G. Block, and J. Lykkesfeldt. 2022. Estimation of Vitamin C intake requirements based on body weight: Implications for obesity. Nutrients 14 (7):1460. doi: 10.3390/nu14071460.
- Carr, A. C., H. Lunt, N. J. Wareham, and P. K. Myint. 2023. Estimating Vitamin C Intake Requirements in Diabetes Mellitus: Analysis of NHANES 2017-2018 and EPIC-Norfolk Cohorts. Antioxidants (Basel) 12 (10):1863. doi: 10.3390/antiox12101863.
- Carr, A. C., and J. Lykkesfeldt. 2021. Discrepancies in global vitamin C recommendations: A review of RDA criteria and underlying health perspectives. Critical Reviews in Food Science and Nutrition 61 (5):742–55. doi: 10.1080/10408398.2020.1744513.
- Carr, A. C., S. M. Bozonet, J. M. Pullar, J. W. Simcock, and M. C. Vissers. 2013. Human skeletal muscle ascorbate is highly responsive to changes in vitamin C intake and plasma concentrations. The American Journal of Clinical Nutrition 97 (4):800–7. doi: 10.3945/ajcn.112.053207.
- Carr, A. C., and J. Lykkesfeldt. 2023a. Does aging affect vitamin C status relative to intake? Findings from NHANES 2017-2018. Nutrients 15 (4):892. doi: 10.3390/nu15040892.
- Carr, A. C., and J. Lykkesfeldt. 2023b. Factors affecting the vitamin C dose-concentration relationship: Implications for global vitamin C dietary recommendations. Nutrients 15 (7):1657. doi: 10.3390/nu15071657.
- Carr, A. C., and S. Rowe. 2020. Factors affecting vitamin C status and prevalence of deficiency: A global health perspective. Nutrients 12 (7):1963. doi: 10.3390/nu12071963.
- Codoñer-Franch, P., V. Valls-Bellés, A. Arilla-Codoñer, and E. Alonso-Iglesias. 2011. Oxidant mechanisms in childhood obesity: The link between inflammation and oxidative stress. Translational Research: The Journal of Laboratory and Clinical Medicine 158 (6):369–84. doi: 10.1016/j.trsl.2011.08.004.
- Council, National Health and Medical Research. 2006. Nutrient reference values for Australia and New Zealand: Executive summary. Edited by Department of Health and Ageing. Canberra: National Health and Medical Research Council.
- D-A-CH (Deutsche Gesellschaft für Ernährung, Österreichische Gesellschaft für Ernährung, Schweizerische Vereinigung für Schweizerische Gesellschaft für Ernährungsforschung, and Ernährung). 2013. Referenzwerte für die Nährstoffzufuhr. Frankfurt/Main, Germany: Neuer Umschau Buchverlag.
- Day, N., S. Oakes, R. Luben, K. T. Khaw, S. Bingham, A. Welch, and N. Wareham. 1999. EPIC-Norfolk: Study design and characteristics of the cohort. European Prospective Investigation of Cancer. British Journal of Cancer. 80 (Suppl. 1):95–103.
- Dobner, J., and S. Kaser. 2018. Body mass index and the risk of infection - From underweight to obesity. Clinical Microbiology and Infection: The Official Publication of the European Society of Clinical Microbiology and Infectious Diseases 24 (1):24–8. doi: 10.1016/j.cmi.2017.02.013.
- Ebenuwa, I., P. C. Violet, S. Padayatty, Y. Wang, Y. Wang, H. Sun, P. Adhikari, S. Smith, H. Tu, M. Niyyati, et al. 2022. Abnormal urinary loss of vitamin C in diabetes: Prevalence and clinical characteristics of a vitamin C renal leak. The American Journal of Clinical Nutrition 116 (1):274–84. doi: 10.1093/ajcn/nqac063.
- EFSA Panel on Dietetic Products, Nutrition and Allergies. 2013. Scientific opinion on dietary reference values for vitamin C. EFSA Journal 11: 1–68.
- Fernández-Sánchez, A., E. Madrigal-Santillán, M. Bautista, J. Esquivel-Soto, A. Morales-González, C. Esquivel-Chirino, I. Durante-Montiel, G. Sánchez-Rivera, C. Valadez-Vega, and J. A. Morales-González. 2011. Inflammation, oxidative stress, and obesity. International Journal of Molecular Sciences 12 (5):3117–32. doi: 10.3390/ijms12053117.
- Flegal, K. M., M. D. Carroll, C. L. Ogden, and L. R. Curtin. 2010. Prevalence and trends in obesity among US adults, 1999-2008. Jama 303 (3):235–41. doi: 10.1001/jama.2009.2014.
- Ford, E. S., A. H. Mokdad, W. H. Giles, and D. W. Brown. 2003. The metabolic syndrome and antioxidant concentrations: Findings from the Third National Health and Nutrition Examination Survey. Diabetes 52 (9):2346–52. doi: 10.2337/diabetes.52.9.2346.
- Frei, B., I. Birlouez-Aragon, and J. Lykkesfeldt. 2012. Authors’ perspective: What is the optimum intake of vitamin C in humans? Critical Reviews in Food Science and Nutrition 52 (9):815–29. doi: 10.1080/10408398.2011.649149.
- Harding, A. H., N. J. Wareham, S. A. Bingham, K. Khaw, R. Luben, A. Welch, and N. G. Forouhi. 2008. Plasma vitamin C level, fruit and vegetable consumption, and the risk of new-onset type 2 diabetes mellitus: The European prospective investigation of cancer–Norfolk prospective study. Archives of Internal Medicine 168 (14):1493–9. doi: 10.1001/archinte.168.14.1493.
- Henríquez-Sánchez, P., A. Sánchez-Villegas, J. Doreste-Alonso, A. Ortiz-Andrellucchi, K. Pfrimer, and L. Serra-Majem. 2009. Dietary assessment methods for micronutrient intake: A systematic review on vitamins. The British Journal of Nutrition 102 (Suppl, 1):S10–S37. doi: 10.1017/S0007114509993126.
- Institute of Medicine. 2000. Dietary reference intakes for vitamin C, vitamin E, selenium and carotenoids: A report of the Panel on Dietary Antioxidants and Related Compounds, Subcommitties on Upper Reference Levels of Nutrients and of the Interpretation and Use of Dietary Reference Intakes, and the Standing Committee on the Scientific Evaluation of Dietary Reference Intakes, Food and Nutrition Board, Institute of Medicine, National Academy of Sciences. Washington D.C.: National Academy Press. Reprint, NOT IN FILE.
- Juhl, B., F. F. Lauszus, and J. Lykkesfeldt. 2016. Is diabetes associated with lower vitamin C status in pregnant women? A prospective study. International Journal for Vitamin and Nutrition Research. Internationale Zeitschrift Fur Vitamin- Und Ernahrungsforschung. Journal International de Vitaminologie et de Nutrition 86 (3-4):184–9. doi: 10.1024/0300-9831/a000407.
- Kallner, A., D. Hartmann, and D. Hornig. 1979. Steady-state turnover and body pool of ascorbic acid in man. The American Journal of Clinical Nutrition 32 (3):530–9. doi: 10.1093/ajcn/32.3.530.
- Kawai, T., M. V. Autieri, and R. Scalia. 2021. Adipose tissue inflammation and metabolic dysfunction in obesity. American Journal of Physiology. Cell Physiology 320 (3):C375–C391. doi: 10.1152/ajpcell.00379.2020.
- Khaw, K. T., S. Bingham, A. Welch, R. Luben, N. Wareham, S. Oakes, and N. Day. 2001. Relation between plasma ascorbic acid and mortality in men and women in EPIC-Norfolk prospective study: A prospective population study. European Prospective Investigation into Cancer and Nutrition. Lancet (London, England) 357 (9257):657–63.
- Larkin, F. A., P. P. Basiotis, H. A. Riddick, K. E. Sykes, and E. M. Pao. 1990. Dietary patterns of women smokers and non-smokers. Journal of the American Dietetic Association 90 (2):230–5. doi: 10.1016/S0002-8223(21)01499-1.
- Lentjes, M. A., A. McTaggart, A. A. Mulligan, N. A. Powell, D. Parry-Smith, R. N. Luben, A. Bhaniani, A. A. Welch, and K. T. Khaw. 2014. Dietary intake measurement using 7 d diet diaries in British men and women in the European Prospective Investigation into Cancer-Norfolk study: A focus on methodological issues. The British Journal of Nutrition 111 (3):516–26. doi: 10.1017/S0007114513002754.
- Levine, M., C. Conry-Cantilena, Y. Wang, R. W. Welch, P. W. Washko, K. R. Dhariwal, J. B. Park, A. Lazarev, J. F. Graumlich, J. King, et al. 1996. Vitamin C pharmacokinetics in healthy volunteers: Evidence for a recommended dietary allowance. Proceedings of the National Academy of Sciences of the United States of America 93 (8):3704–9. doi: 10.1073/pnas.93.8.3704.
- Levine, M., Y. Wang, S. J. Padayatty, and J. Morrow. 2001. A new recommended dietary allowance of vitamin C for healthy young women. Proceedings of the National Academy of Sciences of the United States of America 98 (17):9842–6. doi: 10.1073/pnas.171318198.
- Loria, C. M., M. J. Klag, L. E. Caulfield, and P. K. Whelton. 2000. Vitamin C status and mortality in US adults. The American Journal of Clinical Nutrition 72 (1):139–45. doi: 10.1093/ajcn/72.1.139.
- Lykkesfeldt, J. 2020. On the effect of vitamin C intake on human health: How to (mis)interprete the clinical evidence. Redox Biology 34:101532. doi: 10.1016/j.redox.2020.101532.
- Lykkesfeldt, J., and A. C. Carr. 2023. Vitamin C - A scoping review for Nordic Nutrition Recommendations 2023. Food & Nutrition Research 67: 1–19. doi: 10.29219/fnr.v67.10300.
- Lykkesfeldt, J., S. Christen, L. M. Wallock, H. H. Chang, R. A. Jacob, and B. N. Ames. 2000. Ascorbate is depleted by smoking and repleted by moderate supplementation: A study in male smokers and nonsmokers with matched dietary antioxidant intakes. The American Journal of Clinical Nutrition 71 (2):530–6. doi: 10.1093/ajcn/71.2.530.
- Lykkesfeldt, J., S. Loft, J. B. Nielsen, and H. E. Poulsen. 1997. Ascorbic acid and dehydroascorbic acid as biomarkers of oxidative stress caused by smoking. The American Journal of Clinical Nutrition 65 (4):959–63. doi: 10.1093/ajcn/65.4.959.
- Lykkesfeldt, J., H. Priemé, S. Loft, and H. E. Poulsen. 1996. Effect of smoking cessation on plasma ascorbic acid concentration. BMJ (Clinical Research ed.) 313 (7049):91– doi: 10.1136/bmj.313.7049.91.
- Lykkesfeldt, J., and P. Tveden-Nyborg. 2019. The pharmacokinetics of Vitamin C. Nutrients 11 (10):2412. doi: 10.3390/nu11102412.
- Macdiarmid, J., and J. Blundell. 1998. Assessing dietary intake: Who, what and why of under-reporting. Nutrition Research Reviews 11 (2):231–53. doi: 10.1079/NRR19980017.
- McKenzie, B. L., D. H. Coyle, J. A. Santos, T. Burrows, E. Rosewarne, S. A. E. Peters, C. Carcel, L. M. Jaacks, R. Norton, C. E. Collins, et al. 2021. Investigating sex differences in the accuracy of dietary assessment methods to measure energy intake in adults: A systematic review and meta-analysis. The American Journal of Clinical Nutrition 113 (5):1241–55. doi: 10.1093/ajcn/nqaa370.
- McKeown, N. M., N. E. Day, A. A. Welch, S. A. Runswick, R. N. Luben, A. A. Mulligan, A. McTaggart, and S. A. Bingham. 2001. Use of biological markers to validate self-reported dietary intake in a random sample of the European Prospective Investigation into Cancer United Kingdom Norfolk cohort. The American Journal of Clinical Nutrition 74 (2):188–96. doi: 10.1093/ajcn/74.2.188.
- Morabia, A., and E. L. Wynder. 1990. Dietary habits of smokers, people who never smoked, and exsmokers. The American Journal of Clinical Nutrition 52 (5):933–7.
- Myint, P. K., R. N. Luben, A. A. Welch, S. A. Bingham, N. J. Wareham, and K. T. Khaw. 2008. Plasma vitamin C concentrations predict risk of incident stroke over 10 y in 20 649 participants of the European Prospective Investigation into Cancer Norfolk prospective population study. The American Journal of Clinical Nutrition 87 (1):64–9.
- Nations, World Health Organization and Food and Agriculture Organization of the United. 2004. Vitamin and mineral requirements in human nutrition: Report of a joint FAO/WHO expert consultation, Bangkok, Thailand, 21–30 September 1998. Rome: World Health Organization and Food and Agriculture Organization of the United Nations.
- Phung, D. T., Z. Wang, S. Rutherford, C. Huang, and C. Chu. 2013. Body mass index and risk of pneumonia: A systematic review and meta-analysis. Obesity Reviews: An Official Journal of the International Association for the Study of Obesity 14 (10):839–57. doi: 10.1111/obr.12055.
- Pirkle, J. L. 2020. Laboratory procedure manual: Vitamin C (Ascorbic Acid) NHANES 2017–2018. Atlanta, GA, USA: CDC Environmental Health.
- Powers, C. D., M. R. Sternberg, S. B. Patel, C. M. Pfeiffer, R. J. Storandt, and R. L. Schleicher. 2023. Vitamin C status of US adults assessed as part of the national health and nutrition examination survey remained unchanged between 2003-2006 and 2017-2018. The Journal of Applied Laboratory Medicine 8 (2):272–84. doi: 10.1093/jalm/jfac093.
- Riemersma, R. A., M. Oliver, R. A. Elton, G. Alfthan, E. Vartiainen, M. Salo, P. Rubba, M. Mancini, H. Georgi, J. P. Vuilleumier, et al. 1990. Plasma antioxidants and coronary heart disease: Vitamins C and E, and selenium. European Journal of Clinical Nutrition 44 (2):143–50.
- Simon, J. A., E. S. Hudes, and W. S. Browner. 1998. Serum ascorbic acid and cardiovascular disease prevalence in U.S. adults. Epidemiology 9 (3):316–21. doi: 10.1097/00001648-199805000-00017.
- Simon, J. A., E. S. Hudes, and J. A. Tice. 2001. Relation of serum ascorbic acid to mortality among US adults. Journal of the American College of Nutrition 20 (3):255–63. doi: 10.1080/07315724.2001.10719040.
- Sinclair, A. J., A. J. Girling, L. Gray, C. Le Guen, J. Lunec, and A. H. Barnett. 1991. Disturbed handling of ascorbic acid in diabetic patients with and without microangiopathy during high dose ascorbate supplementation. Diabetologia 34 (3):171–5. doi: 10.1007/BF00418271.
- Sinha, R., G. Block, and P. R. Taylor. 1992. Determinants of plasma ascorbic acid in a healthy male population. Cancer Epidewmiology, Biomarkers & Prevention 1:297–302.
- Sun, H., J. Karp, K. M. Sun, and C. M. Weaver. 2022. Decreasing Vitamin C intake, low serum vitamin C level and risk for US adults with diabetes. Nutrients 14 (19):3902. doi: 10.3390/nu14193902.
- The Lancet Gastroenterology, Hepatology. 2021. Obesity: Another ongoing pandemic. Lancet Gastroenterol Hepatol 6 (6):411. doi: 10.1016/S2468-1253(21)00143-6.
- Tveden-Nyborg, P., and J. Lykkesfeldt. 2013. Does vitamin C deficiency increase lifestyle-associated vascular disease progression? Evidence based on experimental and clinical studies. Antioxidants & Redox Signaling 19 (17):2084–104. doi: 10.1089/ars.2013.5382.
- Values, Department of Health Panel on Dietary Reference. 1991. Dietary reference values for food energy and nutrients for the United Kingdom: Report of the Panel on Dietary Reference Values of the Committee on Medical Aspects of Food Policy. London: Her Majesty’s Stationery Office.
- Welch, A. A., A. McTaggart, A. A. Mulligan, R. Luben, N. Walker, K. T. Khaw, N. E. Day, and S. A. Bingham. 2001. DINER (Data Into Nutrients for Epidemiological Research) - A new data-entry program for nutritional analysis in the EPIC-Norfolk cohort and the 7-day diary method. Public Health Nutrition 4 (6):1253–65. doi: 10.1079/phn2001196.
- Yang, W. S., Y. C. Chang, C. H. Chang, L. C. Wu, J. L. Wang, and H. H. Lin. 2021. The association between body mass index and the risk of hospitalization and mortality due to infection: A prospective cohort study. Open Forum Infectious Diseases 8 (1):ofaa545. doi: 10.1093/ofid/ofaa545.
- Zhou, Y., Q. Yang, J. Chi, B. Dong, W. Lv, L. Shen, and Y. Wang. 2020. Comorbidities and the risk of severe or fatal outcomes associated with coronavirus disease 2019: A systematic review and meta-analysis. International Journal of Infectious Diseases: IJID: Official Publication of the International Society for Infectious Diseases 99:47–56. doi: 10.1016/j.ijid.2020.07.029.
- Zondervan, K. T., M. C. Ocké, H. A. Smit, and J. C. Seidell. 1996. Do dietary and supplementary intakes of antioxidants differ with smoking status? International Journal of Epidemiology 25 (1):70–9. doi: 10.1093/ije/25.1.70.