
Abstract
Germinal center B-cell-like (GCB) and activated B-cell-like (ABC) subtype diffuse large B-cell lymphoma (DLBCL) showed differential prognosis. Our results suggested that ouabain induced stronger inhibition of growth in Su-DHL4 (GCB), and it triggered obvious apoptosis in Su-DHL4 rather than in OCI-Ly3 (ABC). Two subtype cell lines also showed distinct metabolic phenotypes involving remarkable enrichment of Ribulose-5-Phosphate, hypoxanthine, and guanine in Su-DHL4 cells. Ouabain disturbed metabolic patterns of both cell lines dose-dependently manifested inhibition of free fatty acids and amino acids metabolism, among which ornithine was further identified as potential quantitative marker. Up-regulated Ribulose-5-Phosphate and NADPH/NADP+ level, SOD1, and CAT expression by ouabain enabled OCI-Ly3 cells to resist ROS, while enhanced hypoxanthine and guanine oxidation promoting ROS generation by ouabain, and lowered capacity of scavenging ROS indicated by lowered SOD1 and CAT expression and NADPH/NADP+ levels in Su-DHL4 cells made it more vulnerable to apoptosis through caspase 7 pathway.
Introduction
Diffuse large B-cell lymphoma (DLBCL) is the most common lymphoid neoplasms in adults, and it accounts for approximately 40% of non-Hodgkin lymphomas (NHLs) diagnosed annually in China [Citation1–3]. As a group of malignant tumors with considerable clinical manifestations and prognosis heterogeneity, DLBCL is divided into germinal center B-cell-like (GCB) and activated B-cell-like (ABC) according to the origin of cells [Citation4]. Patients with the ABC subtype usually have poorer prognosis than patients with the GCB subtype [Citation2,Citation5]. As a result, it is necessary to understand the characteristics of different types of DLBCL and to guide their clinical treatment according to the heterogeneity.
It is already shown that metabolic reprogramming of cancer cells have been identified as the seventh characteristic of tumors, which played an important role in occurrence and development of tumors [Citation6]. Metabolomics has facilitated global identification of numerous and diverse metabolic abnormalities in these neoplasms. For example, cancer cells show enhanced anaerobic glycolysis, reduced tri-carboxylic acid cycle (TCA cycle) [Citation7], and use glutamine as substitute energy supply [Citation8–10]. Serine addiction or relying on glycine is also observed in tumor cells [Citation11,Citation12]. Recently, researchers also found that restrictions of amino acid can significantly reduce the development of cancer or metastasis [Citation13,Citation14], implying that targeting metabolism may be one of the vital strategies for treating cancer. Several studies in vitro and the animal models also revealed a significant metabolic rearrangement in DLBCL including impaired glycine uptake [Citation15], abnormal metabolism of choline in high MYC expression of lymphoma [Citation16], and iron metabolism regulated by glutathione peroxidase 4 (GPX4) [Citation17]. Moreover, a metabolomics study of early relapsed/refractory (RR) DLBCL had shown separation between the RR group and the long-term no progression (LTNP) group by nuclear magnetic resonance spectroscopy analysis, which suggested that patients in RR group have higher identified metabolites include the lysine, arginine, cadaverine, and 2-hydroxybutyrate,while LTNP patients have higher aspartate, proline, ornithine, and pyroglutamate [Citation18]. Nevertheless, investigation about metabolomic difference between GCB DLBCL and ABC DLBCL is rarely.
R-CHOP (rituximab with cyclophosphamide, doxorubicin, vincristine and prednisolone) as the first-line treatment regimen of DBLCL chemotherapy just has a 5-years overall survival (OS) rate of 48–50%, while about 40% of patients ineluctably suffer disease progression or relapse during the course [Citation2]. Attempts to further improve overall survival and delay the relapse have been pursued all the time. Recently, researchers discovered that cardiac glycosides not only inhibited the growth of some cancer cells [Citation19], but also reduced relapse and metastasis [Citation20–22]. Ouabain is one of the cardiac glycosides, which specifically inhibits Na+/K+-ATPase [Citation23,Citation24]. Na+/K+-ATPase is not only a membrane protein regulating the concentration of sodium and potassium ions inside and outside cell, but also act as a drug receptor triggering signal transduction cascade to induce antitumor effects [Citation25]. Some cardiac glycosides have been entered phase I clinical trials [Citation26,Citation27]. However, therapeutic effect of ouabain on different subtypes of DLBCL has not been evaluated and the underlying anti-tumor mechanism of ouabain in DLBCL is unclear.
Herein, Su-DHL4 cells (GCB) and OCI-Ly3 cells (ABC) were employed and the metabolome of two types of DLBCL and the metabolic changes induced by ouabain were profiled using non-targeted metabolomics analysis, so as to evaluate the metabolic characteristic of subtypes of DLBCL and explore the diverse efficacy and underlying mechanism of ouabain.
Materials and methods
Cell culture and reagents
Su-DHL4 cells (GCB) and OCI-Ly3 cells (ABC) were cultured in RPMI 1640 medium supplemented with l-glutamine, 10% fetal bovine serum, 100 units/mL penicillin, and 100 μg/mL streptomycin (all from Gibco, Carlsbad, CA) in a fully humidified atmosphere 95% air and 5% CO2 at 37 °C. Ouabain octahydrate (≥95% HPLC, powder) was purchased from Sigma (St. Louis, MO) and dissolved in DMSO (Invitrogen, Carlsbad, CA) to prepare a stock solution (1 M).
Cell morphology and apoptosis assay
Cells (8 × 10⁵/mL) were seeded in 24-well plates and incubated with ouabain at concentrations of 40 and 80 nM and 0.1% DMSO as solvent control for 48 h. Cell morphology was analyzed by acquiring photographs use inverted microscope. Apoptosis was detected by using an FITC annexin V apoptosis detection kit I (Becton, Dickinson and Company, Franklin Lakes, NJ) according to the manufacturer’s protocol.
Cell viability
Cells (5 × 10⁴/mL) were seeded in 96-well plates and incubated with series concentrations (20, 40, 60, 80, 100, 120, 140, and 160 nM) of ouabain and solvent control (0 nM) for 24 h. Cell viability was measured by adding CCK8 at 1:10 (Dojindo, Tokyo, Japan) to each well. The absorbance was measured at 450 nM by spectrophotometry after incubated for 1 h at 37 °C.
Non-targeted detection of metabolites by GC-MS
Samples were prepared for metabolomics as follows: cells (5 × 10⁶/mL) were seeded in 6-well plates and incubated with ouabain at concentrations of 0, 40, and 80 nM for 24 h. Then cells and supernatants were collected. Cells were washed with normal saline for three times and re-suspended with triple distilled water. Samples were analyzed using gas chromatography-mass spectrometry (GC-MS) as previously described [Citation28,Citation29]. The detection procedures and data analysis can be seen in the supplemental materials in detail.
Quantitative real-time PCR
The total mRNA was extracted using TRizol reagent (Invitrogen, Carlsbad, CA). Complementary DNA was synthesized using PrimeScript RT reagent kit (Takara, Kyoto, Japan). Quantitative real-time PCR were performed by kit and ABI Q6. The primer sequences used were listed in the supplemental materials.
Reactive oxygen species (ROS) measurement
Intracellular ROS level was measured by staining the cell with 2′,7′-dichlorofluorescein-diaceate (DCFH-DA) according the manufacturer’s protocol. After treated with indicated concentrations of ouabain for 2 h, cells were incubated with 10 μM DCFH-DA (Beyotime, Shanghai, China) at 37 °C for 20 min in the dark. Then cells were washed with phosphate buffer saline (PBS) three times. Finally, intracellular fluorescence was detected by flow cytometer to evaluate ROS level.
NADP+/NADPH measurement
Cells (5 × 10⁵/mL) were seeded in 24-well plates and ouabain was added for 24 h. Then cells were harvested and NADP+ and NADPH were quantified using a NADP+/NADPH Assay Kit-WST (Dojindo, Tokyo, Japan) according to the manufacturers’ instructions.
Western blot analysis
Cells (1 × 10⁷/mL) were seeded in 6-well plates and pretreated with Q-VD-OPh (100 nM or 200 nM) for 2 h, then ouabain (40 and 80 nM) were added and 0.1% DMSO as solvent control for 48 h. Cells were collected for total protein extraction. Then extracted protein were assay according to supplemental materials in detail.
Statistical analysis
Data are shown as mean ± standard deviation (SD). Variance between different groups was determined by two-tailed Student’s t-test. For multiple comparisons, one-way analysis of variance (ANOVA) was performed and p-value < .05 was considered significant. Statistical analysis was performed using SPSS 18.0 (SPSS Inc., Chicago, IL).
Results
The effect of ouabain on cell growth and apoptosis
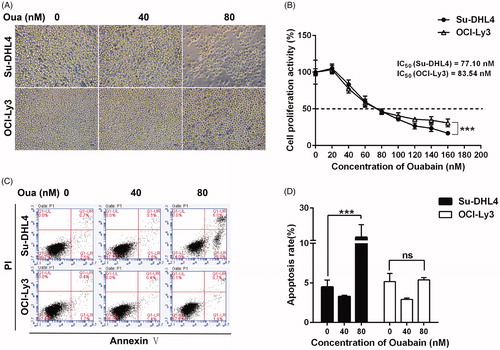
To evaluate the effect of ouabain on DLBCL cells, morphological changes in reducing cell numbers were first observed in the ouabain-treated group compared with the control group (). Ouabain also decreased cell viability dose dependently by CCK8 (). Exposure to 40 nM of ouabain significantly inhibited cell viability in both cell lines and high dose of ouabain (160 nM) caused more reduction in Su-DHL4 cells than in OCI-Ly3 cells (64.31% versus 69.15%, p = .00015). Consistently, the value of IC50 in Su-DHL4 (77.10 nM) was less than that in OCI-ly3 (83.54 nM). It indicated that ouabain inhibited the proliferation in both cell lines, and Su-DHL4 is comparatively more sensitive to ouabain. Moreover, ouabain (80 nM) triggered significant apoptosis in Su-DHL4 cells rather than in OCI-Ly3 cells (). Collectively, these data suggested that ouabain significantly inhibited cell growth in a dose-dependent manner in DLBCL cells. However, ouabain is more effective in Su-DHL4 cells (GCB) compared with OCI-Ly3 cells (ABC).
Figure 1. The effect of ouabain on cell growth and apoptosis. (A) Morphology of Su-DHL4 cells and OCI-Ly3 cells incubated with ouabain (0, 40, and 80 nM) for 48 h were visualized under a light microscope (×200), scale bar = 50 µm. (B) Cell viability of two cell lines after exposure to ouabain (0, 20, 40, 60, 80, 100, 120, 140, and 160 nM) for 24 h were detected by using CCK-8 method. (C) Representative flow cytometric images of apoptosis in Su-DHL4 cells and OCI-Ly3 cells after treated with ouabain (0, 40, and 80 nM). Apoptosis was detected by FITC annexin V staining. (D) The quantitative analysis of apoptotic ratio of cells. ***p < .001: significant differences between solvent control and treatment group. ns: no significant difference.
Different metabolic phenotypes of DLBCL cell lines
To explore the metabolic phenotypes of two DLBCL cell subtypes, intracellular and extracellular metabolites of cells were profiled using GC/MS. Among identified metabolites in cells and medium (Tables S1 and S2), 43 metabolites were common (Figure S1a) which indicated active substance exchange and metabolism of cells. Based on the obtained data matrix (Tables S1 and S2), the orthogonal partial least-squared discrimination analysis (OPLS-DA) models were generated to demonstrate the metabolic phenotype of cells as well as medium. The two cell lines and cell medium clustered within each group and separated clearly from each other indicating different metabolic phenotypes between Su-DHL4 and OCI-Ly3 cells ().
Figure 2. DLBCL cell lines showed different metabolic phenotypes. (A) and (B) Metabolic patterns of intracellular metabolites (A) and culture media metabolites (B) in untreated Su-DHL4 and OCL-Ly3 cells by orthogonal partial least-squared discrimination analysis (OPLS-DA) (SC: Su-DHL4 cells; OC: OCI-Ly3 cells; KB: the blank medium). (C) and (D) Volcano maps of metabolites in cells (C) and culture media (D) detected by GC/MS. The dots in green represent significant lower abundance in Su-DHL4 cells than OCI-Ly3 cells (p < .05 and fold change (SC/OC) < .5). Metabolites of higher abundance in Su-DHL4 were showed as red dots (p < .05 and fold change (SC/OC) > 2). FC fold change. (E) Heat map of significantly different metabolites identified between Su-DHL4 and OCL-Ly3 cells and culture media. (F) Metabolic pathway analysis based on differential metabolites between Su-DHL4 and OCL-Ly3 cells and culture media.
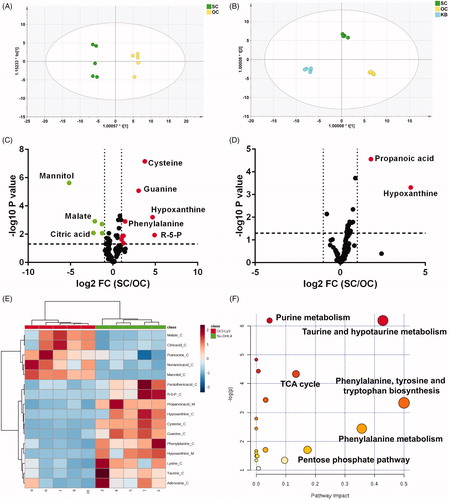
According to further statistical analysis by 2D volcano plots which displaying metabolites changed to a large extent (fold change > 2 or <0.5) and statistical significance (p < .05) highlighted (), 5 metabolites were significantly higher and 9 metabolites were markedly lower, while only 2 extracellular metabolites were obviously higher in Su-DHL4 cells compared with OCI-Ly3 cells. Then a visualized heat map () showed malate, critic acid, putrescine, nonanoic acid, mannitol was enriched in OCI-Ly3 cells, while amino acids (cysteine/phenylalanine/lysine/taurine), nucleotides (guanine/hypoxanthine/adenosine), pantothenic acid, and ribulose-5-phosphate (R-5-P) were greatly enriched in Su-DHL4 cells. Remarkably, mannitol, R-5-P, hypoxanthine, cysteine, and guanine were the top 5 significantly differential cellular metabolites whose abundance in Su-DHL4 cells were 36.60, 36.36, 29.92, 15.84, and 9.83 times of those in OCI-Ly3 cells, respectively. In addition, enrichment of extracellular hypoxanthine and propanoic acid were also observed in Su-DHL4 cells culture medium (). Based on these, pathway analysis demonstrated that perturbed metabolic pathways between two cell subtypes involves taurine and hypotaurine metabolism, phenylalanine metabolism, tri-carboxylic acid cycle (TCA cycle), and pentose phosphate (PPP) pathway ().
The metabolic changes induced by ouabain in DLBCL cell lines
Ouabain incubation caused an obvious metabolic shift of both the intracellular and extracellular metabolome (). High dose of ouabain exposure markedly perturbed the metabolic pattern of two cell lines with scatters departed even further from the control. Based on the OPLS-DA model of cellular data, the RDV [Citation30] (relative distance value) for the high-dose group from the corresponding control group is relatively higher than that for the low-dose group in both cell lines, indicating a dose-dependent effect of ouabain. The metabolites disturbed by ouabain were further identified (). Ouabain (80 nM) disturbed 32 metabolites in Su-DHL4 cells and 34 metabolites in OCI-Ly3 cells compared with the control group, respectively, while only two metabolites were increased by ouabain in the supernatant of each cell line. A Venn diagram and heatmaps intuitively further displayed (Figure S1b, 1(d–f)) 21 metabolites altered by ouabain in both cell lines with 18 up-regulated and 3 down-regulated, while 11 cellular metabolites were significantly regulated by ouabain only in Su-DHL4 cells and 13 were impacted evidently only in OCI-Ly3 cells, which indicated varied responses to ouabain exposure. Only 2 metabolites with one in common were identified to be greatly impacted by ouabain in cell culture medium (Figure S1c). Pathway analysis based on these metabolites demonstrated that ouabain affected lipid metabolism (glycerophospholipid, α-linolenic acid, glycerolipid metabolism), arginine and proline metabolism, taurine and hypotaurine metabolism (Figure S1g and 1h).
Figure 3. The metabolic response of DLBCL cell lines to ouabain treatment. (A) Metabolic patterns of intracellular metabolites and culture media metabolites in ouabain-treated or untreated Su-DHL4 and OCL-Ly3 cells by OPLS-DA. A1, ouabain-treated or untreated Su-DHL4 cells; A3, corresponding culture media of ouabain-treated or untreated Su-DHL4 cells (SC: control group, SL: 40 nM ouabain-treated group and SH: 80 nM ouabain-treated group). A2, ouabain-treated or untreated OCI-Ly3 cells; A4, corresponding culture media of ouabain-treated or untreated OCI-Ly3 cells (OC: control group, OL: 40 nM ouabain-treated group and (OH: 80 nM ouabain-treated group). (B) Volcano maps of metabolites detected by GC-MS. B1, metabolites of 80 nM ouabain-treated Su-DHL4 cells compared with its control group, B2, metabolites of 80 nM ouabain-treated OCI-Ly3 cells compared with its control group. B3, metabolites in the culture media of 80 nM ouabain-treated Su-DHL4 cells compared with its control group. B4, metabolites in the culture media of 80 nM ouabain-treated Su-DHL4 cells compared with its control group. Green dots: p < .05 and fold change (SC/OC) < .5. Red dots: p < .05 and fold change (SC/OC) > 2.
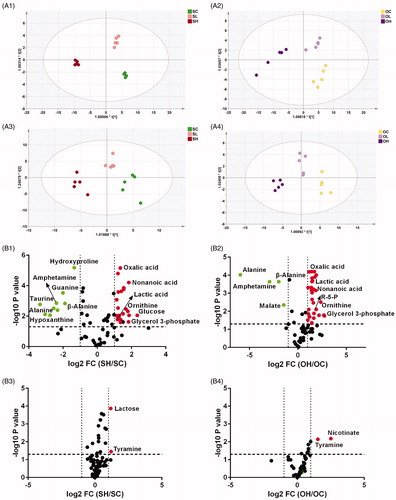
Figure 4. The abundance of typical discriminatory metabolites identified by volcano maps. (A1–A8) Abundance of similarly changed metabolites in both of the two cell lines after ouabain treatment. (B1)–(B4) Abundance of metabolites significantly changed only in Su-DHL4 cells after ouabain treatment. *p < .05, **p < 0.01, ***p < .001 and ns: no significant difference.
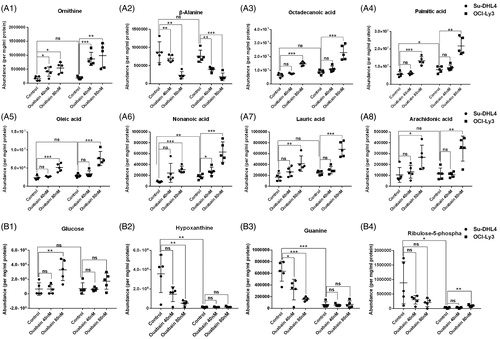
Typical disturbed metabolites in these pathways are shown in . Ornithine was increased while β-alanine was decreased significantly by ouabain in a dose dependent manner in two cell lines. While free fatty acids including octadecanoic acid, palmitic acid, oleic acid, nonanoic acid, lauric acid and arachidonic acid were increased by high dosage of ouabain in both cell lines (). In addition, there were some interesting metabolic changes. Glucose was enhanced significantly while hypoxanthine and guanine levels were reduced obviously by ouabain in Su-DHL4 cells. In contrast, the abundance of glucose, hypoxanthine, and guanine levels were no changed, but ribulose-5-phosphate increased in OCI-LY3 cells significantly ().
Oxidative stress states and the effect of ouabain in DLBCL cell lines
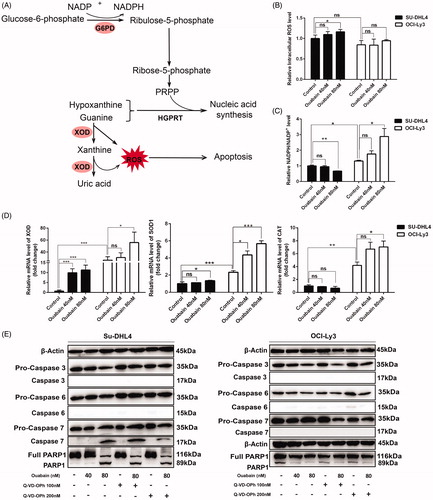
Since OCI-Ly3 cell is more resistant to ouabain-induced apoptosis (), and the metabolomic result revealed that metabolites in PPP pathway and purine metabolism responded to ouabain differently in two cell lines (). PPP is responsible for generation of NADPH which plays a key role in anti-oxidative stress [Citation31,Citation32]. The catabolism of hypoxanthine and guanine into uric acid produces much ROS [Citation33,Citation34]. Moreover, previous studies showed that ouabain induced cell apoptosis by promoting ROS generation [Citation35–38]. So we speculated that different antioxidant capacity may contribute to differential apoptosis rate induced by ouabain. As expected, ouabain incubation for 2 h significantly increased generation of ROS in Su-DHL4 cells rather than OCI-Ly3 cells (). Then NADPH/NADP+ level, an indicator of oxidative stress, decreased significantly with ouabain exposure in Su-DHL4 cells compared with the control, indicating increased oxidative stress. However, NADPH/NADP+ was oppositely increased by ouabain dose dependently in OCI-Ly3 cells, and its basal level was higher than in Su-DHL4 cells, suggesting that anti-oxidant capacity of OCI-Ly3 cells is stronger than Su-DHL4 cells (). Furthermore, critical enzymes involved in these pathways were detected (). XOD, an enzyme to degrade hypoxanthine and guanine and generate ROS, was markedly increased in Su-DHL4 cells by ouabain compared with the control (FC = 5.18, p = .0003), although high dose of ouabain also up-regulated XOD expression slightly in OCI-Ly3 cells (FC = 2.01, p = .0101). The basal expression of SOD1 and CAT, key enzymes in antioxidant system, were remarkably higher in OCI-Ly3 cells, and those were significantly increased by ouabain, while less obvious change was observed in Su-DHL4 cells. To further confirm the mechanism of apoptosis induced by ouabain, the caspase cascade pathway including caspase activation and substrate (PARP1) cleavage were analyzed by western blot analysis [Citation39,Citation40]. When treated with ouabain (80 nM), activated caspase 3 and caspase 6 were rarely expressed in both cell lines, while the expression of activated caspase 7 and cleaved PARP1 was only enhanced significantly in Su-DHL4 cells. Meanwhile Q-VD-OPh (200 nM), a pan caspase inhibitor, can partially reverse the up-regulated expression of activated caspase 7 and cleaved PARP1 induced by ouabain in Su-DHL4 cells ().
Figure 5. Oxidative stress states contributed to the effect of ouabain in DLBCL cell lines. (A) Schematic description of the pentose phosphate pathway and purine metabolism. NADP+: nicotinamide adenine dinucleotide phosphate; NADPH: reduced nicotinamide adenine dinucleotide phosphate; G6PD: glucose-6-phosphate dehydrogenase; XOD: xanthine oxidase; ROS: reactive oxygen species; PRPP: phosphoribosyl pyrophosphate; HGPRT: hypoxanthine-guanine phosphoribosyltransferase. (B) ROS level of cells detected by flow cytometry without or with ouabain incubation for 2 h. (C) Relative NADPH/NADP + level of cells measured after treated with ouabain for 24 h by using the NADP+/NADPH assay kit. (D) The mRNA expression of XOD, SOD1and CAT in two cell lines and the effect of ouabain by quantitative real-time PCR analysis. *p < .05, **p < .01, ***p < .001, ns: no significant difference. (E) Two cell lines were pretreated with Q-VD-OPh (100 nM and 200 nM) for 2 h and the protein expression of β-Actin, pro-caspase 3, caspase 3, pro-caspase 6, caspase 6, pro-caspase 7, caspase 7, full PARP1, and PARP1 in two cell lines (left panel: Su-DHL4 cells, right panel: OCI-Ly3 cells) with or without treated by ouabain (40 nM or 80 nM) for 48 h were detected by western blot analysis.
Discussion
Our data showed that ouabain induced an obvious reduction of cell numbers and cell viability in both types of DLBCL cell lines, suggesting the antitumor activity of ouabain in DLBCL (), which is corresponding to existing researches [Citation22,Citation25,Citation41]. IC50 in Su-DHL4 cells was relatively higher than that in OCI-ly3 cells and high dosage of ouabain triggered significant apoptosis in Su-DHL4 cells rather than in OCI-ly3 cells (). This indicated that Su-DHL4 cells line (GCB) was a more sensitive phenotype than OCI-Ly3 cells line (ABC). It is also well recognized that ABC subtype usually have poorer prognosis than patients with the GCB subtype in clinical.
To explore the mechanism contributing to the different responses of the two cell lines to ouabain, metabolomics was employed to profile the metabolome of cells and medium. Although previous study in two subsets of DLBCLs (BCR-DLBCLs and OxPhos-DLBCLs) suggested that OxPhos-DLBCLs showed enhanced mitochondrial energy transduction, more carbon sources into the TCA cycle and increased glutathione levels compared with BCR-DLBCLs [Citation42]. To the best our knowledge, this is the first study to explore the metabolic phenotype of GCB and ABC subtype and evaluate ouabain efficacy based on in vitro metabolomic data from DLBCL cells.
Obviously different metabolic phenotypes between Su-DHL4 and OCI-Ly3 cells were displayed, and ouabain induced an obvious shift of intracellular and extracellular metabolome of cells dose dependently which were consistent with the reduced cell viability (). Much more differential metabolites were identified in cells than in medium by statistical analysis, indicating cells were highly metabolic flexibility and cell phenotypes can be well characterized by cellular metabolic profile. While metabolome of medium, representing the result of extensive metabolic exchanging between culture medium, has high buffering capacity and can reflect cell metabolism indirectly. Pathway analysis performed on the statistically differential intracellular metabolites between two cell lines showed that TCA cycle, PPP, taurine, and hypotaurine metabolism and purine metabolism were disordered between two cell lines. The basal abundance of R-5-P in PPP and hypoxanthine and guanine in purine metabolism were markedly higher in Su-DHL4 cells ( and Supplement Figure 1(d–f)). It is possible that Su-DHL4 cells more relied on the PPP to provide intermediates for further synthesis of nucleotides such as purines to keep its faster proliferation compared with OCI-Ly3 cells. On the contrary, malate in TCA cycle was higher in OCI-Ly3 cells but metabolites related to glycolysis pathway (glucose, fructose, G-3-P, glyceric acid, and lactic acid) were not significantly different between two cell lines, which suggested greater metabolic flux in TCA cycle and higher mitochondrial oxidative phosphorylation in OCI-Ly3 cells consistent with the findings reported by Caro et al. [Citation42].
Among significantly changed cellular metabolites, only ornithine changed over two-fold even by the low dosage of ouabain treatment ( and Supplement ). Therefore, it may be indicated as a sensitive quantitative marker for ouabain efficacy. But mechanisms behind the increased ornithine induced by ouabain and its association with antitumor activity needed further research. Furthermore, levels of free fatty acids including octadecanoic acid, palmitic acid, oleic acid, nonanoic acid, lauric acid, arachidonic acid, octadecenoic acid, palmitoleic acid, and α-linolenic acid were increased by ouabain in Su-DHL4 cells or OCI-Ly3 cells. Most of them increased significantly in both cell lines while some were changed more obviously in OCI-ly3 cells such as octadecenoic acid, palmitoleic acid, and α-linolenic acid, and the abundance of 11-eicosenoic acid was only changed significantly in OCI-Ly3 cells (). It is reported that change of lipid metabolism is now recognized as one of the key features of cancer [Citation43]. Free fatty acids not only play a role in cell membrane construction and energy production, but also exert diverse cellular effects through receptor and non-receptor mechanisms. It is reported that dysregulation of free fatty acids caused cell death through a variety of pathways including apoptosis and endoplasmic reticulum stress [Citation44–46]. And researchers also showed that oleic and linoleic acids enhanced the interaction between ouabain and Na+-K+-ATPase in vivo [Citation47]. Moreover, Harmeet et al. indicated that saturated FFAs activated the proapoptotic Bcl-2 proteins Bim and Bax and induced JNK-dependent hepatocyte lipoapoptosis [Citation48]. As a result, disturbance of free fatty acids metabolism by ouabain might greatly contribute to its antitumor activity. However, the mechanism of free fatty acids accumulation induced by ouabain is still unknown and how it contributed to antitumor effect is unclear, which will be expanded on in our future study.
Moreover, R-5-P, hypoxanthine, and guanine were significantly higher in Su-DHL4 cells compared with OCI-Ly3 cells. Then Ouabain significantly reduced the abundance of hypoxanthine and guanine in Su-DHL4 which was not observed in OCI-Ly3 (). And ouabain caused an obviously reduction of R-5-P in Su-DHL4 cells but a significant increase in OCI-Ly3 cells. These data indicated that hypoxanthine and guanine degradation were increased or hypoxanthine and guanine synthesis were blocked in Su-DHL4 cells, while level of NADPH for anti-oxidant was elevated in OCI-Ly3 cells. It is well documented that enhanced ROS level is related to apoptosis () [Citation35–38]. As showed, ROS generation was significantly elevated in Su-DHL4 cells with ouabain rather than in OCI-Ly3 cells (Figured 5(B)). Consistently, level of NADPH/NADP+ was decreased dose dependently in Su-DHL4 cells but increased in OCI-ly3 cells indicating the differential oxidative stress of the two cell lines. The expression of G6PD, a key enzyme in PPP pathway, was no significantly changed in two cell lines by ouabain (data not shown). Meanwhile, expression of XOD which mediates ROS generation was increased significantly in Su-DHL4 cells. Over expression of SOD1 and CAT was observed in OCI-Ly3 cells, which were further induced significantly by ouabain (). In addition, the protein expression of activated caspase 7 and cleaved PARP1 representing the activation of caspase pathway induced by ROS were up-regulated significantly in Su-DHL4 cells and can be partially reversed by a pan caspase inhibitor (Q-VD-OPh). Collectively, ouabain induced significant ROS generation through enhancing hypoxanthine and guanine oxidation and depressing the ability of ROS scavenging indicated by inhibition of PPP in Su-DHL4 cells. The increased ROS then triggered apoptosis by activation of caspase 7 and cleavage of PARP1. On the contrary, overexpression of enzymes in the antioxidant system and the reduction of pro-caspase 3, pro-caspase 6, pro-caspase 7, and cleaved PARP1 enabled OCI-Ly3 cells to resist oxidative stress and apoptosis induced by ouabain exposure ().
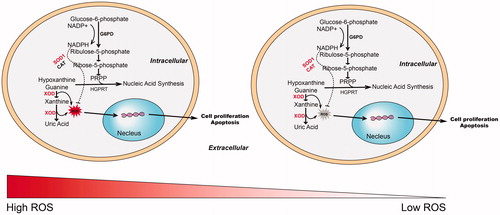
Figure 6. Overview of the differential metabolic phenotype and response to ouabain treatment in the two subtypes of DLBCL cell lines. NADP+: nicotinamide adenine dinucleotide phosphate; NADPH: reduced nicotinamide adenine dinucleotide phosphate; G6PD: glucose-6-phosphate dehydrogenase; XOD: xanthine oxidase; ROS: reactive oxygen species; PRPP: phosphoribosyl pyrophosphate; HGPRT: hypoxanthine-guanine phosphoribosyltransferase. SOD1: superoxide dismutase 1; CAT: catalase.
In conclusion, although ouabain inhibited the cell growth and viability in both cell types, Su-DHL4 cells (GCB) was more sensitive to ouabain exposure than OCI-Ly3 cells (ABC). Su-DHL4 cells and OCI-Ly3 cells showed significant different metabolic patterns and disturbed by ouabain in a dose-dependent manner. Disturbance of free fatty acids metabolism was observed in both cell lines, and ornithine were identified as sensitive potential markers for ouabain efficacy. Vulnerable of PPP pathway and hypoxanthine oxidation, and depressed expression of enzymes in anti-oxidant system in Su-DHL4 cells may result in an increase of ROS, which contributed to the apoptosis triggered by ouabain. The enhanced expression of activated caspase 7 and cleaved PARP1 may explain the mechanism of downstream apoptosis event induced by ROS.
GLAL-2020-1517-File009.docx
Download MS Word (36.2 KB)GLAL-2020-1517-File008.docx
Download MS Word (21.4 KB)GLAL-2020-1517-File007.jpg
Download JPEG Image (2.3 MB)
Acknowledgments
The authors thank Sijia Li and Runbin Sun for assistance and support in this study.
Disclosure statement
The authors declare that they have no potential conflicts of interest with respect to the research, authorship, and publication of this study.
Additional information
Funding
References
- Wang XM, Bassig BA, Wen JJ, et al. Clinical analysis of 1629 newly diagnosed malignant lymphomas in current residents of Sichuan province, China. Hematol Oncol. 2016;34(4):193–199.
- Zelenetz AD, Abramson JS, Advani RH, et al. NCCN Clinical Practice Guidelines in Oncology: non-Hodgkin's lymphomas. J Natl Compr Canc Netw. 2010;8(3):288–334.
- Yoon SO, Suh C, Lee DH, et al. Distribution of lymphoid neoplasms in the Republic of Korea: analysis of 5318 cases according to the World Health Organization classification. Am J Hematol. 2010;85(10):760–764.
- Alizadeh AA, Eisen MB, Davis RE, et al. Distinct types of diffuse large B-cell lymphoma identified by gene expression profiling. Nature. 2000;403(6769):503–511.
- Rosenwald A, Wright G, Chan WC, Lymphoma/Leukemia Molecular Profiling Project, et al. The use of molecular profiling to predict survival after chemotherapy for diffuse large-B-cell lymphoma. N Engl J Med. 2002;346(25):1937–1947.
- Hanahan D, Weinberg RA. Hallmarks of cancer: the next generation. Cell. 2011;144(5):646–674.
- Hui S, Ghergurovich JM, Morscher RJ, et al. Glucose feeds the TCA cycle via circulating lactate. Nature. 2017;551:115.
- Wise DR, Thompson CB. Glutamine addiction: a new therapeutic target in cancer. Trends Biochem Sci. 2010;35(8):427–433.
- Son J, Lyssiotis CA, Ying H, et al. Glutamine supports pancreatic cancer growth through a KRAS-regulated metabolic pathway. Nature. 2013;496(7443):101–105.
- Gao P, Tchernyshyov I, Chang T-C, et al. c-Myc suppression of miR-23a/b enhances mitochondrial glutaminase expression and glutamine metabolism. Nature. 2009;458(7239):762–765.
- Frezza C. Cancer metabolism: addicted to serine. Nat Chem Biol. 2016;12(6):389–390.
- Jain M, Nilsson R, Sharma S, et al. Metabolite profiling identifies a key role for glycine in rapid cancer cell proliferation. Science. 2012;336(6084):1040–1044.
- Knott SR, Wagenblast E, Khan S, et al. Asparagine bioavailability governs metastasis in a model of breast cancer. Nature. 2018;554(7692):378–381.
- Kim C-H, Park KJ, Park JR, et al. The RNA interference of amino acid transporter LAT1 inhibits the growth of KB human oral cancer cells. Anticancer Res. 2006;26(4B):2943–2948.
- Ducker GS, Ghergurovich JM, Mainolfi N, et al. Human SHMT inhibitors reveal defective glycine import as a targetable metabolic vulnerability of diffuse large B-cell lymphoma. Proc Natl Acad Sci USA. 2017;114(43):11404–11409.
- Xiong J, Wang L, Fei X, et al. MYC is a positive regulator of choline metabolism and impedes mitophagy-dependent necroptosis in diffuse large B-cell lymphoma. Blood Cancer J. 2017;7(7):e582–e582.
- Yang WS, SriRamaratnam R, Welsch ME, et al. Regulation of ferroptotic cancer cell death by GPX4. Cell. 2014;156(1-2):317–331.
- Stenson M, Pedersen A, Hasselblom S, et al. Serum nuclear magnetic resonance-based metabolomics and outcome in diffuse large B-cell lymphoma patients – a pilot study. Leuk Lymphoma. 2016;57(8):1814–1822.
- Mijatovic T, Roland I, Van Quaquebeke E, et al. The alpha1 subunit of the sodium pump could represent a novel target to combat non-small cell lung cancers. J Pathol. 2007;212(2):170–179.
- Laverdière I, Boileau M, Neumann AL, et al. Leukemic stem cell signatures identify novel therapeutics targeting acute myeloid leukemia. Blood Cancer J. 2018;8(6):52.
- Shih YL, Au MK, Liu KL, et al. Ouabain impairs cell migration, and invasion and alters gene expression of human osteosarcoma U-2 OS cells. Environ Toxicol. 2017;32(11):2400–2413.
- Shen Y, Wang Q, Tian Y. Reversal effect of ouabain on multidrug resistance in esophageal carcinoma EC109/CDDP cells by inhibiting the translocation of Wnt/β-catenin into the nucleus. Tumor Biol. 2016;37(12):15937–15947.
- Prassas I, Diamandis EP. Novel therapeutic applications of cardiac glycosides. Nat Rev Drug Discov. 2008;7(11):926–935.
- Dimas K, Papadopoulou N, Baskakis C, et al. Steroidal cardiac Na+/K + ATPase inhibitors exhibit strong anti-cancer potential in vitro and in prostate and lung cancer xenografts in vivo. Anticancer Agents Med Chem. 2014;14(5):762–770.
- Wang Y, Qiu Q, Shen J-J, et al. Cardiac glycosides induce autophagy in human non-small cell lung cancer cells through regulation of dual signaling pathways. Int J Biochem Cell Biol. 2012;44(11):1813–1824.
- Chiney MS, Menon RM, Bueno OF, et al. Clinical evaluation of P-glycoprotein inhibition by venetoclax: a drug interaction study with digoxin. Xenobiotica. 2018;48(9):904–910.
- Slingerland M, Cerella C, Guchelaar H-J, et al. Cardiac glycosides in cancer therapy: from preclinical investigations towards clinical trials. Invest New Drugs. 2013;31(4):1087–1094.
- Sun R, Yang N, Kong B, et al. Orally administered berberine modulates hepatic lipid metabolism by altering microbial bile acid metabolism and the intestinal FXR signaling pathway. Mol Pharmacol. 2017;91(2):110–122.
- Li M, Wang X, Aa J, et al. GC/TOFMS analysis of metabolites in serum and urine reveals metabolic perturbation of TCA cycle in db/db mice involved in diabetic nephropathy. Am J Physiol Renal Physiol. 2013;304(11):F1317–F1324.
- Aa J, Shao F, Wang G, et al. Gas chromatography time-of-flight mass spectrometry based metabolomic approach to evaluating toxicity of triptolide. Metabolomics. 2011;7(2):217–225.
- Ying W. NAD+/NADH and NADP+/NADPH in cellular functions and cell death: regulation and biological consequences. Antioxid Redox Signal. 2008;10(2):179–206.
- Xiao G, Chan LN, Klemm L, et al. B-cell-specific diversion of glucose carbon utilization reveals a unique vulnerability in B cell malignancies. Cell. 2018;173(2):470–484. e418.
- Kim Y-J, Ryu H-M, Choi J-Y, et al. Hypoxanthine causes endothelial dysfunction through oxidative stress-induced apoptosis. Biochem Biophys Res Commun. 2017;482(4):821–827.
- Ding Y, Wang H, Niu J, et al. Induction of ROS overload by alantolactone prompts oxidative DNA damage and apoptosis in colorectal cancer cells. Int J Mol Sci. 2016;17(4):558.
- Sinha K, Das J, Pal PB, et al. Oxidative stress: the mitochondria-dependent and mitochondria-independent pathways of apoptosis. Arch Toxicol. 2013;87(7):1157–1180.
- Chang YM, Shih YL, Chen CP, et al. Ouabain induces apoptotic cell death in human prostate DU 145 cancer cells through DNA damage and TRAIL pathways. Environ Toxicol. 2019;34(12):1329–1339.
- Rasheduzzaman M, Yin H, Park SY. Cardiac glycoside sensitized hepatocellular carcinoma cells to TRAIL via ROS generation, p38MAPK, mitochondrial transition, and autophagy mediation. Mol Carcinog. 2019;58(11):2040–2051.
- Yan Y, Shapiro AP, Haller S, et al. Involvement of reactive oxygen species in a feed-forward mechanism of Na/K-ATPase-mediated signaling transduction. J Biol Chem. 2013;288(47):34249–34258.
- McComb S, Chan PK, Guinot A, et al. Efficient apoptosis requires feedback amplification of upstream apoptotic signals by effector caspase-3 or -7. Sci Adv. 2019;5(7):eaau9433.
- Yang J, Ren X, Zhang L, et al. Oridonin inhibits oral cancer growth and PI3K/Akt signaling pathway. Biomed Pharmacother. 2018;100:226–232.
- Yang XS, Xu ZW, Yi TL, et al. Ouabain suppresses the growth and migration abilities of glioma U-87MG cells through inhibiting the Akt/mTOR signaling pathway and downregulating the expression of HIF-1α. Mol Med Report. 2018;17:5595–5600.
- Caro P, Kishan AU, Norberg E, et al. Metabolic signatures uncover distinct targets in molecular subsets of diffuse large B cell lymphoma. Cancer Cell. 2012;22(4):547–560.
- Mahmoud AM, Wilkinson FL, McCarthy EM, et al. Endothelial microparticles prevent lipid-induced endothelial damage via Akt/eNOS signaling and reduced oxidative stress. Faseb J. 2017;31(10):4636–4648.
- Pagliassotti MJ. Endoplasmic reticulum stress in nonalcoholic fatty liver disease. Annu Rev Nutr. 2012;32:17–33.
- Iuchi K, Ema M, Suzuki M, et al. Oxidized unsaturated fatty acids induce apoptotic cell death in cultured cells. Mol Med Rep. 2019;19(4):2767–2773.
- Huang C, Freter C. Lipid metabolism, apoptosis and cancer therapy. Int J Mol Sci. 2015;16(1):924–949.
- Mahmmoud YA, Christensen SB. Oleic and linoleic acids are active principles in Nigella sativa and stabilize an E(2)P conformation of the Na,K-ATPase. Fatty acids differentially regulate cardiac glycoside interaction with the pump. Biochim Biophys Acta. 2011;1808(10):2413–2420.
- Malhi H, Bronk SF, Werneburg NW, et al. Free fatty acids induce JNK-dependent hepatocyte lipoapoptosis. J Biol Chem. 2006;281(17):12093–12101.