
 ?Mathematical formulae have been encoded as MathML and are displayed in this HTML version using MathJax in order to improve their display. Uncheck the box to turn MathJax off. This feature requires Javascript. Click on a formula to zoom.
ABSTRACT
This paper relies on register-based statistical data from Finland to measure broad research and development (R&D), organizational capital (OC) and information and communication technology (ICT) investments as innovation inputs in addition to formal survey-based R&D and CIS survey data on innovations. The linked panel data are appropriate for a comparison of low-market-share (small) and large-market-share (large) firms. We analyze the productivity growth and profitability of Finnish firms with varying market power. In contrast to high-market-share firms, low-market-share firms are characterized by low profit derived from new innovations. This study suggests that in addition to imitative growth, a ‘negative selection mechanism’ explains the high productivity growth relative to the low profits.
KEYWORDS:
1. Introduction
This study examines innovations and the performance of low- and high-market-share firms, and it incorporates a broad range of intangible capital (IC) as innovation inputs, as described in Crepon, Duguet, and Mairessec’s (Citation1998) (CDM) framework. The current literature contains a research gap resulting in the inability to fully explain why low-technology rather than high-technology firms gain productivity from process innovations, as described by Hall, Lotti, and Mairesse (Citation2009); see also Cohen and Levinthal (Citation1989). One suggested explanation is that research and development (R&D) provides firms the absorptive capacity to recognize the value of new information, assimilate this information, and learn from industry leaders. Firms with a low market share and young firms are also likely to be suppressed by adjustment costs, financing frictions and uncertainties, leading to large fixed costs. These costs may lead to a ‘negative selection mechanism’ in innovation activity, and firms with low initial productivity and profitability invest only in innovations with the highest productivity growth.
In this analysis, similar to Griffith, Redding, and Van Reenen (Citation2004), we introduce a productivity growth model that accounts for initial productivity. Similar to Lileeva and Trefler (Citation2010), the analysis is extended to negative selection to determine how returns on innovations decrease at the initial productivity level. Low-market-share firms face a similar challenge in both starting to enlarge markets (to export in Lileeva and Trefler) and to invest in innovations or performing neither activity. The productivity growth differential decreases at the initial productivity level, causing innovative firms to engage in a negative selection toward low initial productivity. Imitative growth is the other source of productivity growth that may not lead to greater profits. Hall, Lotti, and Mairesse (Citation2009) also find that compared to R&D in high-technology SMEs, R&D in low-technology SMEs leads such firms to invest more in process innovations, which is also explained by the firms’ ability to absorb and adopt existing technologies through their R&D.
Negative selection does not operate the same way in high-market-share firms, which generally have higher levels of productivity. Our analysis is also related to Schumpeterian growth, where firms need market power to reap profits from future innovations. Innovations are performed to earn abnormal profits but are also subjected to creative destruction (Schumpeter Citation1942, Citation1947). Innovations lead to out-of-equilibrium conditions that increase profitability above the average or result in failure (Antonelli and Scellato Citation2011).
We use statistical business data on manufacturing and services as well as employee data on occupations, educational background and labor costs covering an annual average of approximately 2300 Finnish firms during the 1995–2013 period. These data include the Finnish Community Innovation Survey (CIS), which is conducted every other year, and Finland’s annual R&D survey. Innovations use intangibles (ICs) as inputs, and ICs include two ways to measure R&D investment—formal survey data and register-based employee data—to evaluate first R&D-type work. Information and communication technology (ICT) capital is evaluated from ICT services occupations. These register-based data are particularly important for analyzing low-market-share small firms, which are not entirely covered in R&D survey data. Broad R&D and other ICs are thus also evaluated based on innovation work using the methodology from the Innodrive 7th framework project (FP7); see Piekkola et al. (Citation2011), Piekkola (Citation2016), and the Organization for Economic Cooperation and Development (OECD) study by Squicciarini and Le Mouel (Citation2012). Our approach is consistent with that used by Hall, Lotti, and Mairesse (Citation2009), who argue that a broader set of ICs is important for smaller firms because formal R&D inputs provide a very incomplete picture of their innovation efforts. These authors consider training, technology adoption and sales of products new to the market or firm essential components of downstream ICs. Here, organizational capital (OC) includes marketing, advertising and brand management, and some of these after-sales services are used to apply innovations in the market; see Corrado et al. (Citation2014).
The long-term panel data with a broad set of ICs allow us to analyze the overall performance effects in firms with varying market power. High-market-share firms dominate innovation activity, and their profitability from innovations is higher. Low-market-share firms have high productivity growth but low profitability with negative selection, as implied by their low initial productivity.
Section 2 provides a literature review related to R&D and the performance effects of innovations, and section 3 presents the theoretical model of firms’ decisions regarding innovative investment. Section 4 describes the data. Section 5 introduces the estimation methods, and section 6 presents the results. Section 7 concludes the paper.
2. Literature review
CDM models are suitable for analyzing how markup and retained earnings affect innovation input and output and how innovations contribute to firm performance. These models concentrate on analyzing productivity and use the following alternative measures of innovation output: share of innovative sales, dichotomous variables indicating process or production innovations and patents. Other earlier examples of this line of research using different frameworks are presented in Lööf and Heshmati (Citation2002), Lööf and Heshmati (Citation2006) and Van Leeuwen and Klomp (Citation2006). After reviewing a larger set of studies, Hall, Mairesse, and Mohnen (Citation2010) conclude that product innovation improves productivity, whereas process innovation has more ambiguous effects. Process innovations that adjust labor skills or production organization to a new level can initially be a burden to firms, negatively affecting the positive effects of product innovations. However, other papers published by Mairesse and Mohnen (Citation2010) and Mairesse and Mohnen (Citation2004) argue that process innovations directly affect the costs of production, whereas product innovations may replace existing products, resulting in a mixed effect on sales and productivity. The mixed results are likely to be explained by a high correlation between process and product innovations.
Hall, Lotti, and Mairesse (Citation2009) show that R&D investments increase the likelihood of product innovations and process innovations, thereby improving productivity in Italian SMEs. The authors use process innovations without product innovations; see also Mairesse and Mohnen (Citation2010) and Jaumandreu and Mairesse (Citation2017). In contrast, Hall, Lotti, and Mairesse (Citation2009) find that process and product innovations (analyzed separately) are nonsignificant in large Italian firms, while Griffith et al. (Citation2006), who use CIS data from 1998 to 2000, find that product innovations in Spain and the UK and process innovations in France improve productivity. No clear explanation of the country variation in the results is provided.
Recent research has exploited long-term panel characteristics and thus better controlled for heterogeneity and firm-specific factors. Innovation surveys are conducted every other year (except in Germany, where such surveys are conducted annually) and can be linked to a panel of balance sheets since product and process innovations are surveyed over the preceding two years (the survey year and the year prior); see the short panels by Parisi, Schiantarelli, and Sembenelli (Citation2006) and Lööf and Heshmati (Citation2006). More recent studies have applied two-stage least squares (2SLS) models with this panel structure; see Lööf and Heshmati (Citation2002), Lööf and Heshmati (Citation2006), Hall and Sena (Citation2017) and Bartelsman, van Leeuwen, and Polder (Citation2017). Using panel techniques is important since formal R&D and process innovations are procyclical, and therefore, productivity shocks may drive the results; for a recent study, see Anzoategui et al. (Citation2016). Using these more advanced methods, Hall and Sena (Citation2017) find that product and process innovations (analyzed separately) improve productivity in the UK. Service firms carry out less technical innovation and rely less on formal intellectual property protection, such as patents; however, these firms may rely more on informal secrecy. Musolesi and Huiban (Citation2010) include internal and corporate sources of knowledge into their set of innovation inputs and find that knowledge-intensive business services (KIBS) are as innovative as manufacturing firms. Hall, Lotti, and Mairesse (Citation2013) find underinvestment in ICT in Europe. Using the level equation and its difference form, Lööf and Heshmati (Citation2006) find that the elasticity of value added per employee with respect to innovations is the same between manufacturing and service firms. Their paper also examines how innovation has different effects on the performance of manufacturing and service firms.
Using the CDM framework, Duguet (Citation2006) describes growth in total factor productivity (TFP) analogously to growth in labor productivity, and we follow this approach. Harrison et al. (Citation2014) also explain employment growth, much of which is generated by the increased efficiency of existing technology and is possibly induced by process innovations. These authors find that process innovations displace employment more in manufacturing firms and less in service firms in the following four large economies: Germany, France, Spain and the UK. In contrast, product innovations create jobs. Van Leeuwen and Mohnen (Citation2017) analyze green innovations under the instrumental variable general method of moments (IV-GMM) framework, which is also applied here.
Hall, Lotti, and Mairesse (Citation2009) find that the impact of R&D investments on process innovation in low-technology SMEs is larger than that in high-technology SMEs. R&D-intensive low-technology firms have been suggested to absorb technologies developed elsewhere (Cohen and Levinthal Citation1989). A more in-depth analysis could explain the heterogeneity in initial productivity and analyze broad performance, including profitability, which is our aim in this study.
In the analysis in the present paper, an important question is whether innovations are motivated by a demand pull, a technology push or a desire to maintain monopoly power incumbents; see Mairesse and Mohnen (Citation2010). This analysis requires evaluation of operational performance in combination with financial performance, as emphasized by Venkatraman and Ramanujam (Citation1986). Various forms of intellectual property mechanisms are also important for maintaining profitability among innovative firms, which we do not consider here; see also Hanel (Citation2008). Antonelli and Scellato (Citation2011) analyze the methods used to obtain abnormal returns through innovation (or failure at such attempts) by referring to out-of-equilibrium conditions. Profitability allows firms to allocate resources to innovations, corresponding to feedback from firm performance to innovation (Van Leeuwen and Klomp Citation2006). In our theoretical section, the analysis includes retained earnings to finance the large fixed costs that IC accumulation requires.
Schumpeter considered these phenomena in relation to recessions in business cycles. The Schumpeterian view also considers corporate or institutional factors that are important for continuing innovation, such as firm size. In the extended Schumpeterian framework proposed by Aghion, Akcigit, and Howitt (Citation2014), a lower level of competition (higher profits) is associated with a good market position for firms but a lower incentive to invest in innovations. At some stage, a competing firm could enter the market, and its profits could fade. At this stage, with close competitors, the marginal incentives to undertake incremental investment can also be high. We observe that lower profitability (neck-to-neck competition) could then lead to a higher innovation rate. Blundell, Griffith, and Van Reenen (Citation1999) and other scholars also suggest that firms use ‘strategic pre-emptive’ innovation to prevent new firms from entering the market, causing industry profits to fall.
In the following, section 3 analyses innovation decisions in a Schumpeterian framework, where both innovations and access to new markets cause considerable fixed costs.
3. Model of firm decisions regarding innovative investment and market share under the Schumpeterian framework
We are interested in fixed costs in innovations and access to new markets that may create negative selection of high growth firms. Corrado et al. (Citation2016) suggest that innovations are a combination of increased IC accumulation related to new knowledge products that can be commercialized and new technology that presents as an increase in TFP. Here, IC costs such as related to IC capital deepening are embedded in the fixed costs in investing in innovative growth but possibly also in imitative growth with no innovations
. Mansfield, Schwartz, and Wagner (Citation1981) find that the ratio of imitation costs to innovation costs can be as high as 0.65 and that the average ratio of imitation time to innovation time is 0.7. Imitation costs, in particular, may then be explained by increased IC accumulation costs.
The models constructed by Helpman (Citation2006) and Lileeva and Trefler (Citation2010) analyze innovations along with the decision to export. Consumers have constant elasticity of substitution (CES) preferences, and the market structure involves monopolistic competition. The variable input cost is , which is the standard bundle of input costs c measured by the per efficiency unit (productivity)
. We compare low- and high-market-share firms with different pricing powers (perfect competition or monopoly pricing) and different product varieties. For low-market-share firms, the profits are
for fixed product variety i with infinitely elastic demand (p fixed) and market size A. Imitative growth
may move the firm up the productivity ladder even without major innovations that also include fixed costs
. Imitative growth
depends on the distance to frontier
, where
is the speed of adjustment, and
is the higher productivity of frontier firms. We cannot consider these innovations typical product innovations since process and product innovations are often achieved together, as discussed later. Hence, we do not rely on measuring innovations that are new to the market separately, as this information is available only for product innovations (66% of products are new to the market).
Firms with large markets have pricing power, and demand for product variety i is obtained by , where
is the additional market, and
is the elasticity of substitution between varieties i. The optimal price strategy is
, where
. In the statistical analysis below, markets A and
are exogenous (each producer of variety i holds a negligible share of the market), and input costs c are normalized to one. All indices i are dropped in the following, and Schumpeterian growth is expressed as
, where
is the fixed cost of a high market share and 1-z indicates creative destruction that occurs when a firm is replaced by a new entrant with probability z. Using the transformation
and setting variable costs at unity c = 1, the profits can be expressed as follows:
. A more heuristic model, such as that proposed by Aghion, Akcigit, and Howitt (Citation2014), separately introduces the production of ideas from R&D work. The value of ideas depends on the amount of existing innovation (with nonlinearity through ‘leaning on shoulders’ and possibly ‘stepping on toes’ when too many are engaged in R&D).
In a low-market-share firm with a fixed cost , the firm’s maximum profits depend on the availability of an additional market to enable it to become a high-market-share firm, i.e.
(1)
(1) and to make an additional innovative investment, i.e.
(2)
(2) where
are the fixed costs in imitative growth, and
is the fixed investment in innovative growth. Thus, firms become high-market-share firms (M = 1) with no innovations when
exceeds the productivity level
. Some low-market-share firms decide both to attempt to gain a high market share and to innovate
rather than not acting
and obtaining productivity
with a probability of 1-z; see also Lileeva and Trefler (Citation2010); as follows:
(3)
(3) The first term in the brackets in (1) equals the increase in profits from gaining a high market share without investing in innovation. The second and third terms in the brackets equal the increase in profits from investing in innovation in the same market as before A (second term) and new markets A* (third term).
equals the difference between the fixed costs in investing in innovative growth
and those in investing in imitative growth with no innovations
. The third term shows that innovation and a higher market share are complements. Importantly, as described in Lileeva and Trefler (Citation2010), in (3), innovations may decrease at the initial productivity level given the negative effect of initial productivity through the second term when imitative growth is the outside option
rather than zero profits. In addition, higher creative destruction z showing general risks related to the possibility of staying in the frontier discourage innovations. Hence, firms far from the frontier may engage in innovation activity only if the expected productivity growth is very high. This negative selection leads to a decrease in productivity growth during initial productivity. The following condition is required for positive innovations and an additional market share:
(4)
(4) Productivity (and hence profitability) must be high enough to compensate for the opportunity costs created by imitative growth, creative destruction z and the fixed costs. Imitative growth is also higher at a low level of initial productivity. However, pricing power yields a higher value of productivity transformation
. The negative selection arises particularly from the high fixed costs of innovative activity relative to imitation and the acquisition of a large market share. This can be also interpreted as high IC innovation costs relative to imitation (such as acquiring external IC)
and by the costs of maintaining a high market share
. Moreover, among low-productivity firms that find imitative growth profitable (
is high), only those with very high growth prospects choose to innovate.
4. Data
Statistical firm-level financial account data in Finland are linked to statistical employee data regarding incomes and occupations in Finland. These data form an unbalanced panel of manufacturing and service firms during the 1995–2013 period with a minor loss of observations; the data cover the recovery from the recession of the early 1990s and the financial crisis starting in 2008. The dataset linked with financial data is representative of manufacturing (NACE C) and market services (G, H, I, J, L, M, N) overall for firms with an average of 10 employees or more. Financial services (K) are excluded, and in these industries, less than 1% of firms are public or public cooperatives. Occupational data, including educational degrees attained, are added to these panel data to calculate the labor costs related to intangible work and the number of intangible-type workers. Process and product innovations are studied by applying a Finnish innovation survey (community innovation survey CIS) with a dichotomous value representing their presence. The analysis uses an enlarged innovation survey sample that includes gap years of approximately 2,300 firms, which cover 20% of the 11,000 total firms in manufacturing and services per year. Extending the innovation survey data from every second year to the gap years doubles the estimation sample from 17,950–35,400 firm-year observations. Including the gap years is possible since dichotomous process and product innovations receive the same value in the preceding innovation survey year (the innovations are surveyed over the current year and the previous year). The analysis is restricted to an enlarged innovation survey data panel linked to the full register data of these firms also in the gap years. The enlarged innovation survey (which includes the gap years) covers half of the observations of large firms with over 250 employees in manufacturing and services, whereas the equivalent share of SMEs (with 250 employees or fewer) is 14%. In the analysis data, the median firm has 47 workers, while the median firm in all manufacturing and services is 20 with at least 10 workers on average (this median reduces to 2.7 after including firms with fewer than 10 workers). Obtaining long-term panel data and broad intangibles from the register rather than survey data allows the use of advanced econometric methods. However, we also apply a comparison of formal R&D based on an annual R&D survey that has somewhat better coverage of R&D than the Finnish innovation survey.
Process and product innovations are highly correlated, as reported in other studies. Therefore, Griffith, Huergo, and Mairesse and Hall and Sena (Citation2017) analyze product and process innovations separately. Firms with process innovations constitute a large proportion (34%) of the firm-year observations in the innovation sample. In the enlarged innovation survey sample used in the analysis, 16% of firm-year observations have only product innovations. We separately analyze firms with only product innovations (referred to as product innovations) and firms with process innovations (one-third of which have concomitant product innovations). Product innovations (excluding those with process innovations) are sensitive to exports (used as an instrument). Process innovations (considered with or without production innovations) are more responsive to imports (used as an instrument).
The employee data in the manufacturing and services sample cover on average 700,000 employees annually between 1995 and 2013 and include a rich set of variables covering compensation, education, and profession. The data encompass the labor costs of skilled workers (annual earnings including performance-related pay) based on tertiary educated workers, who are used to evaluate intangible investment, as explained below. Nonconsolidated firm data on profits, value added, and tangible capital intensity are used. IC workers include OC workers related to management and marketing, R&D workers and ICT workers. The occupational information of the tertiary educated workers is used to calculate IC work following the International Standard Classification of Occupations (ISCO) (http://www.ilo.org/public/english/bureau/stat/isco/). Most occupations within the top three major groups (managers, professionals and technicians and associate professionals) involve IC activities contributing to the accumulation of know-how within firms.
R&D work covers R&D managers; science, engineering and health professionals (excluding telecommunication professionals); and associate professionals in science and engineering. ICT work is related to information and communication professionals and technicians as well as telecommunication engineering professionals. Organizational work is related to all types of management regardless of industry as well as professionals in business and administration, legal and related areas.
Appendix A provides a detailed description of the innovative work coding in IC work. Workers are additionally considered ICT workers in other IC occupations if their educational field (ISCED2011) is computing, OC workers if their education field is social sciences and business and R&D workers if their educational field is technical. The occupational classification is similar to that used by Squicciarini and Le Mouel (Citation2012), who use US Occupational Information Network (O*NET) data. Skilled workers do not spend all their working time on innovative purposes. in the Appendix shows that the share of this work dedicated to producing IC is assumed to be 25% among OC workers, 50% among R&D workers and 35% among ICT workers. The shares approximately follow the Innodrive FP7 described by Görzig, Piekkola, and Riley (Citation2010) and Piekkola (Citation2016) (using another functional classification, occupations are available in Finland with the categories of R&D, OC and ICT work). The share of IC work among all employees is 4.7% in OC, 1.6% in ICT, 5.6% in formal R&D and 8.2% in broad R&D. A fairly large share of organizational work is also suggested by Squicciarini and Le Mouel (Citation2012), who also analyze ICT and OC work together. Here, IC work is excluded from the employment figures to avoid double accounting. Schankerman (Citation1981), Hall and Mairesse (Citation1995), and other scholars have shown that the estimated output elasticity of R&D is downward biased without correcting for double counting.
Intermediate and capital costs are also incurred in the production of IC goods in each industry. These goods are evaluated based on the combined value added of labor costs, intermediate inputs, and tangible capital in R&D services (NACE M72). In other industries, not only IC work but also a part of the intermediate inputs and tangible capital are used to produce internal IC, which can be separated from the production of final goods. The EU Innodrive 2008–2011 sixth framework project (FP6) provides the methodology described in Piekkola (Citation2016) and Görzig, Piekkola, and Riley (Citation2010), which is used to combine IC labor inputs with other factor inputs to produce IC investment. The use of intermediate inputs and tangible capital in intangible investments as the factor multiplier is evaluated based on the benchmark of all IC-producing services (a large part of NACE J and M) and not only R&D services. Real expenditure-based investments of type IC = OC, R&D, and ICT are as follows:(5)
(5) where
represents the labor costs of IC workers in firm i multiplied by the combined multiplier
(the product of the share of work effort devoted to IC production and the factor multiplier from ). The share of work effort devoted to IC work is 20% in OC work, 50% in ICT work and 70% in R&D work. The factor multiplier is the intermediate and capital costs of one unit of innovative work set to represent the entire EU27 area and is the weighted average of the factor multipliers in Germany (40% weight), the UK (30% weight), Finland (15% weight), and the Czech Republic and Slovenia (both countries have weights of 7.5%). The combined multiplier
is 1.76 in OC wage expenses, 1.55 in R&D wage expenses, and 1.48 in ICT wage expenses. Notably, the main findings are not sensitive to the value of the constant
.
is the deflator in industry j proxied by the business services (NACE M) deflator rather than the deflator for R&D services (M72), as is commonly used in national statistical institutes.
Broad R&D refers to R&D investment evaluated based on innovative work combined with purchased R&D, as reported in the R&D survey. Formal R&D (the sum of internal and external survey R&D) is a standard measure of innovation input. The R&D work measure of R&D may differ from formal R&D in its effects. shows that the total broad R&D per total employee (blue line) is on average approximately 12 thousand 2010€ per employee, while the total formal R&D per total employee (red dashed line) increased over time to approximately 18 thousand 2010€ per employee by 2007. This amount is more than the average tangible investment of 13 thousand 2010€ per employee.
Figure 1. R&D, OC and ICT investments per employment between 1995 and 2012 in the enlarged innovation survey sample in thousands 2010€.
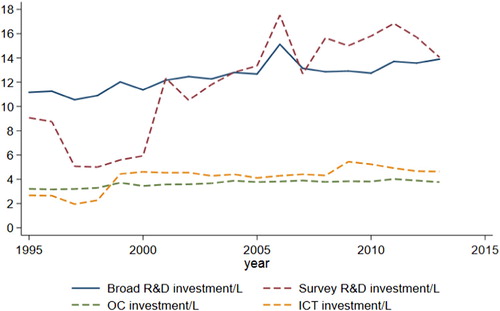
The sum of the OC and ICT investment intensity is approximately 3.7 thousand 2010€ and 4 thousand 2010€, respectively. Organizational or firm-specific human capital and ICT are the largest subcategories of intangible investment in many other studies (Van Ark et al. Citation2009; Bloom and Van Reenen Citation2010; Piekkola Citation2016).
shows a summary of the variables; the final column shows the share of firms with positive values used in the calculation. The value added, which on average is 104 thousand 2010€ per employee, includes IC investment. Finland is a small open economy, and the average value of exports and import per employee are close to the value of value added created. One-fifth of firms are foreign owned, and half of firms are a part of a larger group. The number of employees has a mean value of 149 and a median value of 40. Summary shows that the average productivity growth (logarithmic difference of the value added per employee) is slightly positive (0.5%) during this period. Profitability is measured by the log of return on assets (ROA), which is measured by the operating income per total assets (not by the net income per total assets, which has many more negative values). Extreme observations at the 1% and 99% levels of ROA are removed, and the average ROA is 4.9%. Formal R&D per employee is approximately 18 thousand 2010€. However, only 36% of firm observations have formal R&D, whereas 84% have broad R&D with 9 thousand 2010€ (occupational R&D/L + external formal R&D/L). The market share in sales is calculated by NACE 3-digit industries. The overall average dividing line between small- and high-market-share firms is the median value of the market share in sales, i.e. 0.8% in manufacturing and 0.3% in business services (which are usually smaller in size).
Table 1. Summary table.
ICs are concentrated in IC-intensive firms, but the large differences between the mean and median values are also explained by the omission of IC-type work from the employment figures. in the Appendix shows that service firms invest more intensively in OC (median value of 5.2 thousand 2010€ per employee) and ICT (median value of 1.5 thousand 2010€ per employee) than manufacturing firms (median values of 2.2 thousand 2010€ and 0.4 thousand 2010€, respectively). Service firms (34% of all sample firms) display approximately double the amount of formal R&D per employee, with a median value of 9.2 thousand 2010€, compared to manufacturing firms, with a median value of 4.4 thousand 2010€, and have more SMEs (a median size of 30 employees compared to 48 in manufacturing). However, only 24% of service firms report any formal R&D, while 44% of manufacturing firms do. Among service firms, the broad R&D coverage of 83% is almost the same as that among manufacturing firms, i.e. 87%, with median values of 4 thousand 2010€, but again, this coverage is more concentrated in some service firms. Some services can also be labeled IC-producing services (J, L, M) because they provide IC intermediate input to other companies; see Piekkola (Citation2018). Service firms also rely more on imports (an instrument for R&D in process innovations), while manufacturing firms rely more on exports (an instrument for R&D in product innovations).
5. Estimation of innovation output and firm performance
The CDM model proposed by Crepon, Duguet, and Mairessec (Citation1998) corrects for endogeneity issues in various steps. In the original model, the first step adjusts for sample bias in the innovation input (ICs), and the second step explains innovation output with innovation inputs, which are instrumented by the first-step estimation. Here, we do not apply Heckman estimation to adjust for sample bias since the non-zero values of broad R&D (our preferred way to measure R&D) cover almost the entire sample, with 83% of firm-year observations. We use instrumental probit estimation to correct for endogeneity in the innovation input. Finally, Woolridge’s (Citation2010, 939) IV-2SLS is used to predict innovations (process innovations or product innovations), and these are used in the final step as instruments rather than as regressors, as would be the case in CDM; see below.
In general, the excluded instruments are assumed to have no direct effect on the innovation output and only an indirect effect through innovation inputs. The endogenous variables are R&D per employment and tangible investment per employment (K/L), and the exogenous variables are ICT per employment. All of these can be considered ‘fixed costs’ in the theoretical model that enter the decision to innovate in (4). The final step is productivity growth estimation following an IV-GMM estimation using the Wooldridge (Citation2010) modification with cluster-robust standard errors. Productivity is measured by value added per employee, where value added includes the user cost of R&D, OC and ICT (with a rental value of 4% and a depreciation value of 20% for OC, 33% for ICT and 15% for R&D).The procedure is performed in two steps, as follows:
(a) Estimation of the IV probit ML to obtain the fitted probabilities of process innovations and product innovations in firms i over years t.
(6)
(6) where the explanatory variables of dichotomous innovations
include a matrix of endogenous
, exogenous
and control variables
;
is a vector of excluded instruments; and the equation for
is written in the reduced form. Residuals
and
are normalized to one. Instead of
, we observe
(7)
(7) The order condition requires that the number of exogenous and control variables not be less than the number of endogenous variables. The likelihood function of ML is straightforward. Similar to Van Leeuwen and Mohnen (Citation2017), the lagged values of predicted innovations (eco-innovations in Van Leeuwen and Mohnen) are used to ensure exogeneity.. The exogenous variables include K/L, employment (as a proxy for firm size), retained earnings per employment and its square, all in logs and lagged. The control variables are foreign owned, a part of a group, 143 NACE 3-digit industries and year dummies.
The excluded instruments of the log of R&D per employment and the log of K/L include international trade or service intermediate inputs per employee, all of which are lagged, and the dummy for the greater Helsinki area. Regional dummies, such as the dummy for the greater Helsinki area, are important instruments in explaining the productivity effects of public R&D subsidies, as described by Piekkola (Citation2007). External demand shocks, such as exports, cause exogenous variation in the innovation inputs used in product innovations. Imports and service intermediate inputs are used instead of exports in the innovation model explaining process innovation. Imports and service intermediate inputs can be alternatives for the production and R&D needed for process innovations. Hall, Lotti, and Mairesse (Citation2009) also use dummies for the presence of European, international or domestic competitors related to trade. Keller and Yeaple (Citation2009) find only weak evidence of technical import spillovers; thus, these spillovers may be more closely related to the use of R&D than to productivity. The instrument includes the log K/L lagged up to the second period.
(b) Estimation of productivity growth by IV-GMM including lagged predicted occurrences of process and product innovations as instruments for process and product innovations. The generalized method of moments (GMM) is a generic method used to estimate parameters in statistical models and is robust against arbitrary heteroskedasticity and intracluster correlation. As discussed, we follow Woolridge’s (Citation2010, 939) IV-2SLS to use predicted innovations (predicted process or product innovations) as an instrument; see also Musolesi and Huiban (Citation2010).
The generalized method of moments (GMM) IV-GMM estimator of log productivity (value added per employment) growth applied here also includes all lagged values of the explanatory variables as instruments:(8)
(8) where
is the growth of value added, and
is the matrix of k explanatory variables. IV-GMM defines matrix
, where
, and the excluded instruments of the lagged occurrence of innovations and the growth of capital investment are two-period lagged predicted occurrences of process and product instruments and the log growth of capital investment lagged up to the two periods. The
instruments create a set of
moments
, where each
is an
-vector. GMM considers each
moment equation a sample moment, which is estimated by averaging over N as follows:
(9)
(9) GMM estimates
solve this equation. The productivity growth estimation includes the lagged log productivity growth and log of employment growth, specifically the latter because most employment savings originate from efficiency improvements in old technology. The lagged innovations and log growth of capital investment per employment are instrumented by two-period lagged predicted occurrences of innovations and log K/L lagged up to the second period to ensure exogeneity. Lags are introduced because of the long-term panel structure that considers that a longer time may be needed for innovations to lead to an increase in productivity growth. All estimations include 23 NACE 1-digit and year dummies.
We also use a similar IV-GMM estimation to explain profitability. An essential feature is that profitability (ROA) is explained relative to the median value of ROA in the NACE 3-digit industry instead of its growth, which is defined as ΔROA; see Eisenberg, Sundgren, and Wells (Citation1998). ΔROA is more relevant than its counterparts. ROA highly varies among industries, and the alternative would have to include book values as an explanatory variable. The regressors include the log of employment rather than the log of employment growth. The lagged innovations and log of K/L are instrumented by two-period lagged predicted occurrences of innovations, as before, and the log of K/L lagged up to the second period.
6. Estimation results
We first analyze all firms jointly without separating the low- and high-market-share firms, but we compare the models with broad R&D to those with formal R&D as innovation inputs. shows the marginal effects from the innovation output estimations using either broad R&D or formal R&D as inputs. The innovation equation includes lagged ICT investments that enable business processes and new work practices and are a part of the technological environment found to be important by Van Leeuwen and Klomp (Citation2006). Van Ark (Citation2016) also argues for a shift from ICT investment to ICT services, which is measured here given that digitalization is entering its deployment stage.
Table 2. IV probit regression of process and product innovation output, 1996–2013.
Columns 1–2 apply formal R&D, and columns 3–4 apply broad R&D with the excluded instruments discussed in the previous section. The Wald test of exogeneity rejects the null hypothesis of exogeneity (rho = 0); thus, the error terms in the probit and instrument regressions of endogenous R&D are correlated, and instrumenting the endogenous variable is necessary.
According to , as innovation inputs, formal R&D per employee and broad R&D per employee enhance process and product innovations. Broad R&D has coefficients that are similar to but stronger than those of formal R&D, with common determining factors (coefficients in the first-step instrument estimations are not reported; see for the full table when broad R&D is considered separately for low- and high-market-share firms). Broad R&D has wide coverage, with 30% to 100% higher marginal effects. Therefore, broad R&D emphasizes the significance of innovation activity in increasing productivity growth. The marginal effects of approximately 0.2–0.3 are consistent with the magnitudes reported by Griffith et al. (Citation2006) and Mairesse and Mohnen (Citation2004) but are lower than the 0.5 value reported by Hall, Lotti, and Mairesse (Citation2009) and greater than the 0.1 value of process innovations reported in Hall and Sena (Citation2017). Notably, earlier approaches used in the 2000s relied on cross-sectional comparisons in which the elasticities were expected to be higher because they were subject to upward bias caused by unobserved firm characteristics.
In , formal R&D better captures the firm characteristics of being part of group or being foreign owned (since their direct coefficients are small). Foreign-owned firms and firms that are a part of a group engage in less innovation after all variables are controlled for. Finland does not appear to have performed very well in absorbing foreign innovative firms. ICT per employee is also an important determinant of R&D activity (see first-step results reported in in Appendix A for later analysis), but the direct effects on innovation are not significant. ICT services are concentrated in services and do not proxy software or databases very well. Firms that have retained earnings appear to create more innovations, highlighting the importance of financial constraints.
The following step applies labor productivity growth and profitability estimations. In , the first three columns show the productivity effects using formal R&D, and the final three columns show these effects using broad R&D. Given the endogeneity of innovations and the considerable time before new innovations lead to higher productivity, the model uses lagged innovations and instruments these innovations with two-period lagged predicted occurrences of process and product innovations. The K/L growth is also endogenous, and the model includes first- and two-period lags of tangible investment per employment to control for productivity shocks (see notes in ). The Hansen J statistic p-values show that the instruments are generally valid at the 5% confidence level. The Kleibergen-Paap Wald p-value shows that the models are not underidentified.
Table 3. GMM productivity growth estimates (in log), 1999–2013
The general conclusion is that process and product innovations have a positive effect on productivity growth regardless of whether formal or broad R&D is used as the innovation input. Process innovations increase productivity growth by approximately 25% (the strongest effect is observed using broad R&D). Product innovations increase productivity growth by 25–40%, and the higher estimates are observed using broad R&D as the instrument. Since the estimates are the highest using broad R&D as the input in the earlier step 1, other technical innovation activities that do not constitute formal R&D according to the Frascati definition of the OECD appear to create a considerable share of the innovative value added. Notably, we applied separate trade instruments for process innovations and product innovations in the step 2 probit estimations; thus, the instrumented predicted innovations in the third-step productivity growth equation are less correlated. Therefore, shows that the productivity growth estimates of process and product innovation remain approximately the same regardless of whether they are considered separately or together.
The negative coefficient of lagged productivity suggests a high convergence rate of 20% relative to the rate of approximately 2% found in country-level analysis, such as that performed by Barro (Citation2015). Negative selection also drives the results besides imitative growth. The growth of both tangible capital/L and employment has a negative effect on productivity growth. The causal effect is likely due to efficiency improvements in old technology, which create employment and tangible investment savings.
In addition to the operational performance indicators, we consider financial performance indicators ROA (proxied by operating income per total asset) and operating income per employee. shows the profitability (ROA) effects of innovations compared to the median value in the industry ΔROA. The lagged log of innovation output and log K/L (in level) are instrumented by the second-period lagged predicted occurrence of innovation and the lagged log of K/L up to the second period. In most cases, the set of instruments passes the test of the Hansen J statistic. shows that process innovations may or may not increase while product innovations always decrease relative profitability (ΔROA). The ambiguity in process innovations arises from the opposite effects on low- and high-market-share firms (see ) or manufacturing and services (see ). Finally, profits increase with the tangible investment intensity.
Table 4. GMM profitability estimates (ΔROA) of formal and broad R&D.
Venkatraman and Ramanujam (Citation1986) consider market share position and new product introduction as good operational performance indicators. Large-market-share firms have on average 46 thousand 2010€ R&D per employee, whereas low-market-share firms have 10 thousand 2010€ R&D per employee. The shares of periods with process innovations is 46% and product innovations 17% in large-market-share firms; these figures are 10% and 15%, respectively, in low-market-share firms. Innovations, especially in developing new products, appear to create a significant boost for growth but likely are explained to a large extent by imitation and negative selection in low-market-share firms. Subsequently, we separately analyze the low- and high-market-share firms and show some clear differences, especially in earning profits from innovations. We use broad R&D only because this variable more comprehensively covers SMEs and services in general (using formal R&D, the results—available upon request from the authors—are qualitatively similar). in the Appendix reports the IV probit estimates including the first-step instrument estimations in explaining broad R&D. R&D is observed to encourage more process and product innovations in high-market-share firms. As before in , the effects of R&D on process and product innovations are very similar using broad R&D. High-market-share firms are typically large and R&D intensive and also more likely to have both process and product innovations (categorized as firms with process innovations here). Furthermore, product innovations by high-market-share firms are more likely to be new to the market than those of small-market-share firms.
shows the productivity growth analysis of firms divided into those with small and high market shares.
Table 5. GMM productivity growth estimates of low- and high-market-share firms using broad R&D (in log).
The negative coefficient of lagged productivity in the low-market-share firms is somewhat higher than that in the high-market-share firms, which can be first explained by imitative growth (see EquationEquation (3(3)
(3) )). The variation between low- and large-market-share firms in innovation coefficients is larger than the variation between process and product innovation coefficients within low- and high-market-share firms. Following negative selection, low-market-share firms have higher productivity growth from innovation activity. Based on the theoretical model, negative selection is also positively related to creative destruction (z), but we do not have a proxy to control for this variable.
In Schumpeterian growth, preemptive behavior can also be behind the lower productivity returns of high-market-share firms. Large firms invest more in innovations to hinder new competitors from entering the market. Despite the higher productivity growth in low-market-share firms, the productivity improvement may not improve profitability because the initial productivity is low. shows the profitability effects of innovations by market share.
Table 6. GMM ΔROA estimates of low- and high-market-share firms using broad R&D.
The profitability effects on low- and high-market-share firms are opposite. Process and product innovations improve profitability only in high-market-share firms, whereas as shown in , the profitability effects on all firms are more or less ambiguous or negative for product innovations. Product innovation now improves profitability among high-market-share firms, albeit less than process innovations (that may also include simultaneous product innovations). The profitability effects of product innovations were always negative when all firms are considered in . The diverging effect on profitability depending on the market share is our strongest support for negative selection among low-market-share firms. In the estimation sample of approximately 31,000 firm-year observations, innovations new to the market (not only to the firm) constitute approximately 58–60% of the firm-year observations. Such observations are indeed more frequent in high-market-share firms (42%) than in low-market-share firms (30%). Hence, the quality of innovations appears better in high-market-share firms regardless of the type of innovation. In contrast, Hall and Vopel (Citation1996) find that small firms have more radical innovations. Finally, shows that the positive effects of tangible investments on profitability are limited to low-market-share firms. Tangible capital investment may better result in a relative advantage on the market for low-market-share firms, i.e. when pricing power is low.
As a robustness check, we also use the log of retained earnings (operating income) per employee as a proxy for profitability. The estimation results are shown as in Appendix A. The profitability effects of innovations are qualitatively the same as for ΔROA in , though they are not always significant. Product innovations may not decrease retained earnings per employee for low-market-share firms, and process innovations have insignificant positive effects on retained earnings per employee for large-market-share firms.
in Appendix using broad R&D as the innovation input shows that the main results are also consistent when we separately analyze manufacturing firms (60% of all firms), except that in large-market-share manufacturing firms, process innovations decrease ROA, while the effect is positive when large-market-share manufacturing and service firms were considered together. In high-market-share services, product innovations decrease profitability regardless of whether it is measured by ROA or by retained earnings per employee, although profitability improves when manufacturing and services are considered together. summarizes the main estimation results.
Table 7. Main productivity growth and profit outcomes of innovations.
We can conclude that high-market-share firms may allocate resources to innovations to maintain their monopoly position but are able to generate profits from their innovations. Large-market-share firms are typically large with less imitative growth and negative selection. Innovations are more profitable among firms that have market power. The industry-specific analysis suggests that product innovations are more important for Schumpeterian growth in manufacturing, whereas process innovation plays the same role in services.
7. Conclusion
This paper uses register-based data to broadly measure R&D, enabling a better analysis of small-market-share firms. Other technical innovation activities that do not constitute formal R&D create a considerable share of the value added, and especially among SMEs as suggested by Hall, Lotti, and Mairesse (Citation2009). The data coverage of low-market-share firms is much larger when we use register-based R&D. However, both formal R&D and broad R&D lead to similar results; nonetheless, the results of broad R&D appear more consistent when both types of innovation are considered, as shown in and .
This paper introduced a theoretical model in which ICs cause high fixed costs. The innovation system was analyzed with the following two sources of heterogeneity: initial productivity and whether the firm has market power that can lead to negative selection with higher productivity growth at low initial productivity and market shares. High fixed costs in innovation and increased market share encourage firms with low initial productivity to accept innovations with the highest productivity growth prospects, especially among low-market-share firms. Low initial productivity leads to modest if not negative profits, which contrasts the finding for firms with good operational performance indicated by large market shares. The profitability divergence of innovations among low- and high-market-share firms is our strongest indication of negative selection in innovations.
Market power and new product (or process) introductions are hence good operational performance indicators that also indicate that innovations lead to improved profitability. Further, our analysis suggests that product and process innovations can be qualitatively different in manufacturing and services. In large-market-share manufacturing firms, process innovations have ambiguous effect on profitability (ROA decreases, but retained earnings per employee can be higher), while in large market-share services, product innovations have negative effects on profitability (both ROA and retained earnings decrease). One caveat of our analysis is that innovation data are not comprehensive for SMEs in that firms that have completed the survey before and have R&D are more likely to be selected in the sample in the following survey period(s). Given that only more qualified SMEs are selected in R&D and innovation surveys, many SMEs may not have the competence to be engaged in any innovation activity in the first place. However, our broad R&D had better coverage than formal R&D (positive formal R&D was reported in only 24% of service firms that completed the innovation survey).
An important policy implication of our analysis still is that formal R&D and broad R&D lead to nearly the same results, so survey R&D only can lead to the same policy results. An important reason for this is that export activity was used as an instrument in R&D activity engaged in product innovations, and import activity is more important in R&D used as input in process innovations. This was also the way to have independent variation between product and process innovations.
Acknowledgement
This paper relies on working paper D2.4 A framework on firm size, market entry and growth in research funded by EU Horizon 2020 GLOBALINTO project for years 2019–2022 with title ‘Capturing the value of intangible assets (IAs) in micro data to promote the EU's growth and competitiveness’, project number 822229. GLOBALINTO is a continuation to FP7 INNODRIVE project (www.innodrive.org) that developed the Innodrive-methodology in measuring intangible assets at the firm level. In 2013, Horizon2020 NET4SOCIETY chose Innodrive among the seven SSH projects in FP6 and FP7 that had a considerable impact – not only on research but also on policy, society or economy.
Disclosure statement
No potential conflict of interest was reported by the authors.
References
- Aghion, Philippe, Ufuk Akcigit, and Peter Howitt. 2014. “What do we Learn From Schumpeterian Growth Theory?” In Handbook of Economic Growth, 515–563. Amsterdam: Elsevier.
- Antonelli, Cristiano, and Giuseppe Scellato. 2011. “Out-of-equilibrium Profit and Innovation.” Economics of Innovation and New Technology 20 (5): 405–421.
- Anzoategui, Diego, Diego Comin, Mark Gertler, and Joseba Martinez. 2016. Endogenous Technology Adoption and R&D as Sources of Business Cycle Persistence. Chicago: National Bureau of Economic Research.
- Barro, Robert J. 2015. “Convergence and Modernization.” Economic Journal 125 (585): 911–942.
- Bartelsman, Eric, George van Leeuwen, and Michael Polder. 2017. “CDM Using a Cross-Country Micro Moments Database.” Economics of Innovation and New Technology 26 (1–2): 168–182.
- Bloom, Nicholas, and John Van Reenen. 2010. “Why do Management Practices Differ Across Firms and Countries?” The Journal of Economic Perspectives 24 (1): 203–224.
- Blundell, Richard, Rachel Griffith, and John Van Reenen. 1999. “Market Share, Market Value and Innovation in a Panel of British Manufacturing Firms.” The Review of Economic Studies 66 (3): 529–554.
- Cohen, Wesley M, and Daniel A Levinthal. 1989. “Innovation and Learning: the two Faces of R & D.” The Economic Journal 99 (397): 569–596.
- Corrado, Carol, Jonathan Haskel, Cecilia Jona-Lasinio, and Massimiliano Iommi. 2014. “Intangibles and industry productivity growth: Evidence from the EU.” Manuscript available at www.intan-invest.net.
- Corrado, Carol, Jonathan Haskel, Cecilia Jona-Lasinio, and Massiamo Iommi. 2016. Intangible investment in the EU and US before and since the Great Recession and its contribution to productivity growth. EIB Working Papers No. 2016/08.
- Crepon, Bruno, Emmanuel Duguet, and Jacques Mairessec. 1998. “Research, Innovation And Productivity: An Econometric Analysis At The Firm Level.” Economics of Innovation and New Technology 7 (2): 115–158. doi:10.1080/10438599800000031.
- Duguet, Emmanuel. 2006. “Innovation Height, Spillovers and TFP Growth at the Firm Level: Evidence From French Manufacturing.” Economics of Innovation and New Technology 15 (4–5): 415–442.
- Eisenberg, Theodore, Stefan Sundgren, and Martin T. Wells. 1998. “Larger Board Size and Decreasing Firm Value in Small Firms.” Journal of Financial Economics 48 (1): 35–54.
- Görzig, Bernd, Hannu Piekkola, and Rebecca Riley. 2010. Production of Own Account Intangible Investment: Methodology in Innodrive Project, Innodrive Working Paper No 1.
- Griffith, Rachel, Elena Huergo, Jacques Mairesse, and Bettina Peters. 2006. “Innovation and Productivity Across Four European Countries.” Oxford Review of Economic Policy 22 (4): 483–498.
- Griffith, Rachel, Stephen Redding, and Jon Van Reenen. 2004. “Mapping the two Faces of R&D: Productivity Growth in a Panel of OECD Industries.” Review of Economics and Statistics 86 (4): 883–895.
- Hall, Bronwyn H., Francesca Lotti, and Jacques Mairesse. 2009. “Innovation and Productivity in SMEs: Empirical Evidence for Italy.” Small Business Economics 33 (1): 13–33.
- Hall, Bronwyn H., Francesca Lotti, and Jacques Mairesse. 2013. “Evidence on the Impact of R&D and ICT Investments on Innovation and Productivity in Italian Firms.” Economics of Innovation and New Technology 22 (3): 300–328.
- Hall, Bronwyn H., and Jacquess Mairesse. 1995. “Exploring the Relationship Between R&D and Productivity in French Manufacturing Firms.” Journal of Econometrics 65 (1): 263–293.
- Hall, Bronwyn H., Jacques Mairesse, and Pierre Mohnen. 2010. “Measuring the Returns to R&D.” Handbook of the Economics of Innovation 2: 1033–1082.
- Hall, Bronwyn H., and Vania Sena. 2017. “Appropriability Mechanisms, Innovation, and Productivity: Evidence From the UK.” Economics of Innovation and New Technology 26 (1–2): 42–62.
- Hall, Bronwyn H., and Katrin Vopel. 1996. “Innovation, Market Share, and Market Value.” In Strasbourg, France: Prepared for the International Conference on the Economics and Econometrics of Innovation, The European Parliament.
- Hanel, Petr. 2008. “The use of Intellectual Property Rights and Innovation by Manufacturing Firms in Canada.” Economics of Innovation and New Technology 17 (4): 285–309.
- Harrison, Rupert, Jordi Jaumandreu, Jacques Mairesse, and Bettina Peters. 2014. “Does Innovation Stimulate Employment? A Firm-Level Analysis Using Comparable Micro-Data From Four European Countries.” International Journal of Industrial Organization 35: 29–43.
- Helpman, E. 2006. “Trade, FDI, and the Organization of Firms.” Journal of Economic Literature 44 (3): 589–630.
- Jaumandreu, Jordi, and Jacques Mairesse. 2017. “Disentangling the Effects of Process and Product Helpman (2006)Innovation on Cost and Demand.” Economics of Innovation and New Technology 26 (1–2): 150–167.
- Keller, Wolfgang, and Stephen R. Yeaple. 2009. “Multinational Enterprises, International Trade, and Productivity Growth: Firm-Level Evidence from the United States.” The Review of Economics and Statistics 91 (4): 821–831.
- Lileeva, Alla, and Daniel Trefler. 2010. “Improved Access to Foreign Markets Raises Plant-Level Productivity … For Some Plants.” Quarterly Journal of Economics 125 (3): 1051–1099.
- Lööf, Hans, and Almas Heshmati. 2002. “Knowledge Capital and Performance Heterogeneity:: A Firm-Level Innovation Study.” International Journal of Production Economics 76 (1): 61–85.
- Lööf, Hans, and Almas Heshmati. 2006. “On the Relationship Between Innovation and Performance: A Sensitivity Analysis.” Economics of Innovation and New Technology 15 (4–5): 317–344.
- Mairesse, Jacques, and Pierre Mohnen. 2004. “The Importance of R&D for Innovation: a Reassessment Using French Survey Data.” The Journal of Technology Transfer 30 (1–2): 183–197.
- Mairesse, Jacques, and Pierre Mohnen. 2010. “Using Innovation Surveys for Econometric Analysis.” Handbook of the Economics of Innovation 2: 1129–1155.
- Mansfield, E., M. Schwartz, and S. Wagner. 1981. “Imitation Costs and Patents: An Empirical Study.” Economic Journal 91 (364): 907–918.
- Musolesi, Antonio, and Jean-Pierre Huiban. 2010. “Innovation and Productivity in Knowledge Intensive Business Services.” Journal of Productivity Analysis 34 (1): 63–81.
- Parisi, Maria Laura, Fabio Schiantarelli, and Alessandro Sembenelli. 2006. “Productivity, Innovation and R&D: Micro Evidence for Italy.” European Economic Review 50 (8): 2037–2061.
- Piekkola, Hannu. 2007. “Public Funding of R&D and Growth: Firm-Level Evidence From Finland.” Economics of Innovation and New Technology 16 (3): 195–210.
- Piekkola, Hannu. 2016. “Intangible Investment and Market Valuation.” Review of Income and Wealth 62 (1): 28–51.
- Piekkola, Hannu. 2018. “Broad-based Intangibles as Generators of Growth in Europe.” Economics of Innovation and New Technology 27 (4): 377–400. doi:10.1080/10438599.2017.1376170.
- Piekkola, Hannu, Mikko Lintamo, Rebecca Riley, Catherine Robinson, Kurt Geppert, Bernd Görzig, Anne Neumann, et al. 2011. “Firm-level intangible capital in six countries: Finland, Norway, the UK, Germany, the Czech Republic, Slovenia.” In Intangible Capital - Driver of Growth in Europe, edited by Hannu Piekkola, 63–95. Proceedings of the University of Vaasa No. 167. Vaasa.
- Schankerman, Mark. 1981. “The Effects of Double-Counting and Expensing on the Measured Returns to R&D.” The Review of Economics and Statistics 63 (3): 454–458.
- Schumpeter, Joseph A. 1942. Socialism, Capitalism and Democracy. New York: Harper and Brothers.
- Schumpeter, Joseph A. 1947. “The Creative Response in Economic History.” The Journal of Economic History 7 (2): 149–159.
- Squicciarini, Mariagrazia, and Marie Le Mouel. 2012. Defining and Measuring Investment in Organisational Capital Using US Microdata to Develop a Task-based Approach. In OECD Science, Technology and Industry Working Papers. Paris.
- Van Ark, Bart. 2016. “The Productivity Paradox of the new Digital Economy.” International Productivity Monitor 31: 3.
- Van Ark, Bart, Janet X Hao, Carol Corrado, and Charles Hulten. 2009. “Measuring Intangible Capital and its Contribution to Economic Growth in Europe.” EIB Papers 14 (1): 62–93.
- Van Leeuwen, George, and Luuk Klomp. 2006. “On the Contribution of Innovation to Multi-Factor Productivity Growth.” Economics of Innovation and New Technology 15 (4–5): 367–390.
- Van Leeuwen, George, and Pierre Mohnen. 2017. “Revisiting the Porter Hypothesis: an Empirical Analysis of Green Innovation for the Netherlands.” Economics of Innovation and New Technology 26 (1–2): 63–77.
- Venkatraman, Natarjan, and Vasudevan Ramanujam. 1986. “Measurement of Business Performance in Strategy Research: A Comparison of Approaches.” Academy of Management Review 11 (4): 801–814.
- Wooldridge, Jeffrey M. 2010. Econometric Analysis of Cross Section and Panel Data. Second edition. Cambridge, MA: MIT Press.
Appendices
Appendix A. Measurement of intangible capital (IC) and tables
Occupation data are used to evaluate the innovative labor input in IC activities. The following table shows the innovation occupations chosen using ISCO08 3-digit coding (the earlier ISCO2001 version is shown in parentheses). An important additional identifier of the different types of IC work is the use of educational information to reallocate the type of IC work. Workers in the educational field ISCED2011 computing are reallocated to ICT work, and workers with the educational field code social sciences and business (at the 1-digit and 2-digit levels) are reallocated to OC work if the occupation suggests that they are other IC workers (ICT or R&D worker).
Organizational work
Managing directors and chief executives 112 (112)
Administrative and commercial managers 12 (123 all)
Services and administration managers 121, Sales, marketing and development managers 122
Managing, mining, construction and distribution managers 13, 131 (122)
Manufacturing, mining, construction and distribution managers 132 (122)
Professional services managers 134 (122)
Teaching professionals 23 (23)
Business and administration professionals 24 (241 all)
Finance professionals 241, Administration professionals 242, Sales, marketing and public relations professionals 243
Legal, social, cultural and related associate professionals 34 (all) (242)
Legal, social and religious associate professionals 341 (343), Sport and fitness workers 342 (347), Artistic, cultural and culinary artist professionals, 343 (347)
Business and administration associate professionals 33 (excluding 335):
Financial and mathematical associate professionals 331 (343), Sales, purchasing agents and brokers 332 (342), Services agents 333 (342)
Administrative and specialized secretaries 334 (332)
OC work is reclassified as R&D work if the educational field code is not social sciences and business and ISCO3 in 1, 12, 13, 23, 24, and 34.
OC work is reclassified as ICT work if the educational code is ISCED2011 computing in 1, 12, 13, 23, 24, and 34.
R&D work
Technical and mathematical work professionals
R&D managers 1223 (1237)
Science and engineering professionals 21 (excluding telecommunication engineering 2153)
Physical and earth science professionals 211 (211), Engineering professionals 212 (212) Mathematicians, statisticians, life science professionals 213, 214 (212), Electrical, electronic engineering 2151, 2152 (212), Architects, planners 216 (212)
Health professionals 22
Medical doctors 221 (222), Nursing and midwifery professionals 222 (223), Other health professionals 226 (223), 22 (ISCO3 not available)
Science and engineering associate professionals 31
Physical and engineering science technicians 311 (311), Life science technicians and related associate professionals 314 (321)
R&D work is reclassified as OC work if the educational field code is social sciences and business and ISCO3 in 2, 21, 22, 3, 31, and 32.
R&D work is reclassified as ICT work if the educational field code is International Standard Classification of Education (ISCED2011) computing and ISCO3 in 2, 21, 22, 3, 31, and 32.
ICT work
ICT managers 133 (1236)
Telecommunication engineering 2153 (213)
Information and communications technology professionals 25
Information and communications technicians 35 (312)
Nursing and midwifery associate professionals 226 (322)
The share of workers who produce intangible goods is set at 20% for OC occupations, 70% for R&D occupations, and 50% for ICT occupations. The share of OC occupations is approximately half of that in the Innodrive-based calculation reported by Piekkola (Citation2016) in Finland, which applies more precise functional occupations (functions divided into management, marketing, R&D, etc.) and task quality (IC occupations are at the expert level or higher in each functional occupation category). The low share of OC occupations of 20% is also supported by Squicciarini and Le Mouel (Citation2012), who argue that day-to-day and administrative activities requiring general skills rather than IC work are common among management tasks.
Eq. (4) in the main text shows how the use of intermediate inputs and tangible capital in intangible investments is evaluated based on the benchmark of all IC-producing services. summarizes in (4) the combined multiplier (the product of the share of effort devoted to IC production and the factor multiplier).