
Abstract
Contemporary aircraft cockpits rely mostly on audiovisual information propagation which can overwhelm particularly novice pilots. The introduction of tactile feedback, as a less taxed modality, can improve the usability in this case. As part of a within-subject simulator study, 22 participants are asked to fly a visual-flight-rule scenario along a predefined route and identify objects in the outside world that serve as waypoints. Participants fly two similar scenarios with and without a tactile belt that indicates the route. Results show that with the belt, participants perform better in identifying objects, have higher usability and user experience ratings, and a lower perceived cognitive workload, while showing no improvement in spatial awareness. Moreover, 86% of the participants state that they prefer flying with the tactile belt. These results suggest that a tactile belt provides pilots with an unobtrusive mode of assistance for tasks that require orientation using cues from the outside world.
1. Introduction
Flying an airplane is considered one of the most cognitively challenging tasks (Wickens, Citation2008a). Even though experience and increasing automation can make some parts of a pilot’s job routine procedures, pilots are still required to constantly adapt and react to a changing environment and suddenly occurring events (Vidulich & Tsang, Citation2012). Signals and alarms may require a sudden and unexpected shift in priorities, while requiring pilots to uphold communication with other crew members as well as personnel on the ground (Helmreich & Foushee, Citation2010). On top of these additional tasks that pilots have to attend to, the aircraft must be navigated to the intended destination in a stable and safe state (Wickens, Citation2002). Considering this high workload, especially trainees and rookie pilots who lack experience in handling challenging and unfamiliar situations may benefit from further assistance.
The most common way of presenting information to users is via the visual sense (Burke et al., Citation2006). The cockpit of an aircraft is no exception to this (Liggett, Citation2009). For example, a multitude of displays and instruments are installed and deployed alongside digital and paper maps to guide the pilots. The auditory modality is also used extensively in aviation, for example by alarm sounds, automated call-outs from the radio altimeter or air traffic control (ATC) communication. This poses challenges for the pilot, in particular in high workload scenarios, as demonstrated by Dehais et al. (Citation2014), who showed that pilots missed auditory alerts when a workload increase by a windshear event was introduced in a simulated landing.
When different information is presented using the same modality or sensory channel, the mental demand for perceiving and processing the information can exceed the capacity of a pilot’s mental resources, and lead to a decrease in performance (Basil, Citation2012; Wickens, Citation2008b). Conversely, providing information across different modalities can lower the interfering demand for the mental resources required for processing the information provided on the single sensory channel. Thus allowing pilots to absorb the information more efficiently at levels of residual capacity in mental resources (Wickens, Citation2008b).
Given this high usage of the auditory and visual modes in aviation, there seems to be untapped potential in providing further assistance and guidance using the tactile mode (McGuirl & Sarter, Citation2001). The efficiency of tactile equipment for such assistance has already been demonstrated in a variety of other use cases, such as car driving (Hogema et al., Citation2009; Van Erp & Van Veen, Citation2004), navigating through terrain on foot (Elliott et al., Citation2010), or as an assistive device for the blind (Velázquez, Citation2010).
This article investigates the potential of the tactile mode for guidance in a general aviation context. We contribute to the existing body of work by reporting on a study, in which a tactile belt was utilized to support pilots in a typical task they face when flying under visual-flight-rules. In the presented flight simulator study, participants used the tactile belt’s vibrations coming from different directions to find specific objects in the simulated environment while flying maneuvers according to verbal instructions. Eye tracking technology, which allows capturing and displaying a person’s gaze (Duchowski, Citation2017), was used in the study to evaluate the participants’ performance and progression during the flights. Their individual responses to questionnaires and in an open interview provided insights into their perceived workload and user experience, as well as the tactile system’s usability.
2. Related work
This article studies the value of vibrotactile cues for pilots’ performance, perceived cognitive workload, user experience, and spatial awareness. Therefore, we first discuss related work on tactile displays in general and in the aviation context, before elaborating on its use to enhance spatial awareness.
2.1. Tactile displays
Technology intended to assist people can often overwhelm them instead (Burke et al., Citation2006). According to the multiple resource theory (Wickens, Citation2008b), this can in some cases be related to an overload of the senses (Basil, Citation2012) – a circumstance which can be avoided by better distributing the information load across different modalities (e.g., audio, visual, tactile) when one modality, such as the visual modality, is heavily used already. The modality that has been described as best suited for a multi-modal interface is the tactile modality as it is often less overloaded or has been neglected so far (Burke et al., Citation2006; Van Veen & Van Erp, Citation2000).
Tactile displays have been, amongst others, built into car seats to improve users’ localization accuracy and response times (de Vries et al., Citation2009), and to provide the visually impaired with important information about the direction, distance, and height of objects (Durá-Gil et al., Citation2017; van Erp et al., Citation2017). Moreover, Tsukada and Yasumura (Citation2004) explored the encoding of distance and directional information through multiple vibration motors on a belt and found that users can intuitively recognize directions to their destinations. This has led to successful application of tactile belts for pedestrian wayfinding (Heuten et al., Citation2008), indicating that users could pay more attention to the environment when receiving tactile feedback from a belt (Pielot & Boll, Citation2010). It has also been shown that spatial vibrotactile cues can effectively direct users’ visual attention to a given direction which can increase safety in driving (C. Ho et al., Citation2005).
Rosa et al. (Citation2020) found that vibrotactile warnings can be effective in conditions of increasing mental workload and in the residual capacity region for effectively attending a secondary task. Multi-modal interfaces combining, e.g., audible and tactile modalities for a single alarm have been found to increase perceived urgency, but with increasing workload, the effect disappears as demonstrated by Biondi et al. (Citation2017) for a take-over request in a semi-autonomous driving scenario. Additionally, Murphy and Dalton (Citation2016) describe how high visual load can lead to inattentional numbness, i.e., reduced sensitivity to tactile stimuli. A study by Gallace et al. (Citation2006) also found an analogue of visual change blindness in the tactile domain, depending on the intervals between different vibration patterns, which implies that no long intervals should be introduced between vibrations when changing pattern or location should be detected.
The design of tactile displays with regard to the main parameters, frequency, intensity, locus, and duration, has been explored in numerous studies and is covered extensively by Jones and Sarter (Citation2008). Hence, we will adhere primarily to the recommendations provided by this work in the scope of this study (see Section 3.2.1).
In the aviation context, tactile feedback is a modality that has not been utilized intensively compared to other modalities. Van Erp and Self (Citation2008) provide a comprehensive overview of the different applications of tactile displays in air, as well as for sea and land environments, but focus on military use cases. The authors highlight the capabilities of the technology to improve users’ spatial orientation, and that they had a positive effect on performance, especially in circumstances of degraded vision or high workload. The reviewed applications in military aviation included guidance for flying maneuvers, holding altitude, controlling drift while hovering a helicopter and landing unmanned aerial vehicles from a remote ground control station. In the civil aviation domain tactile displays have been evaluated in different scenarios. Van Baelen et al. (Citation2021) investigated the use of tactile feedback for flight envelope protection in a comparison study between force feedback on the control stick, vibrotactile alerts and a combination of both. They conclude that for communicating when and in what direction the flight envelope protection is active, force feedback is valuable during operation and vibrotactile feedback can be added during training. C.-Y. Ho et al. (Citation2001) studied how air-traffic-controllers handled interruption tasks coming from different modalities and found that the presentation of concurrent tasks via different sensory channels led to improved time-sharing performance, possibly due to reduced resource competition. Prinet et al. (Citation2016) assessed the effectiveness of tactile spatial alerts for notifying pilots of an aircraft intruding on their flight path. They found that 100% of tactile alerts were detected and that tactile displays are effective for conveying spatial information which can help to prevent collisions. In a comparison study, pilots were warned about location and severity of icing on their airplane through visual cues and tactile cues (McGuirl & Sarter, Citation2001). It was found that performance was equally high for both types of cues and that with tactile cues the pilots were better able to recall and compare the previous and current icing condition. Ziat et al. (Citation2016) found that tactile feedback improves the landing performance of pilots in a highly simplified experimental setup with a stylus pen controlling an abstract aircraft representation on a display. Moreover, tactile feedback is also already used in aircraft in the form of so called stick shakers that vibrate when pilots are about to stall (Trant, Citation1955).
However, little work has been done to assess tactile displays as part of the orientation procedure in general aviation that is mainly based on the visual orientation using objects in the environment (flying under visual flight rules (Eurocontrol, Citation2009)). This article intends to address this.
2.2. Eye tracking
Tactile signals may also be combined with eye tracking technology for validation of directional tactile cues or for gaze based interactions. In general, eye tracking can provide an unobtrusive way to observe, analyze and utilize a person’s visual attention (Duchowski, Citation2017). Rantala et al. (Citation2020) studied the temporal and spatial mechanisms between the combination of the gaze and tactile modalities, and found that tactile feedback performed equally well as both, visual and auditory feedback, to provide users with signals in an unobtrusive way. Moreover, Gkonos et al. (Citation2017) combined a tactile belt with an eye tracker to provide pedestrians with navigation instructions. In the aviation context, eye tracking has been used for a variety of purposes (Di Stasi & Diaz-Piedra, Citation2019; Peißl et al., Citation2018; Ziv, Citation2016), such as assistance for instructors (Rudi et al., Citation2020). However, there is little work that combined eye tracking with tactile displays. Our research utilizes eye tracking primarily to analyze participants’ attention distribution and to enable the experimenter to trigger the next vibrotactile cues at the exact moment when the participants identified the current target object.
2.3. Spatial awareness and sketch maps
Spatial awareness is defined as a concept in conjunction with situation awareness. In the aviation context, situation awareness is defined as the pilots’ need to perceive their aircraft and environment, understand the significance of the perceived information, and anticipate the effect that environmental elements may have on the aircraft (Endsley et al., Citation1998). These three aspects are commonly referred to as different levels of situation awareness, with perception being level 1, understanding being level 2, and anticipation level 3. Moreover, situation awareness can be divided into correlated subcategories (Endsley, Citation1995), out of which Wickens (Citation2002) defines automation awareness, task awareness, and spatial awareness to be the most important in the aviation context.
Spatial awareness in aviation may be defined as the perception, understanding, and projection of the position and extent of one’s own aircraft as well as the position and extent of objects in the aircraft’s environment (Bolton & Bass, Citation2009). The importance of pilots’ spatial awareness has been previously discussed, but there still exists only little research on designing an appropriate measure (Rudi, Citation2019). Bolton and Bass (Citation2009) were among the first to explore appropriate measures and suggested to exploit existing measures of situation awareness for this purpose.
Hence, one more recent approach was presented by Stähli et al. (Citation2018), who suggested to utilize measures from the Geographic Information Science that have a longstanding history of dealing with topics related to spatial cognition (Montello & Raubal, Citation2013). More precisely, the authors suggested to utilize sketch maps as a measure for spatial awareness – an approach that we will also follow in this study.
Sketch mapping is a method that is often used for studies in which participants have perceived or traversed a spatial scene and allows for an externalization of the participant’s spatial knowledge of that scene. Participants are provided with an empty drawing canvas, either on paper or on a computer, and given an instruction such as “please sketch the street network and any landmarks you remember.” Thus, sketch maps allow for the assessment of cognitive maps (Blades, Citation1990; Portugali, Citation1996) in real and virtual environments (Billinghurst & Weghorst, Citation1995). Cognitive maps are individuals’ mental representations of the properties and locations of objects in spatial environments (Tolman, Citation1948), and are related to an individual’s sense of direction (Kozlowski & Bryant, Citation1977).
For interpretation of the drawings, a variety of different sketch map analysis tools have been proposed throughout the years, such as the spatial-query-by-sketch system (Egenhofer, Citation1997) or CogSketch (Forbus et al., Citation2008). More recent solutions are the Gardony Map Drawing Analyzer (GMDA) that can be utilized for quantitative sketch map analysis (Gardony et al., Citation2016) and the more qualitative SketchMapia introduced by Schwering et al. (Citation2014). In this article we chose to utilize the more recent and quantitative GMDA tool.
3. Methodology
3.1. Study design
The goal of this research is to determine whether a tactile belt allows general aviation pilots to improve their target identification performance and spatial awareness, while lowering their perceived cognitive workload and enhancing their user experience.
For this purpose, we present a simulator study, as part of which the participants had to fly a series of maneuvers and try to identify building structures on the ground. This task emulates that pilots are flying under visual flight rules (VFR), which require good visibility (Eurocontrol, Citation2009) and generally rely on a visual orientation using objects in the environment which can easily be identified. The study procedure was inspired by the study conducted by Tannen et al. (Citation2004) who tasked fighter pilots with identifying targets from their cockpit while using different configurations of head-coupled visual and spatial audio displays.
The experiment was set up as a counterbalanced within-subject design. Every participant completed one flight for each of the following conditions:
Condition NoBelt: Finding the objects without any additional assistance. (Baseline)
Condition Belt: Finding the objects with the assistance from the tactile belt, which indicates the relative direction to the next object.
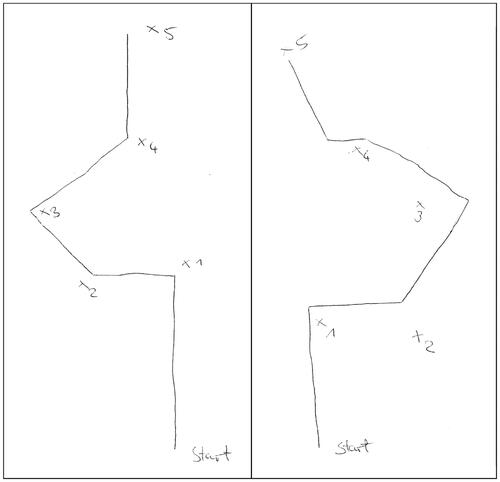
To avoid a learning effect, pilots flew two possible flight scenarios (A and B) in randomized order. As shown in , the flown routes in the two scenarios were a mirror-image of each other and each scenario used 5 comparable but different objects. This prevented pilots to learn the sequence of the required banking maneuvers and the appearance of the objects. Participants either flew Belt-first or NoBelt-first with one of two flight scenarios (A or B) assigned. shows an overview of the possible configurations for the 4 groups participants were assigned to.
Figure 1. (Left) The routes used in the two scenarios. Numbers indicate the location of objects and the order in which they had to be identified. The northern route corresponds to Scenario A (first turning left), the southern one to Scenario B (first turning right). (Right) An overview of the objects in the two scenarios.
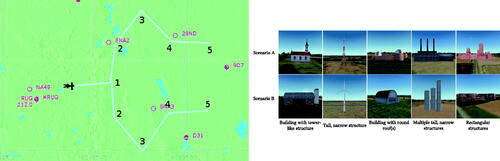
Table 1. Conditions (Belt, NoBelt) and scenarios (A or B) for each of the four groups of participants.
Based on previous research, indicating an advantage of tactile feedback for spatial allocation, the following hypotheses are proposed and examined in the remainder of the article:
H1 – Performance Participants identify more objects correctly and require significantly less time to do so in the Belt condition compared to the NoBelt condition.
H2 – Spatial Awareness Participants are able to draw significantly more accurate sketch maps of their flight route in the Belt condition compared to the NoBelt condition.
H3 – Cognitive Workload Participants perceive a significantly lower cognitive workload in the Belt condition compared to the NoBelt condition.
H4 – Usability Participants consider the Belt condition to have a significantly better usability than the NoBelt condition.
H5 – User Experience Participants consider the Belt condition to have a significantly better user experience than the NoBelt condition.
The independent variable is the applied assistance with Belt or NoBelt. The dependent variables are performance (measured by number of correct identifications, time to identification, and missed objects), spatial awareness (measured by accuracy of sketch maps), perceived cognitive workload (measured by score in the standardized NASA-TLX questionnaire (Hart, Citation2006)), system usability (measured by score in the standardized SUS questionnaire (Brooke, Citation1996)), and user experience (measured by score in the standardized UEQ questionnaire (Schrepp et al., Citation2014)).
Further, the pilots’ gaze behaviour in the Belt and NoBelt conditions is recorded with an eye tracker to examine the influence of the tactile feedback on pilots’ visual search behaviour. Then, three common eye movement metrics for the analysis of visual search are calculated from the eye tracking data to explore quantitative differences between conditions: fixation duration, saccade amplitude and fixation saccade ratio (Holmqvist et al., Citation2011).
3.2. Study setup
As part of the study setup, participants wore a tactile belt and a mobile eye tracker, while controlling a flight simulator. To comply with COVID-19 restrictions, the experimenter sat in a separate room at a controller station. The study setup (participant and experimenter) is depicted in .
3.2.1. Tactile belt
The tactile belt was built on the basis of a motorcycle kidney belt and enhanced by adding an Arduino Lilypad microcontrollerFootnote1, which is designed for usage in wearables and e-textiles. (right) shows a picture of the belt. The microcontroller was sewn into the belt’s fabric and connected with conductive threads to eight Lilypad vibe boards that were attached equally spaced across the inner surface of the tactile belt, similar in design to Gkonos et al. (Citation2017) and Tsukada and Yasumura (Citation2004). The vibe boards use Precision Microdrives 310 vibration motorsFootnote2 with a vibration frequency of around 200 Hz, which provides good sensitivity on the abdomen as shown in Jones and Sarter (Citation2008). The authors also conclude that greatest localization accuracy is achieved with eight to twelve motors. Hence, it was chosen to use the maximum limit of eight motors allowed by the microcontroller.
Figure 2. (Left) The numpad keys and their mapping to the eight vibe boards. “5” was used to initiate the vibration following a wizard-of-oz approach. (Right) The tactile belt used as part of this study, visible are two vibe boards (bottom), the power supply/battery (top left), and the microcontroller (top right).
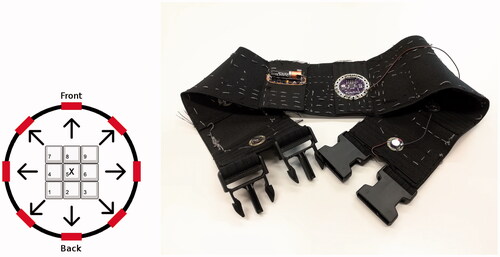
The vibrations were controlled with a custom system that allowed to activate the eight vibe boards (i.e., initiate a vibration) using the experimenter PC’s numpad. These commands were sent to the microcontroller using the serial connection. The microcontroller would then pulse the output that is connected to the corresponding vibe board (see , left). The vibration duration was set to 500 ms for the on and off phases of the vibration pattern which is in the range of durations presented in Jones and Sarter (Citation2008) and the pulse durations were kept constant throughout the study.
3.2.2. Eye tracker
The eye tracker used as part of the study setup was a second generation mobile eye tracker by SMI running at 120 Hz.Footnote3 For the study the manufacturer’s standard eye tracking software iViewETG was utilized for calibration, as well as for recording and monitoring the participants’ eye movements at the experimenter station.
3.2.3. Simulator
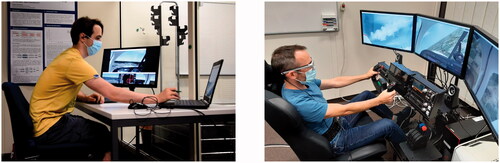
The flight simulator was provided by Lufthansa Aviation Training and is primarily used as part of exhibitions. The simulator (see ) included a steering yoke in front of the participants, a driving seat, a metal chassis (for stability), three monitors mounted at eye level, as well as levers for throttle, propeller and mixture, an instrument board, pedals, and various buttons on the yoke itself. All these components were connected to a high-performance PC.
Figure 3. Experimental setup used in the study. The experimenter (left) monitors the participant’s performance and triggers vibrotactile cues to guide him to the next target along the route. The participant (right) controls a general aviation aircraft and tries to identify objects in the simulated environment while wearing eye tracking glasses and a tactile belt.
However, to make the study as accessible to laymen participants as possible, the majority of the flight simulator’s control inputs and instruments were disabled. Additionally, the autopilot was configured so that it would maintain a predefined altitude above sea level. Pulling out or pushing in the yoke, which usually leads to altering the altitude of the aircraft, would only lead to minimal changes in the aircraft’s pitch. The autopilot would quickly counteract this and maintain the predefined altitude. This means that crashing the aircraft was impossible under normal circumstances, barring extreme maneuvers such as repeated barrel rolls. Participants were made aware of this and discouraged from flying such maneuvers. For the off-chance of a crash occurring, the damage settings were also disabled.
The simulator software used for the experiment was Prepar3D v3.Footnote4 The aircraft model chosen for the flight simulator sessions was the Mooney Acclaim which includes a Garmin G1000 avionics suite that provides a glass cockpit layout (Sweet, Citation1995) as found on contemporary general aviation aircraft.
The monitor in front of the participant featured the bank angle indicator in a prominent position that made it easily visible for participants. This indicator was one of the components participants had to monitor in order to complete the maneuvers they were asked to fly (see Section 3.3). Unlike the experimenter, participants did not see the navigation map to avoid them simply following the ownship symbol and the route depicted there.
3.2.4. Experimenter station
On the instructor side the setup included a laptop that allowed surveying the eye tracker and controlling the tactile belt, as well as a monitor displaying some of the key flight parameters shown to the participants. In particular, the monitor displayed copies of the three views displayed to the participant, and an additional view showed the aircraft’s electronic navigation map which contains the location of the aircraft, the flight route, and the locations of the target objects. In conjunction with the ownship symbol displayed on the map, the experimenter could judge where the participant was in relation to their next target object and decide which vibe board to activate if the flight was conducted with the belt. If, e.g., the next target object was 90 degrees to the right of the ownship symbol, the experimenter would trigger the vibe board placed at 90 degrees to the right on the tactile belt. This “Wizard of Oz” approach could potentially be replaced with a piece of software that interfaces to the simulator’s API and activates the vibe boards automatically. However, the manual activation worked quite well and so the additional development work for an automatic activation was deemed unnecessary. Instead, for enabling consistent activation of the vibration cues, a fixed protocol for the activation was defined and the whole study was conducted by the same experimenter to minimize a potential link between participants’ performance and the activation by the experimenter.
3.3. Procedure
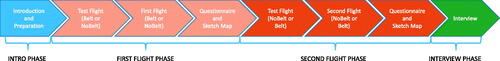
To evaluate our hypotheses and to acquire the necessary data, a flight simulator experiment was conducted. The participants were tasked with flying along a predefined route by following the verbal instructions given by the experimenter. While doing so, they were asked to identify specific objects in the simulated environment. During the flight simulator sessions, participants wore an eye tracker, allowing the experimenter to determine whether the pilots identified the correct target. After they had completed a flight, participants were asked to draw a sketch map of their flight route and fill in the post-study questionnaires (see ).
Figure 4. The study procedure the participants went through as part of the main study.
3.3.1. Participants
The study was conducted during the COVID-19 pandemic and the number of available participants was limited. A total of 22 participants (7 female, 15 male) could be recruited nonetheless both via an e-mail inquiry and personal contacts. The tasks in the study did not require the expertise and experience of trained pilots or aviation personnel. This allowed for a more diverse field of participants.
The mean age of the participants was 32 years (SD: 11.62, MIN: 21, MAX: 66). While the majority of participants were laymen with no experience in handling a real aircraft, five participants stated that they had accrued at least 10 real-life flight hours, with the maximum being 190 h. 11 participants had at least some previous experience with flight simulation, including games. 14 participants stated that they had at least some experience with handling a yoke or a joystick.
Three participants had to wear their glasses during the experiment to be able to recognize objects on the simulator monitors, which is why the eye tracker feed could not recognize and display their gaze, as wearing glasses would not allow the device to correctly track the pupils. Instead, these users were asked to point at the objects upon identification.
3.3.2. Pre-study
A pre-study was conducted ahead of the main study involving two participants aged 33 and 36. The most important findings of the pre-study were that the belt was too small for one of the participants and that the difficulty of the target identification was too high. To improve on these limitations, an optional belt extension was created, and the objects were made more noticeable by placing them in more exposed locations and enlarging them. It has to be noted that the front motors were not shifted by the belt extension, only the two back motors and their location was still on the back of the extended belt. Even more, the shift of the back motors turned out to be irrelevant in the main study because no full turns were required for the guidance to the target objects as shown later. It was also suggested to stress the importance of the sketch map task before the flights as both pre-study participants forgot to also focus on remembering the route until they were asked to draw the maps. The pre-study also allowed the experimenter to train a consistent activation of the vibration cues as per the protocol.
3.3.3. Main study
The main study consisted of four phases: an introductory and tutorial phase, a first flight phase followed by a debriefing, a second flight phase followed by a debriefing and a concluding interview phase. Each of the two flight phases included a test flight, a main flight, and a post-flight questionnaire, plus drawing the sketch maps.
3.3.3.1. Introductory and tutorial phase
After arriving at the location of the experiment, participants were asked to wear a surgical face mask for the duration of the experiment to adhere to prevailing safety rules. Next, they read a description of the study and filled out a consent form and a demographics questionnaire. The demographics questionnaire also contained questions about their condition and their experience with real or simulated flying.
Following the introduction, participants were given a tutorial for the flight simulator by the experimenter. This included an overview of the general handling of the aircraft and some experiment specific advice, such as the advice to use the 30∘ bank angle indicator when flying turns to improve consistency across participants. Participants were also shown multiple ways to judge the changing heading angle during turns, such as the on-board compass, the track display or the usage of the environment for orientation. They were then given as much time as needed to get used to flying turns and to familiarize themselves with the flight simulator.
If their first flight was planned to be the Belt condition, participants would then be equipped with the tactile belt. A trial run of the vibrations was performed to familiarize the participants with the tactile feedback, in which the participants had to judge what direction the vibration was coming from.
Independently of whether they were wearing the belt for the flight or not, the participants were then equipped with the eye tracker, and a 1-point calibration procedure as per manufacturer instructions was completed.
3.3.3.2. First flight phase
The first flight phase with the selected condition included a test flight and a main flight. In the more simple test flight, the participants were tasked with flying two maneuvers and finding two water towers in the environment. Pictures of the water towers were shown to them before the test flight started. If they would later have their first main flight in Scenario A, which starts with a left turn, their test flight would start with a right turn and vice versa for Scenario B.
To initiate a maneuver, the experimenter would first call out the direction and relative heading angle of the maneuver, followed by the target that the participants had to look for. An example of such an instruction would be “Please turn 90 degrees to the left, and look for the red water tower.”
In case they wore the belt, the test flight also allowed the participants to familiarize themselves with the changing vibration signals. The more the participants steered towards their target, the further towards the front and center the vibration wandered. Once activated, the vibration was repeated continuously in a loop (500 ms vibration on, 500 ms off, etc.). Meanwhile, the experimenter could follow their performance on the eye tracker feed and further reassure the quality of the calibration.
Upon successful completion of the test flight, the participants were presented with the five objects they had to identify in their first main flight. They were also reminded of the upcoming sketch map task after the flight to make them less likely to forget about paying attention to their route and overall environment.
The first main flight was guided by the same kind of instructions and call-outs as the test flight. But, due to the increased duration of the flight, the instructions announced by the experimenter were repeated right after they were first issued, which made it easier for participants to remember both the maneuver they had to fly and the object they were tasked with finding.
To identify a target, participants were asked to focus their gaze on the appropriate object. The experimenter would see this by using the eye tracker video feed. Additionally, they had to either give a verbal sign of confirmation (”I can see the target.”) or point at the simulator monitor where the object was located. The start of either of those two actions served as the point in time where the identification attempt was officially initiated and the timestamp for it was created. Upon successful identification of a target, participants received a confirmation from the experimenter. The instructor then told them to either hold the current direction or to adjust the trajectory to correct for previous deviations from the planned route.
If the participant did not identify the target correctly, the experimenter would notify them accordingly and record the incorrect call out. In case they flew past an object or had no realistic way of finding it, participants received a “strike” for the current target object, though they were not informed of this. Instead, the experimenter gave them new instructions that were aimed at getting them back to flying towards the target object. This usually involved flying a circular pattern until the object was in the field of view again. In case a participant amassed three strikes on the same object, they were given instructions to find the next object.
Once the participant had identified the last object, the first main flight was finished, and the recording of the eye tracker and the flight simulator were stopped. The participants were asked to take off the eye tracker and the belt if they had worn it during the flight, as neither was required for the post-flight tasks.
In the subsequent debriefing, the participants were tasked with sketching the route they just had flown and the target objects they had identified on a blank sheet of paper. To make the location and order of the objects unambiguous, the participants were asked to mark them with a cross symbol and number them in chronological order of identification. There were no further restrictions on the style and format of the sketch maps. Examples of drawn sketch maps are depicted in .
Figure 5. Set of sketch maps drawn by one of the participants after the flights. The identified objects are marked with crosses and numbered from 1 to 5.
After creating their sketches, the participants filled in the post-flight questionnaires digitally on a desktop PC. This allowed them to assess the mental workload they experienced during the flight and judge the usability and user experience of the system depending on the study condition.
3.3.3.3. Second flight phase
Once they had completed the post-study questionnaires, participants were led back into the simulator room for the flights with the second condition, starting with the second test flight. If they had not used the belt for the previous flight, they were equipped with it at this point. If they already had used the belt, they conducted the second flight without it. The rest of the flight followed the same procedure as detailed for the first test flight.
After the test flight, the second main flight followed the same procedure as the first main flight, except for the altered condition, but with the same set of questionnaires and sketch maps.
3.3.3.4. Interview phase
Upon completion of the second set of post-flight questionnaires, the participants were invited to share their subjective opinions in a semi-structured interview. While the semi-open nature of the interview allowed for any form of feedback, specific questions were asked as well. These were about the participants’ preference regarding flying with or without the belt, their perceived advantages and disadvantages that the tactile belt had to offer, the quality of the targets to identify, and if there was a change in their search behavior. Before leaving the room, participants were offered a reward in the form of some sweets of their choosing.
4. Results
This section details the results gained from the data collected during the flight simulator experiment. It is subdivided into the different topics that were investigated, i.e., performance, spatial awareness, cognitive workload, and user experience.
Given the within-subject study design, the statistical analysis is conducted considering the results as paired groups. A 95% confidence interval was used for all cases.
4.1. Performance
To compare the performance of participants between the two conditions (Belt=B and No Belt=NB), four aspects were considered. First, the total number of incorrect identifications participants made were counted. Second, the number of strikes they accrued from flying past an object and third, the number of objects they missed altogether after getting a third strike on a single target were evaluated. Fourth, the overall time spent looking for targets was computed as the sum of all the five times from starting a leg of the route until the successful identification of the announced target (in seconds). summarizes the results while separating between the first three aspects reported as absolute numbers and the last two reported as averaged numbers.
Table 2. Number of incorrect identifications, strikes and misses per condition, as well as the average time searching for objects per condition; with their Z and p values for a Wilcoxon signed rank test.
With regard to the number of incorrect identifications, the B condition had lower numbers for all three categories, participants did not get a single strike or missed a single target, and the number of incorrect identifications was reduced compared to the NB condition. A Shapiro–Wilk test showed that none of these data sets are normally distributed, which is why a Wilcoxon signed rank test was used to test for significance. The number of strikes participants received was significantly different (p < 0.05) between the conditions. There were no significant differences for incorrect identifications and misses. For the five participants that had real-life flight hours, no strikes or misses were recorded in either of the conditions and one incorrect identification in the NB condition was logged.
Participants spent significantly less time (in seconds) searching for objects in the B condition (mean = 273, SD = 84) compared to the NB condition (mean = 350, SD = 171). For 15 out of 22 participants, their average time searching was lower when using the belt. A Shapiro–Wilk test showed that the data was not normally distributed, hence, a Wilcoxon signed rank test was used. The test showed that the differences in average time searching are significant (p < 0.05). Note that 3 of the total 44 flights had incomplete log files but the required timestamps to determine the average time searching could be extracted from the audio and front camera video recordings of the eye tracker through manual analysis for these participants. One participant was not able to identify one of the objects and accrued three strikes. Since no identification timestamp could be registered, the time when the last strike was given acted as the cutoff point for that leg of their route.
4.2. Spatial awareness
The sketch maps drawn by the participants were evaluated as an indicator for determining whether the tactile belt helped to enhance their spatial awareness. One participant did not provide the sketch maps and stated that they did not remember enough to do so. The participant was excluded from the following analysis. With the two conditions, a total of 42 sketch maps were considered for analysis.
The scenery files edited in Prepar3D’s SimDirectorFootnote5 were used to define the reference coordinates of the object locations for both scenarios. The sketch maps were scanned, digitized and then imported into the Gardony Map Drawing Analyzer (GMDA) tool (Gardony et al., Citation2016). The GMDA tool allowed a comparison of the relative and absolute directional differences between the drawn and actual object position to calculate different measures, indicating how closely a participant’s sketch map resembles the reference map. The outcome of these comparisons is presented in .
Table 3. Numeric results for sketch maps when subdivided by testing condition.
The SQRT(CanOrg) measure results in a score between 0 and 1, where a higher score indicates a better accuracy of the drawn configuration. Sketch maps drawn after flights of the NB condition resulted in higher scores regarding SQRT(CanOrg) compared to the sketch maps from the B condition. A Shapiro–Wilk test determined that neither data set is normally distributed. A Wilcoxon rank sign test showed no significant differences.
The two metrical measures of distance and angle accuracy also result in a score between 0 and 1, with a higher score indicating a better representation of distance and angles. Similarly to the SQRT(CanOrg) measure, both NB condition’s distance and angle accuracy showed higher scores than B condition’s counterparts. Shapiro–Wilk tests showed the data is not normally distributed and the Wilcoxon signed rank test indicated no significant differences for either of the two measures.
A fourth measure that was considered is the bidimensional regression (BDR) (Friedman & Kohler, Citation2003), which provides us with the correlation coefficient r that reflects the resemblance between the configuration of points in both maps on a scale from 0 to 1. The sketch maps from the NB condition scored a higher r value than from the B condition. A Shapiro–Wilk test showed no normal distribution and the Wilcoxon signed rank test showed no significant differences.
4.3. Cognitive workload
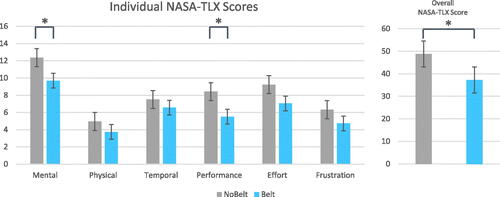
The perceived cognitive workload was measured using the NASA-TLX questionnaire (Hart, Citation2006) for both conditions post-flight. A Shapiro–Wilk test showed a normal distribution for the overall NASA-TLX (i.e., the sum of all categories per participant), so a paired samples t-test was employed. The overall NASA-TLX was significantly (p < 0.05) higher for the NB condition (mean = 48.77, SD = 20.433) than for the B condition (mean = 37.23, SD = 15.611).
The six categories of the NASA-TLX were non-normally distributed as per a Shapiro–Wilk test and analyzed using a Wilcoxon signed rank test with a Benjamini-Hochberg correction for false discovery rate (Thissen et al., Citation2002) including the overall NASA-TLX. All of the six individual categories had lower mean values for the B condition, while only mental demand (p < 0.05) and performance (p < 0.05) were significantly lower. Physical demand (p = 0.086, Z = −1.866), temporal demand (p = 0.150, Z = −1.440), effort (p = 0.078, Z = −2.011) and frustration (p = 0.150, Z = −1.506) showed no significant differences. A summary of the analysis is given in .
Figure 6. Results of the “raw” NASA-TLX questionnaires for the six categories and overall value for both conditions. Whiskers indicate standard error. Statistical significance marked by: *p < 0.05.
4.4. Usability
Participants judged the tactile belt’s usability using the System Usability Scale (SUS) (Brooke, Citation1996). A Shapiro–Wilk test showed that the SUS scores of the participants follow a normal distribution. A paired samples t-test showed that the SUS score of the B condition (mean = 84.77, SD = 9.093) was significantly higher (p < 0.005) than for the NB condition (mean = 73.18, SD = 14.438).
4.5. User experience
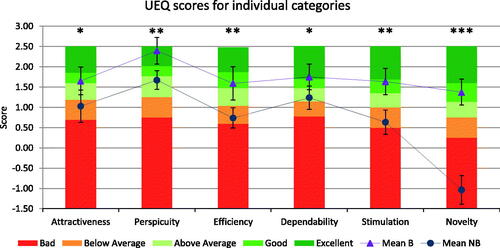
Participants also filled in the User Experience Questionnaire (UEQ) (Schrepp et al., Citation2014). Shapiro–Wilk tests showed that the data sets of the B condition for the categories perspicuity, efficiency, and novelty do not follow a normal distribution, while all other data sets do for both conditions. Since not all of the data sets are normally distributed, a Wilcoxon rank sign test with a Benjamini-Hochberg correction for false discovery rate was used to determine whether the differences are significant.
The scores of all user experience categories of the B condition were significantly higher than their counterparts of the NB condition, i.e., attractiveness (p < 0.05), perspicuity (p < 0.01), efficiency (p < 0.005), dependability (p < 0.05), stimulation (p < 0.01) and novelty (p < 0.001). A summary of the analysis is given in .
Figure 7. UEQ benchmark results for the six categories and both conditions. Whiskers indicate confidence intervals. Statistical significance marked by: *p < 0.05, **p < 0.01, ***p < 0.001.
4.6. Interview
A semi-structured interview was conducted at the end of the study. Participants were asked a set of questions involving their preference regarding flying with or without the belt, their perceived advantages and disadvantages the tactile belt had to offer, the quality of the targets to identify, and if there was a change in their search behavior.
4.6.1. Preference
Nineteen of the 22 participants preferred performing the task while wearing the tactile belt. One participant preferred to not wear the belt, while two had no clear preference.
4.6.2. Advantages
The most commonly named advantage when using the tactile belt was its assistance in determining when a flight maneuver was completed and thus when the aircraft should be leveled out again. This was mentioned by 14 participants, who also noted that without the belt, they had a harder time judging the required heading change. 11 participants responded that they used the belt’s vibrations to infer where to look for the next target object. Moreover, eight participants perceived the strength of the vibration signals to be just right, while five participants found them too weak and four too strong.
4.6.3. Disadvantages
Five participants noted that the resolution of the belt was too low. With only eight available vibration motors, judging the exact direction to the next object was found to be difficult. For two participants, the frequency of the vibrations was too high. Four participants noted that while they found the vibration signals to be fine, they could see them getting annoying or distracting if they were used “as is” for longer flights.
4.6.4. Target identification
When asked about the two sets of target objects they had identified during the flights (see , right), 10 participants found these groups to be balanced and did not perceive one to be more difficult than the other. For four participants, the objects in scenario A were more difficult to identify, while three participants found the objects in scenario B to be more difficult to spot. The remaining participants who provided statements concerning the targets also found the two groups to be balanced in terms of difficulty, but named single objects they found to be more difficult than the others: Three objects were mentioned four times, those being the antenna, the windmill and the ruins. Moreover, two of the participants answered that they found the difficulty of the tasks too easy and would have enjoyed a higher difficulty.
4.6.5. Search behaviour
Fifteen participants noted that when using the tactile belt, their search behavior was drastically different compared to the flight without the belt. In the latter case, they used a wider scanning search pattern, checking all three available monitors with regularity. When assisted by the belt, they mainly focused on the central monitor once the vibration motor in the front was active. This effect did also show up in the visual analysis of the eye tracker recordings, as will be explained in the following section.
4.7. Gaze behaviour
The changes in visual search behaviour reported in the interview (see previous section) were also supported by an exploratory analysis of the eye tracking data.
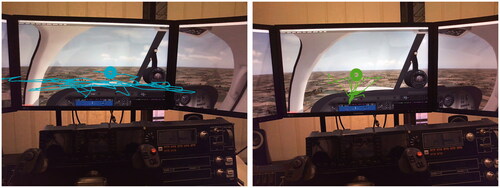
A first visual inspection of the participants’ scanpaths between conditions revealed a more focused scan on the middle display, i.e., in the direction of flight, in the B condition for 14 participants. The scanned area was smaller and less visual attention was directed at the left and right display. Two exemplary scanpaths of one participant demonstrating the described effect of a changed scanning strategy are shown in . Four participants’ scanpaths did not show the more focused scan in the B condition and the recordings from four participants did not contain enough gaze data for an analysis.
Figure 8. Exemplary scanpaths of one participant. A wider area was scanned when not assisted by the belt (left), whereas the scanning was more focused in the center of the middle display without the belt (right).
Further exploratory analysis was performed using common eye tracking metrics. The quantative analysis was based on the fixation and saccade export files of SMI’s BeGaze software. Three eye tracking metrics which are commonly used for the analysis of visual search were computed from the data based on the definitions by Holmqvist et al. (Citation2011). The metrics, fixation duration, saccade amplitude and fixation saccade ratio, were computed per participant, per condition and a joint dataset was created for each metric. Boxplots of the resulting datasets are depicted in . Two far outliers were removed from the saccade amplitude data.
Figure 9. Boxplots of fixation duration (left) and saccade amplitude (right) and fixation saccade ratio (bottom) in the Belt and NoBelt conditions.
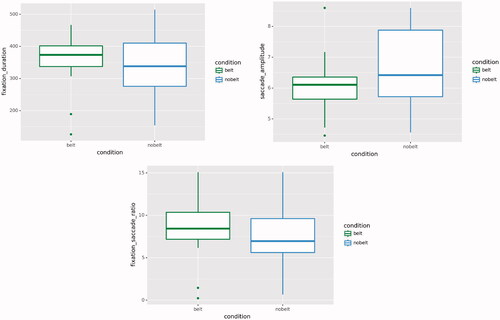
The mean fixation duration was slightly lower in the NB condition (mean = 333.4, SD = 92.09) than in the B condition (mean = 357.3, SD = 82.71), and the mean saccade amplitude was slightly higher in the NB condition (mean = 6.57, SD = 1.35) than in the B condition (mean = 6.11, SD = 0.87). The fixation saccade ratio was slightly lower in the NB condition (mean = 7.33, SD = 3.35) than in the B condition (mean = 8.45, SD = 3.42). The boxplots also reveal a smaller interquartile range for the B condition compared to the NB condition, particularly for saccade amplitude.
The eye tracking metrics datasets were non-normally distributed as per a Shapiro–Wilk test and a Wilcoxon signed rank test was performed on the three datasets. There was no statistically significant difference in mean fixation duration (p = 0.349, Z = −0.936), mean saccade amplitude (p = 0.586, Z = −0.544) or fixation saccade ratio (p = 0.199, Z = −1.285).
5. Discussion
Based on these results, the initially proposed five hypotheses for evaluating the tactile belt as additional assistance in simulated flight are discussed.
5.1. H1 – Performance
The performance indicators of accrued strikes, misses and incorrect identifications show a clear advantage for the B condition: The tactile belt increases the confidence of the participants in their decision making, as it directly indicates the direction to the next target. This observation was reflected by the majority of responses in the interview, where the above functionality was the most named advantage of the belt. A significant difference was the lack of strikes issued for the B condition compared to the ten strikes of the NB condition. Note, that no strikes and misses for the B condition also means that the missing motors in the back when using a belt extension was no issue. These results indicate that the belt benefits the overall safety of the flight: Failing to identify landmarks in a visual approach or similar real-life scenario may lead to problems, such as missed approaches, loss of orientation or complications with other air traffic. While there were still two incorrect identification attempts in the B condition, this was another improvement over the seven incorrect identifications in the NB condition.
The differences in the times until objects were successfully identified were found to be significantly lower for the B condition. This result should be evaluated carefully though, as the mean total identification time for the NB condition was influenced by its overall worse performance in terms of strikes and misses. The strikes and misses are evidently highly correlated with longer total time for identification, as the duration of the turnaround maneuver after flying past the target is added to the total time for identification. When eliminating all flights with disproportional delays due to strikes and misses, there was no significant difference in terms of the time until identification between the two conditions. Nonetheless, this does not diminish the expressiveness of the average time searching measure as flying past a target would result in a longer search time in the real world as well.
An explanation for the overall longer time searching for the NB condition could be seen in potential risk aversion from the participants. Some of them stated that even though they were fairly confident that they had identified an object, they wanted to make sure they were correct and waited with officially calling it out until they were closer to it. This however also implies that participants were more confident when wearing the belt.
The B condition performed significantly better with regard to the number of strikes and the average time searching, though the difference in incorrect identifications and misses was not found to be significant. Hypothesis H1 can thus be partially accepted.
In line with previous applications of tactile feedback in the aviation domain (Van Baelen et al., Citation2021; Van Erp & Self, Citation2008) and in other domains such as wayfinding (Heuten et al., Citation2008; Tsukada & Yasumura, Citation2004), the directional tactile cues were effective in conveying spatial information to the pilot. This confirms that at levels of residual capacity in mental resources (Wickens, Citation2008b), performance in a target search and navigation task can be improved by using tactile cues for communicating direction.
5.2. H2 – Spatial awareness
The spatial awareness aspect of the study was examined using the sketch maps that were drawn by the participants after each flight. The locations of the drawn objects were compared with a reference map from the Prepar3D flight simulator. Results from the GMDA analysis revealed no significant differences between the maps for the two conditions.
Many participants noted how they had a harder time remembering the route during the first flight, sometimes even forgetting about the sketch map task completely until they were asked to draw the map. Being used to the procedure, they found drawing the second sketch map easier as they made sure to remember their routes more carefully. Based on this feedback, the GMDA results were analyzed with regard to differences between the first and second sketch map of each participant. However, these results did not bring up any significant differences either.
Another explanation for the results between the two conditions not showing significant differences was explained by some participants as follows: While the belt allowed them to focus on the object finding task, it also made them not pay as much attention to their surroundings. Since in the B condition the belt guided them well through the entire flight they did not observe the environment as consciously as they had to for the NB condition, searching for the objects in a more active way. This possible over-reliance on a navigation or guidance system can impact spatial awareness if no specific training is given to uphold sufficient scanning.
Since no significant differences regarding the sketch maps were observed between the study conditions, hypothesis H2 has to be rejected.
The fact that some participants directed less attention to their surroundings when following the directional cues from the tactile belt can be compared to a degradation in spatial knowledge acquisition due to an overreliance on navigation systems (Parush et al., Citation2007). It also relates to the issue of overtrust in automation, which was previously described by Wickens (Citation1995).
Our findings seem to contradict the capability of tactile feedback to improve spatial orientation as highlighted by by Van Erp and Self (Citation2008). However, the participants could also have prioritized the navigation task and finding the objects over the spatial knowledge acquisition and sketch map task in both conditions, especially in their first flight.
5.3. H3 – Cognitive workload
The results of the NASA-TLX indicate that participants experienced a significantly lower overall cognitive workload in the B condition. More specifically, with regard to the questionnaire’s six subcategories participants experienced significantly lower mental demand while at the same time perceiving their performances to be significantly better.
The lower perceived mental demand, as well as the higher perceived performance could be tied to the overall difficulty of judging the heading angle change. Participants noted that they were not always sure if they had completed the maneuver they were tasked with the help of the outside view and compass instrument. The tactile feedback made this very easy, i.e., as soon as the belt would vibrate in the front the pilots knew that they were flying straight towards the target. This notion was further supported by participants’ remarks on how the belt gave them an additional sense of safety when identifying targets.
With regard to the physical demand, frustration, and temporal demand the B condition received a lower score for all individual aspects but none was significantly different. The outcome concerning the physical demand is not surprising as there is no noticeable difference between the two conditions except that participants wore a light-weight belt. The results regarding frustration indicate that the belt did not add any frustration but also could not decrease it. The finding that the perceived temporal demand was not significantly lower could be explained by the fact that the belt’s assistance did alleviate some of the temporal demand, but its effect was dampened by the constant vibration cycles which some participants noted to be worth turning off after the front motor is vibrating (i.e., they are on course) until the course has to be adjusted again.
Both the overall cognitive workload and three of its six subcategories were shown to be significantly lower and thus better for the B condition. The third hypothesis H3 can thus be partially accepted.
The reduced cognitive workload observed in our study relates to the findings of previous studies on vibrotactile feedback in the aviation domain that studied the use of tactile feedback at different levels of cognitive workload (C. Ho et al., Citation2005; Rosa et al., Citation2020; Van Baelen et al., Citation2021; Van Erp & Self, Citation2008). Our results extend these findings in that perceived cognitive workload can decrease when vibrotactile cues provide assistance to a navigation and target search task.
5.4. H4 – Usability
The usability of both conditions achieved results above the threshold of 68, which is regarded as above the average for an overall system score (Lewis & Sauro, Citation2018). More specifically, the mean score of the B condition gets an A+ on a curved grading scale while the mean score of the NB condition gets a B- (Lewis & Sauro, Citation2018). The grades indicate that participants felt they were able to complete their tasks safely, effectively, and efficiently. The simplified study design and implementation along with the straightforward tasks may have been contributing factors to these good results.
The B condition was scored significantly higher than the NB condition, which was in accordance with the majority of the responses from the interview. The positive influence of the belt can be explained with the wearable providing valuable assistance that made it easier for participants to find the objects. In essence, they had to align their gaze with the direction signaled by the equipment. This can also be observed in the eye movement data of participants such as the one depicted in . The belt also allowed pilots to focus on the object finding task by taking away some difficulty from the flying task as mentioned above.
Given the significantly higher SUS score for the B condition hypothesis H4 can be accepted.
5.5. H5 – User experience
All six categories of the UEQ were significantly better for the B condition compared to the NB condition. Users thus enjoyed their experience during the study significantly more when they had the tactile belt assisting them. This can again be directly seen as a confirmation of the generally stated preference of flying with rather than without the belt.
The higher novelty score is not surprising considering that none of the participants had experience flying with a tactile belt. Similarly, the higher perceived efficiency is easily explained by the fact that the belt indicated the correct direction and participants had to scan less. Moreover, since the efficiency category also indicates satisfaction with how fast the system reacts, it appears that the changes regarding which motors were vibrating were performed well by the experimenter.
The high perspicuity score can be explained with participants’ feedback that the belt’s signals and assistance were intuitive and easy to learn, with only one participant feeling they would need more training to use the belt to its full potential. The good stimulation rating indicates that participants felt motivated to use the tactile feedback and perceived it to be fun to use.
Attractiveness measures the overall impression of the product, so the higher score of the B condition can be seen in direct analogy to the majority of participants regarding it as preferable. Dependability is a measure for how much the user feels in control during the task and how predictable and secure the interactions are. The higher score for the B condition can be explained by participants trusting the belt’s signals quickly and fully relying on them in most cases. Participants felt that following the vibrations was a very safe and easy way to complete the task.
Concerning the significantly higher scores across all six UEQ categories for the B condition hypothesis H5 can be accepted.
Additionally, the overall positive rating of the tactile feedback by the participants also aligns with the positive findings from previous work about its application inside and outside the aviation domain (Burke et al., Citation2006; C. Ho et al., Citation2005; Van Baelen et al., Citation2021; Van Erp & Self, Citation2008; Van Veen & Van Erp, Citation2000). An effect of inattentional numbness as described by Murphy and Dalton (Citation2016) has not been observed during the study which indicates that the task difficulty needs to be higher than the difficulty of the target search task in our study for the described effects to materialize.
5.6. Limitations
The following section lists the limitations of our study in terms of methodology and findings from the post-study analysis.
The vibration signals were not issued automatically based on the position of objects and the aircraft but through the “Wizard of Oz” methodology. Consistency by the experimenter was ensured through a manageable number of motors and thus relatively coarse granularity of the signals, the limited complexity of the routes, the assistance of the electronic navigation map and a strict adherence to the study protocol. Moreover, while not a specific question in the interview, most participants were surprised to find out that the vibrations were not handled automatically, which indicates that we successfully kept the experimenter effects small.
Regarding the user experience, the statistically significant difference between the conditions in the novelty score of the UEQ raises the question of a possible novelty effect for the B condition. However, the use of test flights before the main flights (see ) should reduce such influence. Also, it is clear that long term effects of using the tactile belt on user experience scores were not a focus of our study design.
An additional measure of performance that could have been employed is the deviation from an optimal flight path, e.g., a flight path made up of straight lines between the objects. However, limitations of the simulator would have made this quite complex given the possibility for the pilots to fly back towards the target object after missing it and receiving a strike.
While the study was designed to be accessible to laymen to be able to recruit enough participants (particularly considering that the study was executed during the COVID-19 pandemic), it also led to simplifications and generalizations of the tasks, controls, and the simulated environment. The results from the study should therefore transfer well to novice pilots, but might provide less validity for expert pilots.
A noticeable number of participants remarked the low difficulty of identifying the visible objects. This was a problem introduced by Prepar3D’s rendering priorities, as additionally placed objects would always be rendered earlier than randomly generated objects. It seems like participants with either experience in flight simulators or other digital environments such as video games were able to notice the rendering differences. The target objects were also better noticeable due to aliasing effects, which was especially apparent for the thinner objects such as the antenna or the windmill. However, these effects were present in both conditions and therefore did not give either condition an inadvertent advantage.
Some of the participants had real-life or simulated flight experience which may have influenced the study outcome concerning the performance and cognitive workload differences. For example, one participant always inspected the called out direction before initiating the flight maneuver and explained that due to the extended piloting experience there was an automatism to first making sure that no incoming traffic or other obstacles were impeding their maneuvers. Similarly, participants more experienced in maneuvering aircraft may have been less stressed overall. Given our within-subject design these experience differences should not have biased our study results as it affected both conditions.
Finally, the lab study may be considered a limitation, as one participant with piloting experience noted that she was not sure whether the current implementation of the belt would work well in a general aviation aircraft. Her reasoning was that, due to the compact design of such an aircraft, vibrations from the engine would make the vibrations of the belt less noticeable. Another participant with a piloting license did not agree with this thought though, as she expected the belt’s vibrations to work as intended in a smaller aircraft as well.
6. Conclusion
This article assessed the benefits of utilizing a tactile belt with eight vibration motors for conveying directional information to pilots. The motivation behind this approach is based on the overall heavy reliance on audiovisual information in the cockpit. Especially novice pilots may quickly become overwhelmed by the amount of information in need of processing. Thus, following the multi resource theory (Basil, Citation2012), additional supportive information is instead conveyed using the tactile modality. The tactile modality is assumed to not interfere with the cognitive resources required to process the audiovisual information and is not fully exploited as part of the human-computer interaction in aircraft today.
The effects of the tactile belt were assessed with regard to pilots’ object identification performance, user experience, spatial awareness, and cognitive workload as part of a counterbalanced within-subject simulator study. 22 participants were asked to fly along a predefined route and look for specific objects in the simulated environment. While doing so, the participants were wearing an eye tracker that allowed the experimenter to evaluate their progress in the study and adjust the belt’s vibrations following a wizard-of-oz principle.
The results showed that while wearing the belt, the participants had a significantly lower number of missed targets, required significantly less time to identify the objects, while reporting significantly lower perceived cognitive workload compared to not wearing a belt. The usability and user experience of the system with the tactile belt were also rated significantly higher compared to the system without the belt. The spatial awareness of participants measured by the sketch maps they drew after each flight (with and without the belt) did not show any significant differences between the two. However, the interviews carried out at the end of each study supported the overall positive findings, with 86% of participants preferring the flight with the belt. A commonly mentioned advantage of using this wearable were the help it offered in judging the direction to the next target object. This reduced the area participants had to monitor on the simulator screen, increasing their efficiency in the object identification task. However, the reduced monitored area in the outside view presumably had a contradictory effect and reduced their spatial awareness of the outside world.
The study results show that a tactile belt is a promising way of communication and relaying information in the cockpit. It significantly supports pilots in identifying objects in the environment in an unobtrusive way, which is essential when flying under VFR and executing a landing maneuver. This shows that vibrotactile feedback provides effective assistance for target search and orientation in simulated flight and that such complex tasks can in fact be significantly enhanced as postulated by amongst others Burke et al. (Citation2006) and McGuirl and Sarter (Citation2001). The use of the tactile modality to convey spatial information can also be viewed as an extension of the multiple resource theory as described by Wickens (Citation2008b). The tactile interaction adds another level to the modalities dimension in the 4-D multiple resource model, as previously defined by Wickens.
7. Outlook
The outcome of this study shows that exploring tactile feedback as a way to enhance the human computer interface in cockpits, particularly in the context of VFR and for novice pilots is worth further research. Future research could include novice pilots of a flight school flying under VFR in a real-world study setup or a higher fidelity simulator. Moreover, the scenarios could be chosen to reflect more complex environments and increase the workload by introducing additional factors such as wind shears.
Further use cases for vibrotactile feedback in aviation can be explored. A collision alert similar to the ground-proximity warning system (ground collision) or the traffic collision avoidance system (mid-air collision) could be implemented. Other examples may include warnings for entering restricted or controlled airspace or a landing assistance which conveys the distance towards the landing strip or indicate the aircraft’s relative position through tactile feedback.
Additionally, other types of tactile displays can be assessed as part of future work, e.g., Jansen et al. (Citation2008) already demonstrated an implementation of a tactile vest for helicopter landing applications instead of a belt. A similar tactile vest could provide higher resolution and more directional information to the user, e.g., about the vertical location of an object relative to the own aircraft. Additionally, distance and speed of the object could be encoded in the vibration pattern or by adapting frequency, duration, amplitude and locus of the vibration.
Other extensions of the presented study could introduce a different role to the eye tracking. In this article eye tracking was primarily used for analysis, but applications could be similar to what was introduced by Anagnostopoulos et al. (Citation2017) who tracked the user’s gaze and provided guidance if users continuously dwelled over an area of interest. The system could also use vibration signals to direct the attention to an instrument or monitor.
Acknowledgements
We thank all our participants who took part in our study, despite the circumstances of the COVID-19 pandemic. Moreover, we thank Charalampos Gkonos for providing us with the tactile belt to adapt and use for our work. Finally, we thank Lufthansa Aviation Training Switzerland for providing us with the flight simulator.
Disclosure statement
No potential conflict of interest was reported by the author(s).
Additional information
Notes on contributors
Luis Lutnyk
Luis Lutnyk is a doctoral student at the Chair of Geoinformation Engineering of ETH Zurich. His research focuses on human-computer interaction, especially in aviation. He is currently exploring the use of eye tracking in the cockpit and how novel interactions can help pilots and improve pilot training.
David Rudi
David Rudi is currently employed as senior consultant. He previously conducted his post-doctoral research at the Chair of Geoinformation Engineering of ETH Zurich with focus on the aviation domain. He completed his doctoral studies with focus on enhancing spatial awareness of commercial aviation pilots.
Emanuel Meier
Emanuel Meier is currently employed as a GIS specialist and product analyst, focusing on obstacles and terrain in an aviation context. He concluded his master’s programme in Geomatics at ETH Zurich, specializing in the GIS and navigation fields.
Peter Kiefer
Peter Kiefer is a Senior Scientist, leading the geoGAZElab at the Chair of Geoinformation Engineering at ETH Zurich. His research is concerned with assisting humans in spatial decision situations by the use of eye tracking. Peter Kiefer’s research is interdisciplinary, bridging Geographic Information Science, Eye Tracking, and Human-Computer Interaction.
Martin Raubal
Martin Raubal is professor of geoinformation engineering at ETH Zurich. His research interests focus on spatial decision-making for sustainability, more specifically he concentrates on analyzing spatio-temporal aspects of human mobility, spatial cognitive engineering, and mobile eye-tracking to investigate visual attention while interacting with geoinformation and in spatial decision situations.
Notes
References
- Anagnostopoulos, V., Havlena, M., Kiefer, P., Giannopoulos, I., Schindler, K., & Raubal, M. (2017). Gaze-informed location-based services. International Journal of Geographical Information Science, 31(9), 1770–1797. https://doi.org/10.1080/13658816.2017.1334896
- Basil, M. D. (2012). Multiple resource theory. In Encyclopedia of the sciences of learning (pp. 2384–2385). Springer US.
- Billinghurst, M., & Weghorst, S. (1995, March). The use of sketch maps to measure cognitive maps of virtual environments. In Proceedings Virtual Reality Annual International Symposium ’95 (pp. 40–47). https://doi.org/10.1109/VRAIS.1995.512478
- Biondi, F., Leo, M., Gastaldi, M., Rossi, R., & Mulatti, C. (2017). How to drive drivers nuts: effect of auditory, vibrotactile, and multimodal warnings on perceived urgency, annoyance, and acceptability. Transportation Research Record: Journal of the Transportation Research Board, 2663(1), 34–39. https://doi.org/10.3141/2663-05
- Blades, M. (1990). The reliability of data collected from sketch maps. Journal of Environmental Psychology, 10(4), 327–339. https://doi.org/10.1016/S0272-4944(05)80032-5
- Bolton, M. L., & Bass, E. J. (2009). Comparing perceptual judgment and subjective measures of spatial awareness. Applied Ergonomics, 40(4), 597–607. https://doi.org/10.1016/j.apergo.2008.04.020
- Brooke, J. (1996). SUS – A quick and dirty usability scale (P. W. Jordan, B. Thomas, I. L. McClelland, & B. Weerdmeester, Eds.). Taylor & Francis.
- Burke, J. L., Prewett, M. S., Gray, A. A., Yang, L., Stilson, F. R. B., & Coovert, M. D. (2006). Comparing the effects of visual-auditory and visual-tactile feedback on user performance: A metaanalysis [Paper presentation]. In The 8th International Conference, ICMI ’06: Proceedings of on Multimodal Interfaces, Banff, Canada. https://doi.org/10.1145/1180995.1181017
- de Vries, S. C., van Erp, J. B. F., & Kiefer, R. J. (2009). Direction coding using a tactile chair. Applied Ergonomics, 40(3), 477–484. https://doi.org/10.1016/j.apergo.2008.09.008
- Dehais, F., Causse, M., Vachon, F., Régis, N., Menant, E., & Tremblay, S. (2014). Failure to detect critical auditory alerts in the cockpit: Evidence for inattentional deafness. Human Factors, 56(4), 631–644. https://doi.org/10.1177/0018720813510735
- Di Stasi, L. L., & Diaz-Piedra, C. (2019). Eye movements research in aviation: Past, present, and future. In Improving aviation performance through applying engineering psychology, advances in aviation psychology (Vol. 3, pp. 143–162). CRC Press.
- Duchowski, A. T. (2017). Eye tracking methodology – Theory and practice (3rd ed., Vol. 328). Springer International Publishing. https://doi.org/10.1007/978-3-319-57883-5
- Durá-Gil, J. V., Bazuelo-Ruiz, B., Moro-Pérez, D., & Mollà-Domenech, F. (2017). Analysis of different vibration patterns to guide blind people. PeerJ, 5, e3082. https://doi.org/10.7717/peerj.3082
- Egenhofer, M. J. (1997). Query processing in spatial-query-by-sketch. Journal of Visual Languages & Computing, 8(4), 403–424. https://doi.org/10.1006/jvlc.1997.0054
- Elliott, L. R., van Erp, J., Redden, E. S., & Duistermaat, M. (2010). Field-based validation of a tactile navigation device. IEEE Transactions on Haptics, 3(2), 78–87. https://doi.org/10.1109/TOH.2010.3
- Endsley, M. R. (1995). Toward a theory of situation awareness in dynamic systems. Human Factors: The Journal of the Human Factors and Ergonomics Society, 37(1), 32–64. https://doi.org/10.1518/001872095779049543
- Endsley, M. R., Farley, T. C., Jones, W. M., Midkiff, A. H., Hansman, R. J. (1998). Situation awareness information requirements for commercial airline pilots (Tech. Rep.). Massachusetts Institute of Technology: International Center for Air Transportation. https://ntrs.nasa.gov/search.jsp?R=20020030334
- Eurocontrol. (2009). European Organisation for the Safety of Air Navigation, guidance notes for pilots - 1. Rules for VFR Flight. http://www.skybrary.aero/bookshelf/books/716.pdf
- Forbus, K. D., Usher, J. M., Lovett, A. M., Lockwood, K., & Wetzel, J. (2008). Cogsketch: Open-domain sketch understanding for cognitive science research and for education. In Eurographics workshop on sketch-based interfaces and modeling (pp. 159–166). The Eurographics Association. http://dx.doi.org/10.2312/SBM/SBM08/159-166
- Friedman, A., & Kohler, B. (2003). Bidimensional regression: Assessing the configural similarity and accuracy of cognitive maps and other two-dimensional data sets. Psychological Methods, 8(4), 468–491. https://doi.org/10.1037/1082-989X.8.4.468
- Gallace, A., Tan, H. Z., & Spence, C. (2006). The failure to detect tactile change: A tactile analogue of visual change blindness. Psychonomic Bulletin & Review, 13(2), 300–303. https://doi.org/10.3758/bf03193847
- Gardony, A. L., Taylor, H. A., & Brunyé, T. T. (2016). Gardony map drawing analyzer: Software for quantitative analysis of sketch maps. Behavior Research Methods, 48(1), 151–177. https://doi.org/10.3758/s13428-014-0556-x
- Gkonos, C., Giannopoulos, I., & Raubal, M. (2017). Maps, vibration or gaze? Comparison of novel navigation assistance in indoor and outdoor environments. Journal of Location Based Services, 11(1), 29–49. https://doi.org/10.1080/17489725.2017.1323125
- Hart, S. G. (2006). Nasa-task load index (nasa-tlx); 20 years later. Proceedings of the Human Factors and Ergonomics Society Annual Meeting, 50(9), 904–908. https://doi.org/10.1177/154193120605000909
- Helmreich, R. L., & Foushee, H. C. (2010). Why CRM? Empirical and theoretical bases of human factors training. In Crew resource management (pp. 3–59). Academic Press.
- Heuten, W., Henze, N., Boll, S., & Pielot, M. (2008). Tactile wayfinder: A non-visual support system for wayfinding [Paper presentation]. The 5th Nordic Conference, Proceedings of on Human-Computer Interaction: Building Bridges (pp. 172–181).
- Hogema, J. H., De Vries, S. C., Van Erp, J. B., & Kiefer, R. J. (2009). A tactile seat for direction coding in car driving: Field evaluation. IEEE Transactions on Haptics, 2(4), 181–188. https://doi.org/10.1109/TOH.2009.35
- Holmqvist, K., Nyström, M., Andersson, R., Dewhurst, R., Jarodzka, H., & de Weijer, J. V. (2011). Eye tracking: A comprehensive guide to methods and measures. OUP.
- Ho, C., Tan, H. Z., & Spence, C. (2005). Using spatial vibrotactile cues to direct visual attention in driving scenes. Transportation Research Part F: Traffic Psychology and Behaviour, 8(6), 397–412. https://doi.org/10.1016/j.trf.2005.05.002
- Ho, C.-Y., Nikolic, M. I., & Sarter, N. B. (2001). Multimodal information presentation in support of timesharing and effective interruption management [Paper presentation]. 20th Digital Avionics Systems Conference, Daytona Beach, USA.
- Jansen, C., van Erp, J., van Veen, H.-J., Vos, W., Groen, E., & Duistermaat, M. (2008). Supporting skill acquisition using vibrotactile feedback. https://citeseerx.ist.psu.edu/viewdoc/download?doi=10.1.1.389.8371&rep=rep1&type=pdf
- Jones, L. A., & Sarter, N. B. (2008). Tactile displays: Guidance for their design and application. Human Factors, 50(1), 90–111. https://doi.org/10.1518/001872008x250638
- Kozlowski, L. T., & Bryant, K. J. (1977). Sense of direction, spatial orientation, and cognitive maps. Journal of Experimental Psychology: Human Perception and Performance, 3(4), 590–598. https://doi.org/10.1037/0096-1523.3.4.590
- Lewis, J. R., & Sauro, J. (2018). Item benchmarks for the system usability scale. Journal of Usability Studies, 13(3), 158–167. https://uxpajournal.org/item-benchmarks-system-usability-scale-sus/.
- Liggett, K. (2009). Controls, displays, and crew station design. In Handbook of aviation human factors (pp. 15-1–15-36). CRC Press.
- McGuirl, J. M., & Sarter, N. B. (2001). Presenting in-flight icing information: A comparison of visual and tactile cues [Paper presentation]. 20th Digital Avionics Systems Conference, Daytona Beach, USA.
- Montello, D. R., & Raubal, M. (2013). Functions and applications of spatial cognition. In D. Waller & Nadel L. (Eds.), Handbook of spatial cognition (pp. 249–264). American Psychological Association. https://doi.org/10.1037/13936-014
- Murphy, S., & Dalton, P. (2016). Out of touch? Visual load induces inattentional numbness. Journal of Experimental Psychology. Human Perception and Performance, 42(6), 761–765. https://doi.org/10.1037/xhp0000218
- Parush, A., Ahuvia, S., & Erev, I. (2007). Degradation in spatial knowledge acquisition when using automatic navigation systems [Paper presentation]. International Conference on Spatial Information Theory (pp. 238–254).
- Peißl, S., Wickens, C. D., & Baruah, R. (2018). Eye-tracking measures in aviation: A selective literature review. The International Journal of Aerospace Psychology, 28(3–4), 98–112. https://doi.org/10.1080/24721840.2018.1514978
- Pielot, M., Boll, S. (2010). Tactile wayfinder: Comparison of tactile waypoint navigation with commercial pedestrian navigation systems [Paper presentation]. International Conference on Pervasive Computing (pp. 76–93).
- Portugali, J. (1996). The construction of cognitive maps (Vol. 32). Springer Science & Business Media. https://link.springer.com/book/10.1007%2F978-0-585-33485-1
- Prinet, J. C., Wan, Y., & Sarter, N. (2016). Tactile spatial guidance for collision avoidance in nextgen flight operations. Proceedings of the Human Factors and Ergonomics Society Annual Meeting, 60(1), 303–307. https://doi.org/10.1177/1541931213601069
- Rantala, J., Majaranta, P., Kangas, J., Isokoski, P., Akkil, D., Špakov, O., & Raisamo, R. (2020). Gaze interaction with vibrotactile feedback: Review and design guidelines. Human–Computer Interaction, 35(1), 1–39. https://doi.org/10.1080/07370024.2017.1306444
- Rosa, E., Marsja, E., & Ljungberg, J. K. (2020). Exploring residual capacity: The effectiveness of a vibrotactile warning during increasing levels of mental workload in simulated flight tasks. Aviation Psychology and Applied Human Factors, 10(1), 13–23. https://doi.org/10.1027/2192-0923/a000180
- Rudi, D., Kiefer, P., & Raubal, M. (2020). The instructor assistant system (iASSYST) – utilizing eye tracking for commercial aviation training purposes. Ergonomics, 63(1), 61–79. https://doi.org/10.1080/00140139.2019.1685132
- Rudi, D. (2019). Enhancing spatial awareness of pilots in commercial aviation [Doctoral dissertation]. ETH Zurich, Zurich.
- Schrepp, M., Hinderks, A., & Thomaschewski, J. (2014). Applying the user experience questionnaire (UEQ) in different evaluation scenarios. In A. Marcus (Eds.), Design, user experience, and usability. theories, methods, and tools for designing the user experience. DUXU 2014. Lecture Notes in Computer Science (Vol. 8517). Springer.
- Schwering, A., Wang, J., Chipofya, M., Jan, S., Li, R., & Broelemann, K. (2014). Sketchmapia: Qualitative representations for the alignment of sketch and metric maps. Spatial Cognition & Computation, 14(3), 220–254. https://doi.org/10.1080/13875868.2014.917378
- Stähli, L., Rudi, D., & Raubal, M. (2018). Turbulence ahead – A 3D web-based aviation weather visualizer. In Proceedings of the 31st annual ACM symposium on user interface software and technology (pp. 299–311). ACM. https://doi.org/10.1145/3242587.3242624
- Sweet, W. (1995). The glass cockpit [flight deck automation]. IEEE Spectrum, 32(9), 30–38. https://doi.org/10.1109/6.406460
- Tannen, R. S., Nelson, W. T., Bolia, R. S., Warm, J. S., & Dember, W. N. (2004). Evaluating adaptive multisensory displays for target localization in a flight task. The International Journal of Aviation Psychology, 14(3), 297–312. https://doi.org/10.1207/s15327108ijap1403_5
- Thissen, D., Steinberg, L., & Kuang, D. (2002). Quick and easy implementation of the Benjamini-Hochberg procedure for controlling the false positive rate in multiple comparisons. Journal of Educational and Behavioral Statistics, 27(1), 77–83. https://doi.org/10.3102/10769986027001077
- Tolman, E. C. (1948). Cognitive maps in rats and men. Psychological Review, 55(4), 189–208. https://doi.org/10.1037/h0061626
- Trant, J. P. Jr, (1955). Preliminary investigation of a stick shaker as a lift-margin indicator (Tech. Rep.). https://core.ac.uk/download/pdf/42801880.pdf
- Tsukada, K., & Yasumura, M. (2004). Activebelt: Belt-type wearable tactile display for directional navigation. In UbiComp 2004: Ubiquitous computing (pp. 384–399). Springer Berlin Heidelberg.
- Van Baelen, D., Paassen, M. v., Ellerbroek, J., Abbink, D. A., & Mulder, M. (2021). Flying by feeling: Communicating flight envelope protection through haptic feedback. International Journal of Human–Computer Interaction, 37(7), 655–665. https://doi.org/10.1080/10447318.2021.1890489
- van Erp, J. B. F., van, Kroon, L. C. M., Mioch, T., & Paul, K. I. (2017). Obstacle detection display for visually impaired: Coding of direction, distance, and height on a vibrotactile waist band. Frontiers in ICT, 4(23), 23. https://doi.org/10.3389/fict.2017.00023
- Van Erp, J. B., & Van Veen, H. A. (2004). Vibrotactile in-vehicle navigation system. Transportation Research Part F: Traffic Psychology and Behaviour, 7(4–5), 247–256. https://doi.org/10.1016/j.trf.2004.09.003
- Van Erp, J. B., Self, B. (2008). Tactile displays for orientation, navigation and communication in air, sea and land environments (Tech. Rep.). https://apps.dtic.mil/dtic/tr/fulltext/u2/a492500.pdf
- Van Veen, H. A., Van Erp, J. B. (2000). Tactile information presentation in the cockpit [Paper presentation]. International Workshop on Haptic Human-Computer Interaction (pp. 174–181).
- Velázquez, R. (2010). Wearable assistive devices for the blind. In Wearable and autonomous biomedical devices and systems for smart environment (pp. 331–349). Springer.
- Vidulich, M. A., & Tsang, P. S. (2012). Mental workload and situation awareness (4th ed., pp. 243–273). John Wiley & Sons. https://doi.org/10.1002/9781118131350.ch8
- Wickens, C. D. (1995). Designing for situation awareness and trust in automation. IFAC Proceedings Volumes, 28(23), 365–370. https://doi.org/10.1016/S1474-6670(17)46646-8
- Wickens, C. D. (2002). Situation awareness and workload in aviation. Current Directions in Psychological Science, 11(4), 128–133. https://doi.org/10.1111/1467-8721.00184
- Wickens, C. D. (2008a). Aviation. In Handbook of applied cognition (pp. 361–389). John Wiley & Sons Ltd.. https://doi.org/10.1002/9780470713181.ch14
- Wickens, C. D. (2008b). Multiple resources and mental workload. Human Factors, 50(3), 449–455. https://doi.org/10.1518/001872008X288394
- Ziat, M., Wagner, S., & Frissen, I. (2016). Haptic feedback to compensate for the absence of horizon cues during landing. In Haptics: Perception, devices, control, and applications (pp. 47–54). Springer International Publishing.
- Ziv, G. (2016). Gaze behavior and visual attention: A review of eye tracking studies in aviation. The International Journal of Aviation Psychology, 26(3–4), 75–104. https://doi.org/10.1080/10508414.2017.1313096