
 ?Mathematical formulae have been encoded as MathML and are displayed in this HTML version using MathJax in order to improve their display. Uncheck the box to turn MathJax off. This feature requires Javascript. Click on a formula to zoom.
Abstract
Scientific texts convey new and complex information relevant not only to researchers but also to lay audiences. We present a randomized controlled trial that investigated whether showing a concept map, gradually building up as a user reads a scientific text, supports the cognitive processes of knowledge construction. The intervention group (n = 44) exhibited significantly more knowledge construction [t(89) = 1.94, p = .029, d = 0.41] than the control group (n = 47). The intervention supported basic knowledge construction, i.e., simple processing of information, but not medium and complex levels. This study makes two contributions: (1) showing interactive concept maps and building them up gradually alongside reading helps make scientific texts cognitively more accessible to a lay audience, e.g., to inform public debate, and (2) knowledge construction theory can be used as a theoretical foundation for measuring specific aspects of learning processes—complementing other metrics for comparative design examinations, e.g., usability, user experience, or performance-based measures.
1. Introduction
Scientific texts tend to convey complex and, in the case of original publications, new information (Plavén-Sigray et al., Citation2017; Rowan, Citation1991). An obvious target audience are experts from the domain in which the text is situated. However, there are good reasons why a wider audience could and should be interested in scientific texts: first, in interdisciplinary academic discourse, it is necessary to integrate knowledge from multiple fields; second, many academic research topics are of interest in public debate and policy-making whether they are on climate change or vaccinations, for instance; and third, business is always looking toward research as the impulse for innovation.
Scientific texts are “informative texts as they provide information for their readers” (Yildiz, Citation2015, p. 257), their purpose is “to discuss a scientific problem which forms the subject of their study” (Yildiz, Citation2015, p. 257), and they should “enable readers to get knowledge on a specific scientific issue” (Yildiz, Citation2015, p. 257). Accessing scientific texts is, in some ways, being made increasingly easy due to ongoing efforts of open science (Vicente-Saez & Martinez-Fuentes, Citation2018). This means that many scientific texts are now accessible without extra pay, technically accessible in standard formats (e.g., PDF), and further accessibility efforts, such as alternative image descriptions, are gaining traction. Such accessibility, however, is no guarantee that readers will understand the content, even if the text is well written: simply reading a text does not guarantee comprehension, since constructing knowledge from new information requires substantial cognitive effort (Dole & Sinatra, Citation1998). Moreover, the “readability of scientific texts is decreasing over time” (Plavén-Sigray et al., Citation2017, p. 1); due to the growing complexity of formulations and content (Rowan, Citation1991). Consequently, it becomes more difficult for a lay audience to understand such content (Flemming et al., Citation2020; Rowan, Citation1991; Salita, Citation2015). Complementing the discourse on accessibility in human–computer interaction (HCI) that targets accessibility of content toward an audience with special perceptual or motor-skills-based needs, we consider this a cognitive accessibility issue. The fundamental question that motivates our research is how interface and information design can support such cognitive accessibility and thereby help that knowledge encoded in a scientific text can be taken up by lay audiences.
2. Background
2.1. Knowledge construction
Knowledge construction refers to the process of actively acquiring and developing new knowledge and new understanding (van Aalst, Citation2009). Literature on knowledge construction differentiates between individual knowledge construction as a cognitive process and collaborative knowledge construction as a socio-cognitive process. Individual knowledge construction is based on notions of constructivism (Castle, Citation1997; Cress & Kimmerle, Citation2008; Novak, Citation1993; van Aalst, Citation2009), which postulate that information from the environment is not simply adopted as is. Instead, the newly acquired information is cognitively processed in the sense that it is adapted, assimilated, and reflected upon; prior knowledge must be consolidated accordingly. Thus, knowledge is actively constructed in relation to learners’ prior knowledge, such that existing knowledge influences what is learned as new concepts need to be integrated into prior knowledge (van Aalst, Citation2009). Collaborative knowledge construction refers to a socio-cognitive process in which individual knowledge is made available to others (externalized) and collaboratively negotiated. An essential element in this process is consensus building, typically enabled by an initial dissonance of ideas within the group, integration of these ideas, and subsequent co-construction of knowledge available in the group as a whole (Fischer et al., Citation2002; Gunawardena et al., Citation1997; Hmelo-Silver, Citation2003; Stahl, Citation2000).
Moreover, prior literature understands both individual and collaborative knowledge construction as multi-level processes in which basic knowledge construction levels are necessary prerequisites for more complex levels. While works in educational technology use the concept of knowledge construction to denote a particular type of learning (e.g., Harbarth et al., Citation2018; Liaw & Huang, Citation2006), most do not consider knowledge construction theory (including distinct levels) to study this process and thereby miss access to understanding the fine-granular underlying processes. In this work, we address individual knowledge construction and understand its constituent levels as described by Dole and Sinatra (Citation1998): simple processing (I), assimilation (II), deeper processing/reflection (III), knowledge restructuring (IV), and meta-cognitive processing (V). Dole and Sinatra (Citation1998) have grouped these levels into categories, classifying the first two levels, simple processing and assimilation, as low levels, deeper processing/reflection as medium level, and knowledge restructuring and meta-cognitive processing as high levels. summarizes these levels and respective categories.
Table 1. Descriptions and categories of individual knowledge construction levels along Dole and Sinatra (Citation1998).
2.2. Designing for knowledge construction
A considerable amount of research in HCI and the adjacent field of educational technology has been carried out on technological support for knowledge construction on the one hand (see Disch et al., Citation2022 for a recent overview) and reading on the other (e.g., McNamara, Citation2007). At the intersection of such research, it has been investigated how to support knowledge construction during reading (e.g., Harbarth et al., Citation2018; Liaw et al., Citation2010) with adaptive and intelligent systems for learning being a salient type of technological approach (e.g., Aleven et al., Citation2016; D’Mello & Graesser, Citation2013). Another approach to supporting knowledge construction during reading is to present content in a multimodal way, the underlying rationale being that multimodal presentation facilitates the comprehension of complex texts (Burton-Jones & Meso, Citation2008; Serafini, Citation2015). Based on this fundamental principle, research has explored a plethora of ways to visually augment text (Shams & Seitz, Citation2008), such as using data visualization (Sultanum et al., Citation2018), animated transitions between different parts of text (Chevalier et al., Citation2010), or text integrated into videos and 3D graphics (Jankowski et al., Citation2010). In this context, concept maps are a way to visualize knowledge in a way that reflects the human cognitive representation of knowledge (Medin, Citation1989; Novak, Citation1993). As knowledge construction theory points out the importance of connecting and integrating new concepts into existing knowledge during the learning process, we consider concept maps a particularly interesting intervention for making complex scientific texts cognitively more accessible. Below we discuss in detail extant literature regarding concept maps visualization (Cañas et al., Citation2005; Eppler, Citation2006; Nesbit & Adesope, Citation2006; Novak, Citation1993; Novak & Gowin, Citation1984; Padilla et al., Citation2017), concept map authoring and generation (Falke, Citation2019; Kowata et al., Citation2010; Presch, Citation2020; Valerio et al., Citation2012; Zouaq & Nkambou, Citation2008, Citation2009), and how concept maps support knowledge construction and learning (Chang et al., Citation1997; Collins & Nyenhuis, Citation2021; Eppler, Citation2006; Morsi et al., Citation2007; Novak, Citation1993; O’Donnell et al., Citation2002; Sun et al., Citation2004).
2.3. Concept maps
A concept map (Novak & Gowin, Citation1984) is a visual representation of information that is structured as consisting of concepts and their connections and is visualized in the form of a node-link assembly (Nesbit & Adesope, Citation2006). In this, nodes represent concepts, and links between nodes represent the conceptual connections between concepts.
2.3.1. Concept map visualization
Various works suggest design rationales for concept map visualizations (e.g., Cañas et al., Citation2005; Novak, Citation1993; Padilla et al., Citation2017), such as to word concept labels as short as possible (Cañas et al., Citation2005), and to allow blank spaces between (groups of) concepts (Padilla et al., Citation2017) in the map. However, concrete design rationales depend on the context in which the concept map is used (Padilla et al., Citation2017); hence, more general visualization principles need to be relied on (e.g., Chen, Citation2013; Hicks, Citation2009).
2.3.2. Concept map authoring
Before visualizing a concept map, someone needs to create its content, i.e., define concepts and relations between concepts. This authoring can be done manually, semi-automatically, or fully automated. Substantial research has been directed at extracting concepts and their relations from unstructured texts using methods from natural language processing (e.g., Falke, Citation2019; Kowata et al., Citation2010; Valerio et al., Citation2012; Zouaq & Nkambou, Citation2008, Citation2009). In a review of such approaches, Kowata et al. (Citation2010) highlight exciting results on automatically authored concept maps and learning (Zouaq & Nkambou, Citation2008, Citation2009). Also, Valerio et al. (Citation2012) show that an automatically generated concept map can support a user in understanding key points made in a document to assess its relevance. Overall, however, automatically generated concept maps may fail to fully convey the mental knowledge model of an expert (Presch, Citation2020), and it seems more realistic to assume that automatically generated concept maps are the input to human (manual) post-editing if the quality of the concept map is relevant (Falke, Citation2019; Kowata et al., Citation2010).
Concept maps can also be manually created. In this article, we distinguish two possibilities of manual creation. First, users can create concept maps as part of the reading and learning process—we refer to these as self-created concept maps. The creator and user of the map are the same person. Second, concept maps can be created by someone other than the user of the map—we refer to these as predefined concept maps because they are defined before they are used. The creator and user of the map are different entities. In the case of manual generation, this instance is a human, e.g., the document authors, an expert, or a teacher who creates the concept map specifically for a text. In the case of fully automated concept map generation, the predefining instance is a computer. In the case of semi-automatic concept map generation, a human defines the concept map with the help of a concept mining algorithm. Concept map quality and process efficiency (time spent on authoring vs. quality of concept map) are of concern for predefined concept maps. Below we discuss the literature on concept maps and their impact on learning and knowledge construction separately, as the involved learning mechanisms are different.
2.3.3. Self-Generated concept maps, learning, and knowledge construction
Concept maps that are self-generated serve as a tool for active learning (Collins & Nyenhuis, Citation2021; Morsi et al., Citation2007; O’Donnell et al., Citation2002). Typically, self-generated concept maps are used in contexts where there is a corrective instance, such as a teacher. Prior literature provides some if not ample, evidence that self-generated concept maps support understanding of information (Burton-Jones & Meso, Citation2008; Edmondson, Citation2005) and knowledge construction (Harbarth et al., Citation2018; Liu et al., Citation2020; Suthers et al., Citation2007); and further evidence that all individual knowledge construction levels are supported (deeper processing/reflection, knowledge restructuring, and meta-cognitive processing by Harbarth et al. (Citation2018); and all collaborative levels (Liu et al., Citation2020). Chang et al. (Citation2001) went one step further and investigated how different variants of concept maps (e.g., predefined vs. self-generated concept maps) can support the understanding of information in an online learning environment. They showed that a partially predefined concept map, which needs to be completed, supported the understanding of information more than a concept map that has to be created by users from scratch.
2.3.4. Predefined concept maps, learning, and knowledge construction
Typically predefined concept maps are investigated as complementing textually encoded knowledge (Burton-Jones & Meso, Citation2008; Chang et al., Citation2001), described as a “systematic, proven approach to provide overview” (Eppler, Citation2006) that enable “rapid information provision” (Eppler, Citation2006). Used that way, concept maps serve as a tool for receptive learning (O’Donnell et al., Citation2002) and support “the direction of learning […] from written or spoken form to meaning” (Webb, Citation2012). Predefined concept maps (e.g., by experts) are assumed to represent correct knowledge. Prior work focused on assessing the impact of concept maps on learning outcomes (Chang et al., Citation1997; Novak, Citation1993; Valerio et al., Citation2012) and knowledge construction (Sun et al., Citation2004) in e-learning settings. Novak and Cañas (Citation2006) investigated the influence of predefined concept maps on the learning outcome in an online learning environment. Their results show that such concept maps help users to build a solid knowledge foundation and serve as a complementary instrument for learning complex topics. In a study on predefined automatic concept maps, Valerio et al. (Citation2012) showed that automatically generated predefined concept maps supported reading and comprehension of texts from different areas (e.g., an article about a suspension bridge). Sun et al. (Citation2004) show that concept maps that visualize learning goal definitions, expected learning outcomes, and relevant skills in an online e-learning environment support individual knowledge construction. Contrary to research on concept maps as a tool for active learning, prior research on predefined concept maps has not carried out assessments with respect to the kind of learning or the level of knowledge construction that is facilitated in relation to understanding complex texts. In this work, we ask how effective human-generated, predefined concept maps are in supporting knowledge construction, knowing that they require less cognitive effort and activity from users than self-generated concept maps and in settings where no interaction among learners or between learners and teachers can be expected.
2.4. Research question and hypotheses
The goal and question of our research was to investigate to what extent predefined concept maps as a complement for scientific texts support learning and knowledge construction, and in particular, which levels of knowledge construction are supported (RQ). As an intervention, we developed an interactive concept map that gradually builds up per paragraph as the users read through a scientific text. Based on the prior literature discussed above, we formulated the following directed hypotheses:
First Hypothesis (H1)—knowledge construction: The use of a gradually built-up concept map leads to more knowledge construction regarding a scientific text compared to simply reading the scientific text without a concept map. This hypothesis was directed toward the cognitive process of knowledge construction.
Second Hypothesis (H2)—learning outcome: The use of a gradually built-up concept map leads to more gain in factual knowledge about the content of the scientific text compared to simply reading the scientific text without a concept map. This hypothesis was directed toward the learning outcome.
We preregistered our study on AsPredicted.org to specify and record our research plan, including the formulated research questions and hypotheses in advance. In the present article, we investigated individual knowledge construction, while the preregistration also describes our future study plan to investigate the influence of the intervention on collaborative knowledge construction. Further, we conducted exploratory data analyses, in particular, to identify which knowledge construction levels were facilitated.
3. Methodology
3.1. Procedure
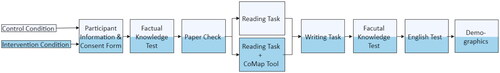
To answer the research question and test the hypotheses, we conducted an experimental study in a web environment. The study procedure is depicted in . First, study participants were asked to read the participant information sheet and fill in an informed consent form. After their agreement, they were randomly assigned to either the intervention or the control condition. In the second step, all participants answered a factual knowledge test on topics they would get to know during the study. In step three, every participant was asked to read the abstract of the scientific text we used in the study to determine whether the participants knew the publication. If a participant had known the publication, the participant would have been excluded from the rest of the study. In step four, the participants were asked to read the scientific text and take notes about its content. Participants had up to 45 min to accomplish this task but could continue before the time expired. Next, they were asked to summarize the publication along predefined criteria in their own words without having the scientific text available. In this step, they could use the notes they had previously taken. Participants were given 30 min for this task but could move on at any time before the given time expired. Afterward, the participants were asked to again fill in the same factual knowledge test. Finally, participants were tested for their competence in English (as the text was in English and most participants were not English native speakers) and provided some demographic information. While in the control condition, the participants followed precisely the procedure described above, in the intervention condition, the participants were shown an interactive, gradually built-up concept map alongside the scientific text. The intervention (CoMap tool) is described below in more detail. Overall, the participants took M = 1.28 (SD = 0.17) hours to complete the whole study procedure. As a reward for their participation, the study participants received bonus points for the respective university course.
Figure 1. Overall experimental procedure.
3.2. Participants
We recruited study participants in a computer science course at the bachelor level at TU Graz (“Introduction to Data Science and AI,” year of course withheld to support continued anonymity of participating students). Students who met minimum criteria, like completing the study and submitting a very basic reasonable summary, received bonus points for the course. The assignment of points in the course context was independent of the points a participant scored in the factual knowledge tests and the knowledge construction score their summary received during data analysis for our research purposes.Footnote1 To estimate the appropriate number of participants per group, we performed a power analysis using the G*Power 3 software (Faul et al., Citation2007, Citation2009). Based on previous literature on concept maps (see Background above), we expected a medium to strong effect (approx. Cohen’s d 0.5–0.8) for our hypotheses, resulting in a recommended sample size of n = 35–88 per group. Out of 431 students enrolled in this course, 97 students participated and completed the study. However, we had to exclude the data of six participants. Four participants were excluded because their English level was below A2 on the Cambridge general English short test. Two participants were excluded because their summary contained <200 words, resulting in n = 47 participants in the control and n = 44 participants in the intervention condition. Given our a priori power analysis described above, we consider the group sample sizes to be sufficiently large.
3.3. Materials
3.3.1. Reading material: Peer-reviewed scientific article
The scientific text that study participants were asked to read and summarize was an original research publication with the title “Leaning to the Left Makes the Eiffel Tower Appear Smaller: Posture-Modulated Estimation” by Eerland et al. (Citation2011). We selected this publication as the text is concise, rather short, and easy to understand (2, 015 words, estimated reading time: 8.47 min on average (reading time calculated according to Brysbaert, Citation2019). This was necessary to have an overall reasonable time for the experiment (if the experiment had taken too long, participants’ attention would have become an issue). Nonetheless, the article contains theories, such as “mental-number line theory” (Restle, Citation1970) and “anchoring-and-adjustment heuristic” (Tversky & Kahneman, Citation1974) that are not commonly known. Moreover, the article comes from the field of psychology and therefore did not relate to most participants’ primary field of study. This means that we could expect most participants not to know the article beforehand (which was an exclusion criterion). Further, this approximates our research’s underlying motivation, which is that of a general readership being interested in scientific texts outside their core area of expertise.
3.3.2. Computational environment for the experiment
The experiment was carried out via an interactive website which we implemented specifically for this purpose. The website consisted of four different views: an information view, a survey view, a reading view, and a writing view. The information view presented the text to participants without requiring any further action (e.g., presenting information on the landing page at the beginning of the study). The survey view presented questions in the form of a questionnaire. This view was used, for instance, to test study participants for factual knowledge, for their proficiency in English, and for demographic information.
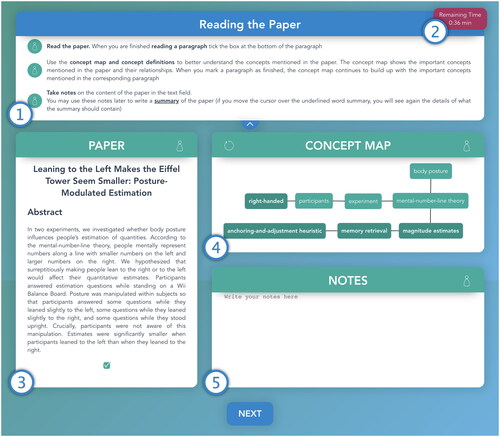
The reading view (see ) was the central part of the experiment. It consisted of five areas. The first area was located on top of the window and showed the description of the current task and a short summary about how to use the interface (see , point 1). The upper right corner shows how much time is left to perform the task. The reading task was scheduled for 45 min (see , point 2). This timing was deemed more than sufficient because the estimated reading time was much shorter (see above). Participants who did not complete the task in time were forced to proceed to the subsequent task. The third area in the reading view showed the scientific text (see , point 3). A checkbox was displayed below each text paragraph. When a study participant had finished reading a paragraph and ticked the checkbox below the paragraph, the concepts and their connections that correspond to the just-read paragraph were added to the concept map (CoMap tool), which was presented in the fourth area (see , point 4). The CoMap tool is described in more detail in the next subsection (Section 3.3.3). The fifth area in the reading view was the notes area in the bottom right corner (see , point 5). This area was a plain text field in which the study participants could take notes. These notes were saved on the server side to be used later during the writing task. The fourth area with the CoMap tool was only visible in the intervention group; thus, the notes area had to be extended for the control group and covered the whole right part of the reading view.
Figure 2. Reading view: reading task with concept map.
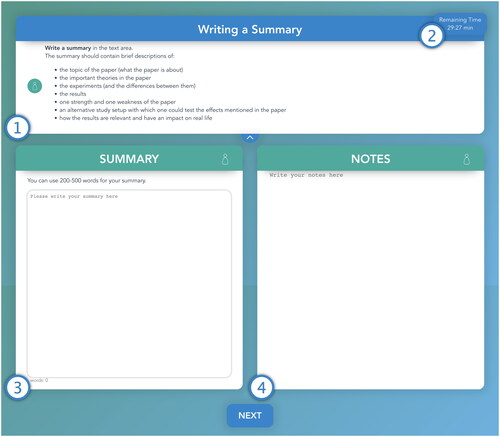
The writing view (see ) consisted of four areas. The first area (see , point 1) contained the information about the current task (a repetition of the information given to participants at the beginning of the experiment). Again, a timer was presented in the upper right corner (see , point 2). The writing task was scheduled for 30 min. Like in the reading task, the participants were forced to continue with the subsequent task after the foreseen time was elapsed. The third area was the summary writing area, where the participants had to write the summary of the article (see , point 3). The summary writing area was an editable text field whose content was saved in the database of the server every 2 s. The summary was finally saved when the participant left the writing view. The reasoning behind the periodical savings was to avoid data losses in the case of unexpected circumstances, such as disconnections or server crashes. The fourth area was the notes area (see , point 4), showing the notes that the study participant had taken during the reading task in the notes area. The notes were again editable and saved inside the database.
Figure 3. Writing view: writing task.
3.3.3. Intervention: CoMap tool
The CoMap tool is an interactive concept map. It visualizes concepts and their connections as a labeled graph. When a concept (=a node) is clicked on, a definition of the concept is shown (, point 4). In our experiment, the CoMap tool visualized core concepts and connections between concepts of the scientific text that study participants had to read and summarize as part of the experiment.
In particular, the concept map was built up paragraph by paragraph as participants read the publication. The gradual build-up was chosen based on cognitive load theory (Sweller et al., Citation1990), which states that processing too many pieces of information at once leads to cognitive overload of the working memory, which in turn hinders the learning process. To implement this functionality, the CoMap tool was linked to the reading view, which showed a checkbox that should be ticked after a paragraph of the scientific text had been read. The newly added concepts were colored in a slightly different shade so that users could easily see which new concepts were added to the concept map as a new paragraph had been read (as shown in ). The design rationale underlying this gradual build-up of the concept map was to avoid overloading study participants with a concept map representing the scientific text’s complete content from the beginning of reading the article. Concept map design characteristics followed selected design rationales as introduced in prior literature (Cañas et al., Citation2005; Padilla et al., Citation2017), i.e., brief concept labels (Cañas et al., Citation2005); no duplicated concept labels (Cañas et al., Citation2005); proximity, similarity, and connectedness in visualization (Padilla et al., Citation2017); and customizable complexity of visualization (Padilla et al., Citation2017). As it was implemented, the concepts that appeared in a text paragraph were always shown after the paragraph was read (and the checkbox below was clicked). The concept map, therefore, worked like a post-hoc summary of the just-read paragraph.
Technically, the CoMap tool read the concept map from a JSON file that defined nodes (concepts defined by a label and a longer textual description/definition) and connections (connections between nodes, defined by starting and ending points for each connection), and the exact position of the nodes. Node positions are optional, but nodes would be positioned automatically if missing. In our experiment, node positions were predefined to ensure that the concept map was visualized in precisely the same way to all study participants. A short video of the CoMap tool is available as Supplementary Material to this publication.
The content of the concept map (concepts, connections between concepts, concept labels, and definitions) was hand-crafted by two of this article’s authors (”concept map authors” below) based on the selected scientific text for this experiment. The rationale for manual creation was that (i) no concept map for this scientific text existed, and (ii) while tools for automatic concept map creation from text exist, we wanted to ensure a high quality of the content and a per-paragraph concept map. Note that the CoMap tool does not require the predefined concept map to be manually created; however, we needed to assume that the quality of the predefined concept map impacted the support it could give for knowledge construction.
We proceeded similarly as in a coding process: In the first step, the two concept map authors read the article independently and extracted a list of concepts per paragraph that were considered important for understanding the publication. Second, the two concept map authors compared the identified concepts and, in a reflective discussion, decided to remove several concepts deemed of lesser importance. In the third step, each concept’s occurrence was counted by counting words in the scientific text that referred to this concept. Concepts that occurred less than three times in the publication were also removed from the list of concepts. Finally, 24 concepts and their connections were selected to describe the scientific text. For each concept, the concept map authors created a definition based on reliable online sources in the field of psychology (e.g., APA Dictionary of Psychology American Psychological Association, Citation2018). This overall concept map consisted of seven subparts. Two more authors of this article reviewed the resulting concept map for understandability. All concepts and respective definitions are listed in the Supplementary Material.
3.4. Instruments and data collection
This section summarizes the instruments used for data collection along with the overall experimental procedure (see ).
3.4.1. Factual knowledge test (pre and post)
We designed a set of single-choice questions to test participants’ prior knowledge concerning the content of the reading material. Altogether we developed 12 questions asking about essential concepts, statistics, theories, and their implications, resulting in 12 points (see Supplementary Material).
This test was administered before and after participants read the text. It was used to test the second hypothesis (H2—learning outcome). The pre-factual knowledge score is the score (=number of correct answers given in the test) that participants achieved on the test before the reading and writing tasks. The post-factual knowledge score is the score participants achieved after the reading and writing tasks. The change in factual knowledge was calculated as the difference between the pre- and post-scores. We examined reliability by determining the internal consistency of the factual knowledge test by applying a split-half reliability analysis (Allen & Yen, Citation2002). After data collection, the questionnaire was randomly divided into two comparable halves. As a reliability coefficient, we calculated Guttman’s λ (Guttman, Citation1945) by using the splitHalf() function of the R package” psych” (Revelle, Citation2023). Guttman’s λ accounts for the potential effects of test shortening in split-half analyses. The calculated split-half reliability coefficient yielded a value of λ = .81, indicating a robust internal consistency within the factual knowledge test.
3.4.2. Knowledge construction scores for the summaries
In both the intervention and the control condition, we asked the participants to summarize the publication along the following criteria in the summary task: (i) the topics of the publication (what the publication is about), (ii) the theories mentioned in the publication, (iii) the two experiments presented and their differences, (iv) the results, (v) one strength and one weakness of the article, (vi) an alternative study design that could be used to test the effects mentioned in the publication, and (vii) the relevance of the results and possible real-life implications. The length of the summary was suggested to be between 200 and 500 words. Study participants who wrote shorter summaries were excluded from the data analysis. To enable the participants to keep track of the number of their written words, we implemented a word counter.
Every summary was coded by two members of the research team to calculate a knowledge construction score. The knowledge construction score of a summary expresses for each of the individual knowledge construction levels defined by Dole and Sinatra (Citation1998) to what extent the level is deemed present in a summary. We collaboratively developed a coding schema that operationalized knowledge construction levels described by Dole and Sinatra (Citation1998). The coding schema is summarized in . We describe the codes and illustrate each with excerpts from an example summary (the respective summary was rated with 16 out of 18 points). For each individual knowledge construction level (Dole & Sinatra, Citation1998), a summary could receive points: simple processing—four points; assimilation—six points; deeper processing/reflection—four points; knowledge restructuring—two points; meta-cognitive processing—two points. A summary that exhibited knowledge construction on all levels would receive an overall knowledge construction score of 18 points and respectively less if some levels were not observable in the summary. The overall knowledge construction score (sum of all points given) and the points scored on the single levels were used in the further analysis (see next Section).
Table 2. Coding schema developed for the summaries written in the writing task, schema is based on individual knowledge construction levels along Dole and Sinatra (Citation1998).
Two members of our research team independently rated the knowledge construction levels in the summaries using the developed coding scheme (see ); note that the two raters were not involved in the creation of the coding scheme to ensure impartiality in ratings. To assess the quality of the coding schema in terms of how clearly it explained how a summary should be scored, interrater reliability between the two researchers’ codings was computed. We used the intraclass correlation coefficient (ICC) (Koo & Li, Citation2016). Interrater reliability “reflects the variation between two or more raters who measure the same group of subjects” (Koo & Li, Citation2016). Our ICC = 0.89 can be considered a good absolute reliability (quality classification along Koo & Li, Citation2016). For further analyses, we used the average rating of both researchers as knowledge construction level scores of a single summary. The overall knowledge construction score was then built by summing up the level scores. The internal consistency of the knowledge construction score items was assessed by calculating Cronbach’s α coefficient using the alpha() function of the R package” psych” (Revelle, Citation2023). The calculation yielded a coefficient of α = .75, indicating good reliability (Kline, Citation2013).
3.4.3. English test
To measure the English proficiency of the study participants, we used the Cambridge general English short test (Cambridge University Press & Assessment, Citation2017b). The test consists of 25 questions that test general English abilities and is scored along the Cambridge English and recommendation scales (Cambridge University Press & Assessment, Citation2017a) (see Supplementary Material). We measured the participants’ English proficiency, as language proficiency influences text understanding (Hammadou, Citation1991). Participants with a language proficiency below language level A2 were excluded from our further analyses, as we assumed their low language proficiency would interfere with their fundamental ability to understand the text.
3.4.4. Demographic questions
We collected demographic data from the participants, namely gender, age, highest educational qualification, field of study, and duration of their studies.
3.5. Data analyses
We computed descriptive statistics for the English test, factual knowledge test (pre and post), and knowledge construction scores of the summaries. As primary analyses, we performed comparative statistics testing our two hypotheses:
We tested the first hypothesis (H1—knowledge construction) by conducting a two-sample t-test (one-tailed), comparing the intervention and control group’s overall individual knowledge construction scores. For fine-granular analyses of individual knowledge construction (Dole & Sinatra, Citation1998), we conducted two-sample t-tests (one-tailed) comparing the scores of the intervention and control group for (i) categories of levels and (ii) each level (overview of categories and levels in ).
We tested the second hypothesis (H2—learning) by conducting a two-sample t-test (one-tailed), comparing the pre- and post-factual knowledge scores and the factual knowledge gain (difference between the pre- and post-scores) of the intervention and control group.
4. Results
4.1. Demographic information, prior knowledge, and English proficiency
All study participants (N = 91) were university students. They were aged between 18 and 40 years (M = 22.53, SD = 4.26). 22 (24.18%) were female and 69 (75.82%) were male. The gender distribution in our study was slightly more balanced than the overall gender distribution in the university’s computer science bachelor degree course (females: 14.52%, males: 85.58%—% extracted from student statistics). In the intervention group (n = 43), 14 participants (31.82%) were female and 30 (68.18%) were male; in the control group (n = 47), 8 participants (17.02%) were female and 39 (82.98%) were male. A Chi-Square Test of Independence showed that these frequencies did not differ significantly [X2 (1, N = 89) = 2.71, p = .099]. On average, participants had studied for M = 2.46 (SD = 1.46) semesters and had the following main fields of studyFootnote2 (relative frequencies in %): engineering (72.53%), social sciences (5.49%), human sciences (5.49%), natural sciences (3.30%), theology (2.20%), and economics (1.10%). The distribution of disciplines is in line with the fact that the selected course is also promoted to students of non-computer science studies. The participants’ prior knowledge of the content of the scientific text was tested using the factual knowledge test described above. Overall, participants scored M = 5.47 (SD = 2.10) out of 12 possible points in the pre-knowledge test. Regarding English proficiency, participants scored M = 20.61 out of 25 possible points (SD = 2.13). This score corresponds—based on the Cambridge scale—to an independent (B1/B2) level of English [following the Common European Framework of Reference for Languages (CEFR) (Council of Europe, Council for Cultural Co-operation, Education Committee, Modern Languages Division, Citation2001)]. This indicates that the study participants had a reasonably good language proficiency overall, which is the prerequisite for understanding any text. We conducted two-sample t-tests to compare the age, semester of study, prior factual knowledge, and English proficiency of the intervention and control groups. The individual results are listed in and reveal no significant differences. Thus, the intervention and control groups can be considered equivalent in terms of gender (see Chi-Square Test above), age, semester of study, prior knowledge, and English proficiency.
Table 3. Two-sample t-tests comparing age, English proficiency, and semester of study of intervention and control group.
4.2. First hypothesis (H1)—Knowledge construction
Across both groups, participants (N = 91) reached M = 11.29 (SD = 3.20) out of 18 points as the overall knowledge construction score. Per level, the results were as follows: low levels score (combined): M = 6.10, SD = 1.30 (simple processing score: M = 2.64, SD = 0.59; assimilation score: M = 3.46, SD = 0.85); medium level score (deeper processing/reflection score): M = 2.63, SD = 1.38; high levels score (combined): M = 2.06, SD = 1.64 (knowledge restructuring score: M = 1.12, SD = 0.89; meta-cognitive processing score: M = 0.95, SD = 0.86).
To test our first hypothesis (H1) on knowledge construction, we compared the intervention and control group using a two-sample t-test one-tailed; statistical results are shown in . The analysis shows, with a small to medium effect, that the intervention group achieved a higher total score in knowledge construction than the control group, thus, supporting H1. To investigate in more detail which knowledge construction levels were facilitated by our intervention, we carried out exploratory analyses; however, they were not preregistered. We conducted two-sample t-tests (two-tailed) comparing the scores of the individual knowledge construction level categories (low levels, medium level, high levels) that combined single levels as shown in , as well as two-sample t-tests that compared the intervention and control group concerning each knowledge construction level (simple processing, assimilation, deeper processing/reflection, knowledge restructuring, meta-cognitive processing). Respective statistical results are shown in . The results show that the intervention group had higher scores in low knowledge construction levels compared to the control group, with a medium-sized effect. More detailed analyses of the individual knowledge construction levels further revealed that the intervention group achieved a higher score on simple processing than the control group, with a medium-sized effect. Yet, analyses revealed no significant differences between the two groups with regard to the assimilation level. Further, there were no differences between the two groups at medium or high levels of knowledge construction, namely deeper processing/reflection, knowledge restructuring, and meta-cognitive processing. This shows that our intervention—a gradually built-up concept map—supported knowledge construction at the low level, i.e., simple processing of information, but did not explicitly facilitate more complex knowledge construction.
Table 4. Two-sample t-tests comparing knowledge construction (KC) scores (overall and subscores of individual knowledge construction levels and categories along Dole and Sinatra (Citation1998) with respective maximum scores in brackets) of intervention and control group.
4.3. Second hypothesis (H2)—Learning outcome
Descriptive statistics for pre-, and post-factual knowledge scores and factual knowledge gains of participants overall, intervention, and control groups are shown in . Regarding our second hypothesis (H2), we compared each participant to the difference in their pre- and post-test scores (delta between pre- and post-scores), representing the factual knowledge gained per participant. We compared factual knowledge gains of intervention and control groups using a two-sample t-test (one-tailed) that revealed no significant difference between groups [t(89) = 0.79, p = .450]. This result does not support H2.
Table 5. Descriptive Statistics for pre-, post-factual knowledge scores and factual knowledge gain of participants overall, intervention, and control group.
We conducted further analyses to gain more insights into the factual knowledge scores: First, regarding differences in pre-factual knowledge scores, a two-sample t-test (two-tailed) revealed no significant difference [t(89) = –0.58, p = .565] between intervention and control group. Further, the analysis of post-factual knowledge scores using a two-sample t-test (two-tailed) exhibited no significant difference [t(89) = 0.38, p = .703] between the intervention and control group.
Second, as additional exploratory analysis (beyond preregistration), we analyzed whether both groups had gained factual knowledge through the reading and writing tasks, using within-subjects t-test (two-tailed). The analysis showed that both the intervention group [t(43) = –18.14, p = .001, d = 3.54] and the control group [t(46) = –18.85, p = .001, d = 3.37] exhibited significant gains in factual knowledge; these effects can be considered as very large.
5. Discussion
5.1. Knowledge construction
Our results show that the tested intervention—a predefined concept map built-up paragraph by paragraph as a user reads a scientific text—leads to more knowledge construction than simply reading the scientific text. This result supports our first hypothesis (H1) on knowledge construction. Further analyses showed that the intervention supports the basic knowledge construction level simple processing (significantly higher scores in the intervention group for this level and the category low). Our results show no significant differences in more complex knowledge construction levels deeper processing/reflection, knowledge restructuring, and meta-cognitive processes. These fine-granular results are stable both in an analysis per knowledge construction level and in an analysis that groups knowledge construction levels into the three categories low, medium, and high. These results go beyond the existing literature on predefined concept maps (Chang et al., Citation1997; Eppler, Citation2006; Novak, Citation1993; O’Donnell et al., Citation2002; Sun et al., Citation2004), which indicates that they support knowledge construction without investigating the specific levels. Our result that predefined concept maps support basic knowledge construction levels rather than more complex ones indicates that such maps are suitable complementary knowledge representations for scientific (=complex, new) texts when it is relevant to support recipients with little prior knowledge to gain a first understanding of the scientific content. This can be the case, for instance, when research is used to inform public debate, business innovation, or policy-making. Yet, predefined concept maps may not be sufficient to support contexts of use where more complex knowledge construction is required, e.g., when knowledge from the scientific text needs to be practically applied or otherwise re-contextualized.
5.2. Learning outcome
Contrary to our expectations, the intervention group did not gain significantly more factual knowledge about the content of the scientific text. Thus, our study does not support the hypothesis that a gradually built-up concept map leads to significantly more factual knowledge when offered alongside a scientific text (H2).
We see two possible explanations for this result. On the one hand, it could be that our intervention does not support acquiring factual knowledge beyond what readers acquire from the scientific text itself. This is improbable due to the previous literature on predefined concept maps (Chang et al., Citation1997; Eppler, Citation2006; Novak, Citation1993; O’Donnell et al., Citation2002; Sun et al., Citation2004) and our positive results on H1 (we did observe a learning process, namely knowledge construction). However, the literature frequently does not distinguish very well between different learning processes and outcomes. It could be that concept maps support constructing conceptual knowledge (this was tested with the summary writing task) but not the uptake and remembering of more isolated knowledge statements, which was tested in the pre- and post-factual knowledge tests. On the other hand, our methodology could have caused non-significant results. In that, we see three possible methodological reasons: First, the scientific text we used as reading material could have been so easy to understand that participants did not need a concept map to comprehend it. Since significantly more knowledge construction was observed in the intervention group, this is unlikely because study participants benefited (see results and discussion on H1) from the intervention. Second, we used the same knowledge test before and after the intervention. On the one hand, recognition effects could have occurred when participants repeated the test (Chan & McDermott, Citation2007). However, recognition was made more difficult for the participants by randomizing the order of the test questions and the answer options. On the other hand, participants might have selectively learned the information asked in the pre-knowledge test. However, it becomes evident from the summaries that they did not only focus on learning the facts from the pre-knowledge test but also integrated other facts into the summary than those asked in the knowledge test. Nonetheless, future research is needed to assess the intervention with knowledge tests with more items or a parallel version of the test. Third, the instrument we used to measure factual knowledge could have been not sensitive enough, i.e., the pre- and post-factual test was too easy. This interpretation is plausible because (i) we did not use a validated factual knowledge test (the test had to be specific to the information conveyed in the particular scientific text), and (ii) we have indications for the existence of a ceiling effect (Uttl, Citation2005; Wang et al., Citation2008) in the results. Our factual knowledge test consisted of 12 single-choice questions with 12 points as the maximum number of points that could be achieved; thus, this number represents the ceiling. If a participant gained more knowledge than was tested for, the points in the post-factual knowledge test could not represent this. Consequently, participants who scored lower on factual knowledge in the pre-test could achieve a higher knowledge gain. The analysis showed that 26 post-test scores reached our instrument’s upper limit (ceiling—12 points), and participants scored a total of 10.99 (SD = 0.81) points on average. We interpret this as indicating the ceiling effect (Austin & Brunner, Citation2003). In summary, we believe that the lack of support for H2 is due to this second methodological issue; however, only specific further experiments can answer this open question.
5.3. Implications for design
The fundamental question that motivates our research is how interface and information design can help that knowledge encoded in a scientific text can be taken up by lay audiences. This work has two implications for interface and information design, the first of which concerns specifically the design of cognitively accessible concept maps (Section 5.3.1) while the second concerns the process of evaluating computational interventions designed with this purpose (Section 5.3.2).
5.3.1. Designing cognitively accessible concept maps
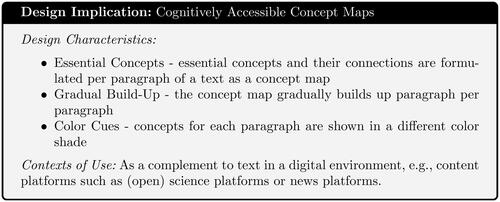
Our findings show that gradually built-up predefined concept maps are an appropriate visual complement for text when it is desirable to support basic levels of knowledge construction. Given the more specific use case targeted in our research, concept maps are a suitable complement to scientific texts when they target a lay audience. This is typical on online news platforms where public debate on scientific topics takes place and also applies to (open) science platforms that connect researchers across disciplines. Such interdisciplinary academic discourse is thus served by supporting the communication of results to audiences with differing domain knowledge. Further, it is a characteristic of current open science platforms that they are web-based and offer texts in a web-based format (Disch et al., Citation2022). This makes it technically easy to add an intervention, such as the CoMap tool, as described in this article. Beyond this, our intervention is in itself technologically simple (i.e., it does not need substantial computational power and algorithms) and can accompany any text visually in a digital environment. The intervention is similarly resource-efficient regarding the readers’ cognition—it is a reflective and passive learning intervention for supporting knowledge construction (e.g., as opposed to an intervention for active learning, like presenting a quiz or a problem to solve). Subsequently, we argue that an interactive, gradually built concept map as the CoMap tool is a good support for reading scientific texts in online environments. We argue that the following three are particular design characteristics that contribute to the positive results: (1) selection and formulation of essential concepts per paragraph, (2) gradual build of concept map during reading, and (3) concepts for each paragraph are shown in different colors (see ). In our work, we propose two specific design elements (i) gradually building up the concept map in parallel to the reading progress (per paragraph) and (ii) coloring based on the paragraph where concepts and connections first appear in the text.
Figure 4. Design implication: characteristics and context of use of the interactive and gradually built concept map (CoMap tool).
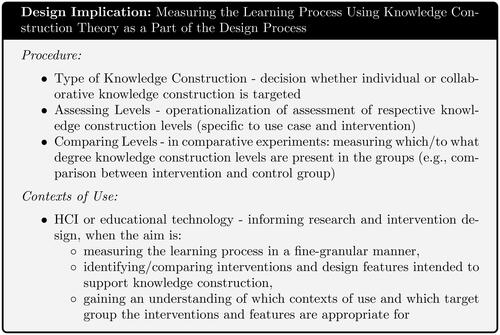
5.3.2. Measuring the learning process using knowledge construction theory as a part of the design process
The second design implication is of a methodological nature. In this study, we evaluated our intervention, the CoMap tool, using knowledge construction theory to understand the effect of the intervention on the learning process. Specifically, we used knowledge construction levels to understand in a fine-granular manner this process. In our case, the understanding that the fundamental knowledge construction levels seem to be mainly supported backs our desire to facilitate a lay audience to understand scientific texts. Supporting more complex knowledge construction, such as meta-cognition, may be desirable in other design scenarios. Designers could use our present study as an example of how to use knowledge construction theory to measure the learning process, especially using a measurement of the knowledge construction levels to gauge the applicability of the intervention they are studying to different contexts of use and different target groups (see ).
Figure 5. Design implication: measuring the learning process using knowledge construction theory as a part of the design process. The procedure described in this Figure corresponds to the process of using the knowledge construction theory We used in the present article. Note that Measuring the knowledge construction levels is task- and intervention-specific, so the operationalization We describe in this article can be used as an example blueprint but not directly transferred to any intervention.
We argue that knowledge construction theory provides an excellent theoretical baseline for application in HCI as (1) substantial literature both on individual and collaborative knowledge construction is available (Dole & Sinatra, Citation1998; Gunawardena et al., Citation1997) is available and describes fine-granular levels for both cases, (2) mature models that show the connection between individual and collaborative knowledge construction exist (Cress & Kimmerle, Citation2008; Kimmerle et al., Citation2015), and (3) previous literature has mapped knowledge construction theory to existing designs for computationally supporting knowledge construction (Disch et al., Citation2022). Thereby, with knowledge construction theory, HCI researchers have an extensive, theoretically and empirically well-elaborated framework of conceptual constructs at hand that supports the comparative examination of designs, complementing existing and widely used measures that target usability, user experience, or task performance.
5.4. Limitations and opportunities for future research
Reflecting on our work, we see the following promising research directions. They are connected to the limitations of our work in the sense that we did not investigate all interesting questions in-depth. First, following the literature on concept map design rationales (e.g., Cañas et al., Citation2005; Novak, Citation1993; Padilla et al., Citation2017), there is room for research on the influence of fine-granular design decisions. Our assumption that the gradual build-up of concept map eases cognitive load (see Section 5.3.1) could benefit from specific experiments. Further, research on the visual and interactive design of concept maps could investigate whether certain elements can support more complex knowledge construction (e.g., more interactive features, such as hiding read/learned concepts or indicating the number of concepts displayed).
Second, existing literature is inconclusive about how the design and content of concept maps should be personalized and tailored to the user (e.g., to prior knowledge). We assume, for instance, that novices could benefit from accessing in-depth explanations of concepts by clicking on nodes. Experts could benefit from a collapsed concept map that only expands as needed or from brief definitions without explanations. For design, this means (i) exploring interactive concept map representations that allow users to control the visual representation of the concept map and (ii) recommending different designs when the computer system is aware of user characteristics, such as background or knowledge (called user model, cp. e.g., Fischer, Citation2001). In this regard, future research efforts on predefined concept maps as an intervention for knowledge construction could connect to existing research on the use of artificial intelligence in education and adaptive systems for learning (cp. e.g., Aleven et al., Citation2016 for a general overview of adaptation strategies to support learning, and D’Mello and Graesser (Citation2013) for a specific intelligent tutoring intervention that supports reading).
Third, someone must produce a predefined concept map. This is a practical limitation of the tested intervention, though not an insurmountable one: for example, academic journals already ask authors to provide a summary and bulleted lists of the main findings of scientific articles—they could also ask authors to provide content for supplementary concept maps. Also, other stakeholders, such as academic publishers or open science platforms, could provide concept maps as a service that adds value to scientific content. In parallel with the considerations of whose responsibility it is to create the predefined concept maps, there are considerations of whether the creation could be (partially) automated. Extant literature (Falke, Citation2019; Valerio et al., Citation2012; Zouaq & Nkambou, Citation2008, Citation2009) (see also Section 2.3.2 above) gives reason for optimism. However, further research on automated concept maps is needed to optimize the trade-offs between algorithmic qualities, such as efficiency and accuracy on the one hand and support for knowledge construction (levels) on the other hand.
6. Conclusion
In conclusion, this work makes two contributions to HCI: (1) This work argues that it is desirable that audiences with different levels of (domain) knowledge can understand scientific texts for a variety of reasons, including interdisciplinary academic discourse, public debate, and policy-making, or business innovation. Design can facilitate the knowledge construction that is necessary to create such understanding. The experiment described in this article evidences that the intervention of showing a gradually built-up predefined concept map supports the fundamental level of individual knowledge construction, i.e., simple processing. This implies that this intervention is suitable for making scientific texts—being an essential type of research output—cognitively accessible to a lay audience. While effective, the intervention neither requires a teacher to be present nor readers to engage in a specific learning activity. Additionally, while a high-quality concept map for a scientific text is needed, no complex technology, such as for an intelligent tutoring-based intervention, is required. Therefore, the intervention can be integrated in a technically simple manner into a multitude of digital platforms. (2) We showcase how knowledge construction theory can be used as a theoretical foundation for measuring the learning process in a fine-granular manner by assessing which knowledge construction levels an intervention can support. This measurement of the knowledge construction process could be used when designing for knowledge construction as a complement to existing and widely-used metrics, such as usability, user experience, or performance-based measures, to evaluate design. This contribution is interesting for a wider part of HCI and educational technology research whenever the design goal is to support knowledge construction.
Ethical approval
This research was conducted following the principles of the Declaration of Helsinki and in compliance with the local legal requirements. This research was conducted in Austria; in Austria, non-clinical studies do not necessarily have to be approved by an ethics committee. At the time the study was conducted, there was no ethics committee at the authors’ university. Please note that we have checked the box “ethics approval” during submission to the International Journal of Human–Computer Interaction, as otherwise, a submission would not have been technically possible in the online form; this procedure was clarified beforehand with the journal editor Prof. Constantine Stephanidis. All participants received an information sheet informing them of their rights and the anonymity of the data. All participants gave written informed consent to participate in the study. All participants gave informed consent for anonymized publication. This study was preregistered on the aspredicted.org (Wharton Credibility Lab-University of Pennsylvania, Citation2015) website under AsPredicted #98212.
Supplemental Material
Download Zip (7.7 MB)Disclosure statement
No potential conflict of interest was reported by the author(s).
Additional information
Funding
Notes on contributors
Leonie Disch
Leonie Disch is a PhD candidate at the Institute for Interactive Systems and Data Science at the Graz University of Technology and a researcher at Know-Center Graz, Austria. She holds an MSc degree in psychology (with distinction). Her research focuses on supporting cognitive and socio-cognitive processes in human–computer interaction.
Angela Fessl
Angela Fessl received an MSc degree in Computer Science in Telematik and a PhD in Informatics from the Graz University of Technology (TUG), Austria. Angela works as a senior researcher at the Know-Center and TUG. Her research focuses on educational technologies, digital transformation, and socio-technical design.
Simone Franza
Simone Franza is a master’s student in Graz, Austria, and he recently received a BSc (with distinction) degree in Computer Science from the Graz University of Technology. He is completing a master’s in Computer Science focusing on Cybersecurity and Software Technologies.
Joachim Kimmerle
Joachim Kimmerle works as a researcher at the Leibniz-Institut für Wissensmedien. He is also an Adjunct Professor at the University of Tübingen (Department of Psychology). In his research, he investigates cognitive, motivational, emotional, and social aspects of collective knowledge construction, science communication, and computer-supported collaborative learning.
Viktoria Pammer-Schindler
Viktoria Pammer-Schindler is an associate professor in human–com- puter interaction and educational technology at the Graz University of Technology, Austria. Viktoria has served as president of the International Alliance to Advance Learning in the Digital Era, as a subcommittee chair at ACM CHI, and in various other academic community roles.
Notes
1 All students of the course could reach all points when fulfilling mandatory assignments and the exam. Participation in this study offered students the opportunity to gain additional points. We clearly stated that students who did not participate in the study had no disadvantages in passing the exam.
2 Participants were recruited through a university course in which only students can participate, but not all of them indicated their field of study. Hence the percentages do not add up to 100%.
References
- Aleven, V., McLaughlin, E. A., Glenn, R. A., & Koedinger, K. R. (2016). Instruction based on adaptive learning technologies. In R. E. Mayer & P. Alexander (Eds.), Handbook of research on learning and instruction (2nd ed., pp. 522–560). Routledge.
- Allen, M. J., & Yen, W. M. (2002). Introduction to measurement theory (reissued ed.). Waveland Press.
- American Psychological Association (2018, April). APA dictionary of psychology. Retrieved September 6, 2023, from https://dictionary.apa.org/
- Austin, P. C., & Brunner, L. J. (2003, May) Type I error inflation in the presence of a ceiling effect. The American Statistician, 57(2), 97–104. https://doi.org/10.1198/0003130031450
- Brysbaert, M. (2019). How many words do we read per minute? A review and meta-analysis of reading rate. Journal of Memory and Language, 109, 104047. https://doi.org/10.1016/j.jml.2019.104047
- Burton-Jones, A., & Meso, P. (2008). The effects of decomposition quality and multiple forms of information on novices’ understanding of a domain from a conceptual model. Journal of the Association for Information Systems, 9(12), 748–802. https://doi.org/10.17705/1jais.00179
- Cambridge University Press & Assessment (2017a, October). The Cambridge English Scale. Retrieved from https://www.cambridgeenglish.org/exams-and-tests/cambridge-english-scale/
- Cambridge University Press & Assessment (2017b, January). General English – Test your English. Retrieved from https://www.cambridgeenglish.org/test-your-english/general-english/
- Cañas, A. J., Carff, R., Hill, G., Carvalho, M., Arguedas, M., Eskridge, T. C., … Carvajal, R. (2005). Concept maps: Integrating knowledge and information visualization. In Knowledge and information visualization (pp. 205–219). Springer.
- Castle, K. (1997). Constructing knowledge of constructivism. Journal of Early Childhood Teacher Education, 18(1), 55–67. https://doi.org/10.1080/10901029708549137
- Chan, J. C., & McDermott, K. B. (2007). The testing effect in recognition memory: A dual process account. Journal of Experimental Psychology. Learning, Memory, and Cognition, 33(2), 431–437. https://doi.org/10.1037/0278-7393.33.2.431
- Chang, K.-E., Sung, Y.-T., & Chen, S.-F. (2001). Learning through computer-based concept mapping with scaffolding aid. Journal of Computer Assisted Learning, 17(1), 21–33. https://doi.org/10.1111/j.1365-2729.2001.00156.x
- Chang, S.-F., Smith, J. R., Beigi, M., & Benitez, A. (1997). Visual information retrieval from large distributed online repositories. Communications of the ACM, 40(12), 63–71. https://doi.org/10.1145/265563.265573
- Chen, C. (2013). Mapping scientific frontiers: The quest for knowledge visualization. Springer Science & Business Media.
- Chevalier, F., Dragicevic, P., Bezerianos, A., & Fekete, J.-D. (2010). Using text animated transitions to support navigation in document histories. In Proceedings of the SIGCHI Conference on Human Factors in Computing Systems (pp. 683–692). Association for Computing Machinery. https://doi.org/10.1145/1753326.1753427
- Collins, B., & Nyenhuis, R. (2021). The effectiveness of concept maps for students’ learning and retention. Journal of Political Science Education, 17(sup1), 897–909. https://doi.org/10.1080/15512169.2020.1775090
- Council of Europe, Council for Cultural Co-operation, Education Committee, Modern Languages Division (2001). Common European framework of reference for languages: Learning, teaching, assessment. Cambridge University Press.
- Cress, U., & Kimmerle, J. (2008). A systemic and cognitive view on collaborative knowledge building with wikis. International Journal of Computer-Supported Collaborative Learning, 3(2), 105–122. https://doi.org/10.1007/s11412-007-9035-z
- D’Mello, S., & Graesser, A. (2013). Autotutor and affective autotutor: Learning by talking with cognitively and emotionally intelligent computers that talk back. ACM Transactions on Interactive Intelligent Systems, 2(4), 1–39. https://doi.org/10.1145/2395123.2395128
- Disch, L., Fessl, A., & Pammer-Schindler, V. (2022). Designing for knowledge construction to facilitate the uptake of open science: Laying out the design space. In Proceedings of the 2022 CHI Conference on Human Factors in Computing Systems (pp. 1–16). https://doi.org/10.1145/3491102.3517450
- Dole, J. A., & Sinatra, G. M. (1998). Reconceptalizing change in the cognitive construction of knowledge. Educational Psychologist, 33(2–3), 109–128. https://doi.org/10.1207/s15326985ep3302&3_5
- Edmondson, K. M. (2005). Chapter 2 – Assessing science understanding through concept maps. In J. J. Mintzes, J. H. Wandersee, & J. D. Novak (Eds.), Assessing science understanding (pp. 15–40). Academic Press.
- Eerland, A., Guadalupe, T. M., & Zwaan, R. A. (2011). Leaning to the left makes the Eiffel tower seem smaller: Posture-modulated estimation. Psychological Science, 22(12), 1511–1514. https://doi.org/10.1177/0956797611420731
- Eppler, M. J. (2006). A comparison between concept maps, mind maps, conceptual diagrams, and visual metaphors as complementary tools for knowledge construction and sharing. Information Visualization, 5(3), 202–210. https://doi.org/10.1057/palgrave.ivs.9500131
- Falke, T. (2019). Automatic structured text summarization with concept maps.
- Faul, F., Erdfelder, E., Buchner, A., & Lang, A.-G. (2009). Statistical power analyses using g* power 3.1: Tests for correlation and regression analyses. Behavior Research Methods, 41(4), 1149–1160. https://doi.org/10.3758/BRM.41.4.1149
- Faul, F., Erdfelder, E., Lang, A.-G., & Buchner, A. (2007). G* power 3: A flexible statistical power analysis program for the social, behavioral, and biomedical sciences. Behavior Research Methods, 39(2), 175–191. https://doi.org/10.3758/bf03193146
- Fischer, F., Bruhn, J., Gräsel, C., & Mandl, H. (2002). Fostering collaborative knowledge construction with visualization tools. Learning and Instruction, 12(2), 213–232. https://doi.org/10.1016/S0959-4752(01)00005-6
- Fischer, G. (2001). User modeling in human–computer interaction. User Modeling and User-Adapted Interaction, 11(1/2), 65–86. https://doi.org/10.1023/A:1011145532042
- Flemming, D., Kimmerle, J., Cress, U., & Sinatra, G. M. (2020). Research is tentative, but that’s okay: Overcoming misconceptions about scientific tentativeness through refutation texts. Discourse Processes, 57(1), 17–35. https://doi.org/10.1080/0163853X.2019.1629805
- Gunawardena, C. N., Lowe, C. A., & Anderson, T. (1997). Analysis of a global online debate and the development of an interaction analysis model for examining social construction of knowledge in computer conferencing. Journal of Educational Computing Research, 17(4), 397–431. https://doi.org/10.2190/7MQV-X9UJ-C7Q3-NRAG
- Guttman, L. (1945). A basis for analyzing test-retest reliability. Psychometrika, 10(4), 255–282. https://doi.org/10.1007/BF02288892
- Hammadou, J. (1991). Interrelationships among prior knowledge, inference, and language proficiency in foreign language reading. The Modern Language Journal, 75(1), 27–38. https://doi.org/10.1111/j.1540-4781.1991.tb01080.x
- Harbarth, L., Delsing, S., Richtscheid, F., Yücepur, V., Feldmann, F., Akhavanfarm, M., Manske, S., Othlinghaus, J., & Hoppe, H. U. (2018). Learning by tagging–supporting constructive learning in video-based environments. DeLFI 2018-Die 16. E-Learning Fachtagung Informatik.
- Hicks, M. (2009). Perceptual and design principles for effective interactive visualisations. In Trends in interactive visualization (pp. 155–174). Springer.
- Hmelo-Silver, C. E. (2003). Analyzing collaborative knowledge construction: Multiple methods for integrated understanding. Computers & Education, 41(4), 397–420. https://doi.org/10.1016/j.compedu.2003.07.001
- Jankowski, J., Samp, K., Irzynska, I., Jozwowicz, M., & Decker, S. (2010). Integrating text with video and 3D graphics: The effects of text drawing styles on text readability. In Proceedings of the SIGCHI Conference on Human Factors in Computing Systems (pp. 1321–1330). Association for Computing Machinery.
- Kimmerle, J., Moskaliuk, J., Oeberst, A., & Cress, U. (2015). Learning and collective knowledge construction with social media: A process-oriented perspective. Educational Psychologist, 50(2), 120–137. https://doi.org/10.1080/00461520.2015.1036273
- Kline, P. (2013). Handbook of psychological testing. Routledge.
- Koo, T. K., & Li, M. Y. (2016). A guideline of selecting and reporting intraclass correlation coefficients for reliability research. Journal of Chiropractic Medicine, 15(2), 155–163. https://doi.org/10.1016/j.jcm.2016.02.012
- Kowata, J. H., Cury, D., Boeres, M. (2010). A review of semi-automatic approaches to build concept maps. In Proceedings of 4th International Conference on Concept Mapping(pp. 40–48).
- Liaw, S.-S., & Huang, H.-M. (2006). Information retrieval from the world wide web: A user-focused approach based on individual experience with search engines. Computers in Human Behavior, 22(3), 501–517. https://doi.org/10.1016/j.chb.2004.10.007
- Liaw, S.-S., Hatala, M., & Huang, H.-M. (2010). Investigating acceptance toward mobile learning to assist individual knowledge management: Based on activity theory approach. Computers & Education, 54(2), 446–454. https://doi.org/10.1016/j.compedu.2009.08.029
- Liu, P., Li, F., & Yang, Z. (2020). A grounded theory approach for modelling the knowledge construction process in exploratory search. In JCDL '20: The ACM/IEEE Joint Conference on Digital Libraries in 2020 (pp. 409–412). Association for Computing Machinery. https://doi.org/10.1145/3383583.3398600
- McNamara, D. S. (2007). Reading comprehension strategies: Theories, interventions, and technologies. Psychology Press.
- Medin, D. L. (1989). Concepts and conceptual structure. The American Psychologist, 44(12), 1469–1481. https://doi.org/10.1037/0003-066x.44.12.1469
- Morsi, R., Ibrahim, W., Williams, F. (2007). Concept maps: Development and validation of engineering curricula. In 2007 37th Annual Frontiers in Education Conference-Global Engineering: Knowledge without Borders, Opportunities without Passports (pp. T3H–T18).
- Nesbit, J. C., & Adesope, O. O. (2006). Learning with concept and knowledge maps: A meta-analysis. Review of Educational Research, 76(3), 413–448. https://doi.org/10.3102/00346543076003413
- Novak, J. D. (1993). Human constructivism: A unification of psychological and epistemological phenomena in meaning making. International Journal of Personal Construct Psychology, 6(2), 167–193. https://doi.org/10.1080/08936039308404338
- Novak, J. D., & Cañas, A. J. (2006). The theory underlying concept maps and how to construct them. Florida Institute for Human and Machine Cognition, 1(1), 1–31. https://cmap.ihmc.us/Publications/ResearchPapers/TheoryUnderlyingConceptMaps.pdf
- Novak, J. D., & Gowin, D. B. (1984). Learning how to learn. Cambridge University Press.
- O’Donnell, A. M., Dansereau, D. F., & Hall, R. H. (2002). Knowledge maps as scaffolds for cognitive processing. Educational Psychology Review, 14(1), 71–86. https://doi.org/10.1023/A:1013132527007
- Padilla, S., Methven, T. S., Robb, D. A., & Chantler, M. J. (2017). Understanding concept maps: A closer look at how people organise ideas. In Proceedings of the 2017 CHI Conference on Human Factors in Computing Systems (pp. 815–827). Association for Computing Machinery.
- Plavén-Sigray, P., Matheson, G. J., Schiffler, B. C., & Thompson, W. H. (2017, September). Research: The readability of scientific texts is decreasing over time. eLife, 6(1), 1–14. https://doi.org/10.7554/eLife.27725
- Presch, C. (2020). [Semi-automatic creation of concept maps] [Unpublished master’s thesis]. Research Unit of Computer Graphics, Institute of Visual Computing and Human-Centered Technology, Faculty of Informatics, TU Wien.
- Restle, F. (1970). Speed of adding and comparing numbers. Journal of Experimental Psychology, 83(2, Pt.1), 274–278. https://doi.org/10.1037/h0028573
- Revelle, W. (2023). psych: Procedures for psychological, psychometric, and personality research [Computer software manual] (R package version 2.3.6). Retrieved from https://CRAN.R-project.org/package=psych
- Rowan, K. E. (1991). When simple language fails: Presenting difficult science to the public. Journal of Technical Writing and Communication, 21(4), 369–382. https://doi.org/10.2190/D3BD-32RC-FGW0-C5JB
- Salita, J. T. (2015). Writing for lay audiences: A challenge for scientists. Medical Writing, 24(4), 183–189. https://doi.org/10.1179/2047480615Z.000000000320
- Serafini, F. (2015). Multimodal literacy: From theories to practices. Language Arts, 92(6), 412–423. http://www.jstor.org/stable/24577533
- Shams, L., & Seitz, A. R. (2008). Benefits of multisensory learning. Trends in Cognitive Sciences, 12(11), 411–417. https://doi.org/10.1016/j.tics.2008.07.006
- Stahl, G. (2000). A model of collaborative knowledge-building. In Fourth International Conference of the Learning Sciences(Vol. 10, pp. 70–77).
- Sultanum, N., Brudno, M., Wigdor, D., & Chevalier, F. (2018). More text please! Understanding and supporting the use of visualization for clinical text overview. In Proceedings of the 2018 CHI Conference on Human Factors in Computing Systems (pp. 1–13). Association for Computing Machinery.
- Sun, L., Williams, S., & Liu, K. (2004). Knowledge construction in e-learning: Designing an e-learning environment. In Enterprise information systems v (pp. 308–315). Springer.
- Suthers, D., Vatrapu, R., Medina, R., Joseph, S., & Dwyer, N. (2007). Conceptual representations enhance knowledge construction in asynchronous collaboration. In Proceedings of the 8th International Conference on Computer Supported Collaborative Learning (pp. 705–714). International Society of the Learning Sciences. https://doi.org/10.3115/1599600.1599729
- Sweller, J., Chandler, P., Tierney, P., & Cooper, M. (1990). Cognitive load as a factor in the structuring of technical material. Journal of Experimental Psychology: General, 119(2), 176–192. https://doi.org/10.1037/0096-3445.119.2.176
- Tversky, A., & Kahneman, D. (1974). Judgment under uncertainty: Heuristics and biases. Science, 185(4157), 1124–1131. https://doi.org/10.1126/science.185.4157.1124
- Uttl, B. (2005). Measurement of individual differences: Lessons from memory assessment in research and clinical practice. Psychological Science, 16(6), 460–467. https://doi.org/10.1111/j.0956-7976.2005.01557.x
- Valerio, A., Leake, D. B., & Canas, A. J. (2012). Using automatically generated concept maps for document understanding: A human subjects experiment. In 5th International Conference on Concept Mapping.
- van Aalst, J. (2009). Distinguishing knowledge-sharing, knowledge-construction, and knowledge-creation discourses. International Journal of Computer-Supported Collaborative Learning, 4(3), 259–287. https://doi.org/10.1007/s11412-009-9069-5
- Vicente-Saez, R., & Martinez-Fuentes, C. (2018). Open science now: A systematic literature review for an integrated definition. Journal of Business Research, 88, 428–436. https://doi.org/10.1016/j.jbusres.2017.12.043
- Wang, L., Zhang, Z., McArdle, J. J., & Salthouse, T. A. (2008). Investigating ceiling effects in longitudinal data analysis. Multivariate Behavioral Research, 43(3), 476–496. https://doi.org/10.1080/00273170802285941
- Webb, S. A. (2012). Receptive learning. In N. M. Seel (Ed.), Encyclopedia of the sciences of learning (pp. 2783–2785). Springer US.
- Wharton Credibility Lab-University of Pennsylvania (2015). Aspredicted. Retrieved from https://aspredicted.org/
- Yildiz, I. G. (2015). Sample scientific texts analysis through textlinguistic approach. ELT Research Journal, 4(4), 257. https://dergipark.org.tr/tr/download/article-file/296314
- Zouaq, A., & Nkambou, R. (2008). Building domain ontologies from text for educational purposes. IEEE Transactions on Learning Technologies, 1(1), 49–62. https://doi.org/10.1109/TLT.2008.12
- Zouaq, A., & Nkambou, R. (2009). Evaluating the generation of domain ontologies in the knowledge puzzle project. IEEE Transactions on Knowledge and Data Engineering, 21(11), 1559–1572. https://doi.org/10.1109/TKDE.2009.25