
Abstract
Maintaining student engagement is pivotal in the rapidly evolving landscape of online education. The factors that affect and predict students’ satisfaction during online learning are poorly understood. Our study addresses this issue by employing machine learning (ML) models to predict student emotions and satisfaction. ML focuses on small and structured data that do not require the complexity of deep neural networks. We created an ML classification model trained with data from an online survey of seven constructs. We narrowed down the critical features from 55 to 7 and 36 for satisfaction and emotion prediction, respectively, using the backward feature selection (BFS) method. The artificial neural network (ANN) and the random forest (RF) model outperformed other classifiers, showing 81% and 65.3% accuracy for satisfaction and emotion prediction, respectively. Our findings suggest that by predicting and responding to student emotions and satisfaction, we can optimize the online learning experience, providing personalized educational trajectories that align with each student’s unique needs.
1. Introduction
A global pandemic caused by the coronavirus (COVID-19) erupted in 2019, and the World Health Organization (WHO) recommends that all educational institutions transition away from traditional classroom instruction and toward web-based e-learning or online distance learning, which helps decrease virus reproduction (Zu et al., Citation2020). On a large scale, online education has fast become an attractive mode of education delivery (Elfaki et al., Citation2019). Due to the development of technology, learning is now regarded as adaptive, and educators must be computer-advanced to support their students (Ally, Citation2019). Learning technology has mitigated the pandemic, but colleges’ transition to online education is difficult. Online instructional programs are poorly planned, designed, and developed. Students and faculty may lack the digital skills needed to succeed online. Educational technology researchers must create plagiarism-free assessment methods. Despite the obstacles, online learning will become increasingly hybrid in the future (Adedoyin & Soykan, Citation2023).
The value of the learning experience contributes to student satisfaction. Students’ satisfaction with their learning experience determines the success of online education (Azizan et al., Citation2022). According to Donohue and Wong, the level of satisfaction among students can influence their motivation (Donohue & Wong, Citation1997). Artificial intelligence (AI), including ML and deep learning (DL), will massively affect education, and many studies evaluate student performance using different ML models. Lecturers can better understand learning and teaching using AI techniques, and learning systems are more flexible and easier to design to help learners learn and gain new skills and insights (du Boulay, Citation2016). Based on student learning behavior, a system for predicting student course satisfaction was prepared by Tzeng et al. (Citation2022). The studies should emphasize the importance of establishing policies and strategies to ensure that schools and universities can efficiently utilize AI technologies while adhering to a human-centered approach to online learning (Dogan et al., Citation2023).
One must assess the tools and learning materials used to use online learning effectively. The institution should understand how well the learner, educators, and content (LEC) requirements are met (Mutawa, Citation2020). The vital parameter for measuring the success of education, whether online or remote, is student satisfaction (X. Li & Asante, Citation2021). Identifying the factors affecting learning effectiveness helps the educator design the course content (Kauffman, Citation2015). A student’s emotional state also plays a vital role in measuring their education success (Altrabsheh et al., Citation2015). A comprehensive analysis demonstrates that transmitting content via online mediums is successful regarding learning outcomes and achievements. The research on whether or not online learning is helpful is inconclusive because it is heavily impacted by developing digital technology (Batdı et al., Citation2021). Wang et al. (Citation2023) study reveals that the information, system, and service quality improved user satisfaction, communication quality, loyalty intention, and learning efficacy, while the monitoring quality alone affects communication.
By evaluating linear and non-linear correlations, ML constructs models that use categorical and numeric factors (Alsariera et al., Citation2022; Bhutto et al., Citation2020; Kaddoura et al., Citation2022). The common ML models are SVM, LR, DT, RF, KNN, Naive Bayes (NB), and artificial neural network (ANN) (Alnagar, Citation2020; Dejaeger et al., Citation2012; Permana et al., Citation2017; Skrbinjek & Dermol, Citation2019). Even though most studies use a classification method, clustering was also used to categorize students’ success rates using online learning (Saputra et al., Citation2021). An SVM classification algorithm was used to classify these clusters. Some ML models are used to predict students’ learning styles, which helps understand the concept in depth (Rasheed & Wahid, Citation2021).
Ho et al. (Citation2021) implemented a model with ML regression algorithms, which shows content delivery, the effort of educators, and preference for traditional learning as significant predictors. With the help of the clustering algorithm, the student’s choice of learning method was predicted (Lu et al., Citation2020). Rincon-Flores et al. (Citation2022) studied the learning profiles of individual students with learning analytics. Their findings suggest that the accuracy of the forecasts increases as more data are added to the model, and the teaching-learning process improves with reduced academic failure.
The emotion of students also affects their learning outcomes. ML model helps personalize the course content according to their emotional states (Liu & Ardakani, Citation2022). Different ML models, like multi-label and multi-task, are used in the study conducted by Gibson et al. (Citation2022) based on human behaviors. To make the model more efficient, the feature selection method is essential. The feature selection algorithm aims to improve the model accuracy and reduce dimensionality (J. Li et al., Citation2017).
One of the most important steps in ML is called "feature selection." During this stage, a subset of pertinent features is chosen from the whole collection to feed into the model. Feature selection aims to boost the model’s performance and interpretability and to limit the risk of overfitting by picking the relevant features (Lahbib et al., Citation2023). The filter and wrapper are the two approaches to performing feature selection. Wrapper techniques include feature selection and classification model interaction, resulting in greater prediction accuracy values than filter approaches (Zhu & Song, Citation2013). Backward feature selection (BFS) is a wrapper method that starts with all features and gradually removes the least significant ones, making the final selected features easier to understand.
shows relevant studies on the satisfaction of students during online learning. Most related studies focused on student satisfaction based on a particular course, data collection from a single institution or school, and mostly on college students. AI has changed education, social interactions, and tradition. The study by Arpaci et al. (Citation2022) has evaluated individuals’ perspectives on the social sustainability of the Metaverse employing structure equation modeling with ANN. It lacks generalizability as it collects data from a particular people in a country. Different studies have employed a hybrid model with structure equation modeling and ANN (Akour et al., Citation2022; Lo et al., Citation2022).
Table 1. Related background studies for students’ satisfaction toward online learning.
Numerous studies cited in the literature have faced criticism due to their restricted applicability to broader contexts. This constraint emerges due to the reliance on data and conclusions frequently obtained from a specific place, institution, or student group. Research with limited sample numbers may not possess sufficient statistical power to identify minor effects or correlations reliably. Moreover, it should be noted that the conclusions drawn from small sample sizes may not accurately reflect the characteristics and behaviors of the broader community of individuals engaged in online learning. Moreover, it is worth noting that specific ML algorithms may exhibit superior performance in different scenarios. Technical concerns, including platform usability, internet connectivity, and resource access, can strongly impact the online learning experience. However, these factors are given little attention.
The proposed study addresses this research gap by incorporating the six Gulf Cooperation countries’ primary, secondary, high school, graduate, and undergraduate students. Also, we analyzed seven factors related to online learning that affect students’ satisfaction. Another direction of the study is based on emotional prediction during learning, which will help the instructor to understand the student’s engagement in class. The proposed study employs an ANN neural network model with four hidden layers. The study aims to predict satisfaction with online learning and the student’s emotional state of mind during the learning process using ML.
Two classification model is implemented based on students’ data collected through a questionnaire. The first is a multi-class ML model for predicting student satisfaction with online learning. Furthermore, the other is for emotional state prediction during the learning process (bored and mindfulness) and is a multi-label ML model. There are only a few studies based on the multi-label classification model. This work uses the following ML models: logistic regression (LR), decision tree (DT), extra tree (ET), support vector machines (SVMs) with radial basis function (RBF) kernel, K-nearest neighbors (KNNs), Gaussian Naïve Bayes (GNB), and random forest (RF) algorithms. We employed a feedforward neural network model with few dense layers (ANN) for the satisfaction classification task. Models such as multi-label K-nearest neighbor (MLkNN), binary relevance (BR), KNN, RF, binary relevance K-nearest neighbor (BRkNN), classifier chain (CC), and DT are applied for multi-label classification (Sorower, Citation2010). The features are selected based on the BFS method and then compared with the complete ML models.
The following are the key contributions of the study:
The study captures the complexity of Arab students’ emotions and levels of satisfaction with their online education experiences using multi-class and multi-label classification models. The students belong to primary, secondary, high school, graduate, and undergraduate.
The proposed study employs different ML and a neural network model for satisfaction and emotion classification problems.
There has been limited research on multi-label classification in online learning, a research gap. By using and comparing MLkNN, BR, BRkNN, CC, KNN, RF, DT, and ANN, the study fills in this gap and helps to improve knowledge in this area.
The BFS technique is employed in this study to choose significant factors that contribute considerably to predicting student satisfaction and emotional states during online learning. The use of BFS in this context is a novel component of the study.
The study’s findings apply to educational institutions and online learning platforms. Understanding the significant elements influencing student satisfaction and emotions enables data-driven decision-making to improve the online learning experience.
Accordingly, the main research questions (RQs) discussed in this work are:
RQ1: Which model best predicts students’ satisfaction and emotional states in online learning?
RQ2: What key features contribute to student satisfaction and emotion prediction in online learning?
The remainder of the article is organized as follows: the materials and methods are specified in Section 2, which describes the ML models and evaluation matrices, followed by the result and discussion in Sections 3 and 4, respectively. Finally, the significance of the work is concluded in the last section.
2. Materials and methods
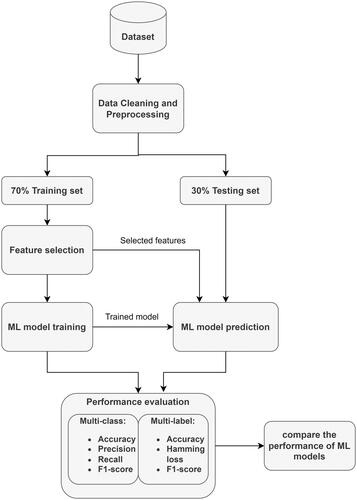
The methodology of the work is described in . Collecting the student’s data based on the questionnaire is the primary stage, followed by data preprocessing. It transforms the collected data into a standard scale suitable for the ML models to work. The data set is split into training and testing with a ratio of 70:30, where 30% is set as unseen data. The BFS method is applied to 70% of the training data to select the best-suited features for the ML models. Different multi-class and multi-label ML models are selected to predict students’ satisfaction and emotion, respectively. Each of these ML model’s parameters is chosen based on hyperparameter tuning with the help of the GridSearch method. The training data are split up into fivefold for performing fivefold cross-validation. First, the model is trained on four different folds and then evaluated on the remaining fold. This procedure is repeated five times until all folds are categorized as test folds. The model’s average performance is chosen and saved for testing the new unseen data. It ensures that the model is not overfitting the training data. The detailed information of each stage is explained in the following sub-sections.
Figure 1. Methodology of the study.
2.1. Dataset description
An online questionnaire survey is being disseminated to schools and colleges in the Gulf Cooperation Council (GCC) countries by the Secretariat of the E-learning Officials Committee at Arab Gulf Cooperation Universities and Higher Education Institutions. The survey collects demographic information such as gender, grade, nationality, institution, computer familiarity, and categorical characteristics such as learning method, vaccination details, coronavirus concerns, behavioral changes, and learning equipment. Additionally, there are multiple-choice questions and Likert scale questions in the questionnaire. The data were collected between June and December 2021 via online forums, with 18,007 impression clicks and 9194 completed surveys submitted by students from various schools, colleges, and universities throughout the GCC six countries. These countries are the Kingdom of Bahrain, the Kingdom of Saudi Arabia, the Sultanate of Oman, the United Arab Emirates, Kuwait, and Qatar. The topic of the study was likely the primary factor that had a role in the choice to include individuals from the GCC nations in the survey.
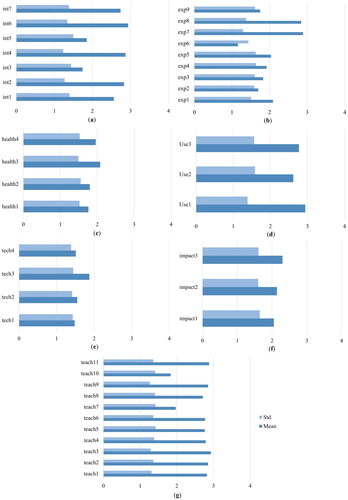
The survey included seven constructs: interaction, usefulness, technical, teaching style, online learning experience, the impact of learning, and health concepts. The survey ended with a question on satisfaction and the emotional states experienced by online learning. After cleaning the data, the total count was 9128. describes the constructs and associated questions. The concern of students toward covid-19 (concern_covid) is also asked during the survey. All the Likert-scale questions and the concern_covid are from zero to four (strongly disagree to agree strongly). Cronbach’s alpha value is analyzed for the internal consistency between the constructs. The alpha value ranges from 0 to 1, where the closest to 1 denotes more reliability. The rule is that the reliability is acceptable if the value is greater than or equal to 0.7 (George & Mallery, Citation2021). All values in are higher than 0.7, which indicates that the survey questions are reliable. The mean and standard deviation (SD) of all seven constructs are depicted in .
Figure 2. The constructs used in this study. (a) Interaction, (b) experience, (c) health, (d) usefulness, (e) technical, (f) impact, and (g) teaching style.
2.2. Feature selection
The feature selection method, BFS, is a wrapper method (Mehmood et al., Citation2022). There is a possibility that ML models cannot make accurate predictions from the dataset due to the high dimensionality of features. The BFS algorithm commences by initializing a model that encompasses all available features. It then proceeds to iteratively eliminate the features deemed to have the least significance, as determined by a predefined threshold, namely a p value greater than 0.05 (Aggrawal & Pal, Citation2021). The consideration of the influence of each feature in the presence of others is crucial, particularly in cases when features exhibit interactions or dependencies. BFS has the potential to offer computational efficiency over forward selection by initially employing a comprehensive model and subsequently removing features. This advantage becomes especially significant when presented with an adequate number of features.
Calculating the p value for the BFS method was done using ordinal LR, and the significant value was set as 0.05 (Warner, Citation2008). According to the null hypothesis, the other variables selected will not affect the target variable, which is accepted when the p value is higher than 0.05. The features are eliminated when p value > 0.05. The chosen feature p value is mentioned in (satisfaction model), and (emotion model).
2.3. Classification models
The data were cleaned (removing any empty data, in case) and pre-processed using Python and Scikit-learn ML software (Pedregosa et al., Citation2011). In a ratio of 70:30, the whole dataset is divided into training and testing. Seventy percent of the data is cross-validated five times, and 30% is set for external validation based on unseen data. The multi-class models used to predict online learning satisfaction are DT, KNN, SVM, RF, ET, LR, GNB, and ANN. These classification models were chosen because they are widely accepted. The final target class is the satisfaction variable, which ranges from 0 to 4. The best parameter was estimated using the grid search method. With the best estimator, the data were trained and validated with the stratified fivefold method. The remaining 30% of the data are tested with the best parameter obtained from each model. Precision, recall, F1-score, and accuracy matrices are evaluated for multi-class models (Hossin & Sulaiman, Citation2015).
All the models used here are supervised classification algorithms. DT is a tree-based algorithm, including root, internal, and leaf nodes (Pallathadka et al., Citation2023; Skrbinjek & Dermol, Citation2019). The KNN algorithm performs the learning based on KNNs. The value of k is obtained by tuning the parameter (Liu & Ardakani, Citation2022). The RF and ET are ensemble classifiers that fit many DTs, each constructed from sub-samples (Iqbal & Varshney, Citation2022; Raj & Renumol Renumol, Citation2022). LR is a linear classification model. SVM handles high-dimensional data and finds a hyperplane that fits the data into distinct boundaries (Abdelkader et al., Citation2022; Bhutto et al., Citation2020; Dejaeger et al., Citation2012). Each feature is assigned the same attention in the Naïve Bayes algorithm (Kamel et al., Citation2019; H. Zhang, Citation2004). These models are commonly used for classification that accepts discrete and continuous variables (Alhothali et al., Citation2022; Alsariera et al., Citation2022; Ha et al., Citation2020).
Over the years, DL has garnered extensive research. Several neural network architectures have been created for different data types. Recurrent neural networks such as long short-term memory (LSTM) and bidirectional LSTM (BiLSTM) are utilized mainly for text and speech data, while convolutional neural networks are employed for image processing. One variety of ANNs is known as a feedforward neural network. In this kind of network, the connections between the nodes do not create a loop. Feedforward neural networks get their name because information can only move in one direction, forward, inside the network, referred to as multi-layered networks (Kurani et al., Citation2023; Zupan, Citation1994).
The emotions used in this study are boring and mindfulness. The study used only two emotions, mindfulness and boredom, to simplify and control factors. Students may find choosing between two emotions easier, decreasing data ambiguity. We believe these two emotional states encapsulate vital dimensions of the online learning experience, providing valuable insights into online education’s potential pitfalls and positive aspects. They act as proxies for broader issues related to student satisfaction, engagement, and overall educational quality online. Altrabsheh et al. (Citation2015) found that single-emotion models outperformed multi-emotion models concerning accuracy.
Multi-label classification generally consists of two approaches: problem transformation and adaptive algorithms. The first method converts multi-label data into binary classification data that can be solved with single-class algorithms. BR and CC are algorithms based on problem transformation. The adapted algorithm uses the whole label class rather than converting it to a single class. The algorithms MLkNN and BRkNN are these types of algorithms. The algorithms used in this work for multi-label emotion prediction are MLkNN (M.-L. Zhang & Zhou, Citation2007), BR (Luaces et al., Citation2012), BRkNN (Spyromitros et al., Citation2008), CC (Read et al., Citation2009), KNN, RF, and DT. The best parameter was estimated using the grid search method with a fivefold CV, and with the best estimator, the data were trained and tested with the stratified fivefold method. The Scikit-multi learn Python package is used for multi-label classification (Szymański & Kajdanowicz, Citation2019). The evaluation metrics are accuracy, F1-score, and hamming loss. Hamming loss analyses how accurately the classifier predicts each label (Wu & Zhou, Citation2017). The loss value varies between 0 and 1, and the lesser the value, the better the classifier.
Friedman statistical test was used to find the most efficient algorithm for all the ML models (Varzaneh et al., Citation2022). The rank assigned to each model helps to identify the most efficient model. The null hypothesis in the test is that there is no significant difference in the performance of the algorithms. The significant value is set as 0.05 in this study. The null hypothesis is accepted when the p value is greater than 0.05. The contribution of each predictor to the prediction is determined using SHAPley Additive Explanations (SHAP) (Lundberg & Lee, Citation2017).
3. Results
3.1. Data analysis
The survey collected 9194 responses from students studying in different colleges in GCC. We selected only GCC native students (9129 responses) and eliminated one empty cell response from this, as the students did not respond to the target labels. The final number of responses for the analysis was 9128 students. The demographic details are explained in . The highest response was from the Kingdom of Saudi Arabia (64.07%), and the least was from Qatar, where we received only one answer. Also, it can be visualized that most responses were with the synchronous online learning (SOL) method (65.99%). The asynchronous online learning (AOL) and blended online learning (BOL) methods have 8.01% and 26% responses, respectively. As per the response analysis, 93.89% of students belong to the public or governmental institutions type, and 58.5% were intermediate in computer use. Also, the table shows that 32% of students have had online learning experiences. 80.3% of the total participants were vaccinated against the coronavirus. shows the devices used by the students for online learning. Around 49% use laptops to learn during the pandemic, and fewer students opt for computers (10%).
Other than these questions, the students were asked about any behavioral changes (behavior-change) they felt during the learning. Fifty-eight percent agreed that they felt changes in their behavior during online learning. Some of the institutions provide e-libraries for learning purposes. How the students utilize the e-libraries are a concern. Nineteen percent of students mentioned that their institution does not offer e-books, while 51% used e-library resources. Thirty percent of students said that they do not use the option provided. Using the web camera properly is another concern for teachers. Fifty-eight percent of students preferred to turn off the web camera during learning. All these attributes, including the constructs, show 55 used as initial features or predictors for the ML models.
3.2. Classification model results
The BFS method selects relevant features according to the ordinal LR model, as the features contain categorical and ordinal values. The selected features for the satisfaction prediction model are Tech4, Teach11, Impact1, Impact3, Use1, Use2, and Use3. The emotion labeling model selects 36 features using the BFS method. The selected features are vaccinated, catch-covid, concern-covid, country, gender, grade, institution type, behavior change, computer experience, OL before, e-libraries, the device used, DL method, Int1, Int2, Int3, Int7, Exp3, Exp4, Exp5, Exp6, Exp9, Health1, Health2, Health3, Tech1, Tech3, Tech4, Teach2, Teach4, Teach5, Teach7, Teach8, Teach11, Impact2, and Use2.
3.2.1. Satisfaction model
The categorical features were converted into numeric values, and the data were cleaned and preprocessed before loading into the classification model. The fivefold CV was performed, and averaged the results for training and validation. The parameters of each model are explained in . The best-tuned parameters are max_depth = 6 for the DT classifier, the regularization (C) attribute = 24, and gamma = 2−2 for SVM with RBF kernel. The ensemble models RF and ET show the number of estimates, n_estimators = 310 for ET, and 400 for RF with maximum features as log2. The tolerance rate (tol) is 0.01 for LR with C = 1e01, and the GNB smoothing variable is tuned to 1e–06. The KNN has two parameters: the number of neighbors, n_neighbors = 15, and p = 1 (implies Manhattan distance).
Table 2. Tuning parameters for each model in satisfaction classification.
The ANN model is built with input, dense, dropout, and classification output dense layers. The hidden layer with four dense layers performs better than the other tuned hidden layers. Also, the learning rate is decreased every two epochs if the validation loss is stable or increasing. The total epoch is set to 50, and the EarlyStopping function is set to avoid model overfitting.
All eight ML models were trained on the dataset, showing a relatively small difference in the performance. shows the mean accuracy and SD according to the fivefold CV. It can be observed that the SD of the ANN results is comparatively larger than that of the SVM results. This discrepancy in SDs implies that the ANN results exhibit greater variability.
Figure 3. Training performance of ML models based on satisfaction classification. The error bars show the standard deviation. Training is performed by a fivefold cross-validation method.
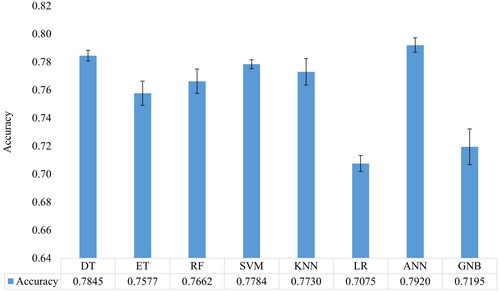
The testing is performed on the remaining unseen data. Friedman’s test results and classification of test data are shown in . The Friedman test shows a significant value of 0.0002, less than 0.05; hence, we reject the null hypothesis. So, we concluded that there is a significant difference in the performance of the algorithms. According to the Friedman rank, the best algorithm is ANN for unseen data. The model shows 81% accuracy and 0.80 F1-score and precision values.
Table 3. Classification results of satisfaction prediction with feature selection with 30% unseen data.
3.2.2. Emotion model
The multi-label classification consists of 36 features and two emotions: boredom and mindfulness. The students may feel bored or mindful, or even both, during their online learning. The data are preprocessed before loading to the model, and the parameters are tuned with preprocessed data. The tunned parameters are similar for DT, KNN, and RF, as shown in . The remaining model parameters are depicted in . The max-depth for DT is 4, the N-estimator for RF is 400 with log2 features, and KNN has N-neighbors = 10. The MLkNN and BRkNN are based on the KNN model and have N-neighbors = 19 each. The BR and CC models are based on a NB estimator, where the alpha value is tuned as 1.
Table 4. Tuning parameters for each model in emotion classification.
The training data are evaluated on a fivefold CV, and the averaged results are saved. shows each model’s mean accuracy and SD based on emotion classification. It can be observed that the SD of the RF results is comparatively larger than that of the other ML model results. This discrepancy in SDs implies that the RF is a robust and adaptable ML model capable of addressing a wide range of problems. However, it is essential to be aware of its limitations, such as its potential for variability.
Figure 4. Training performance of ML models based on emotion classification. The error bars show the standard deviation. Training is performed by a fivefold cross-validation method.
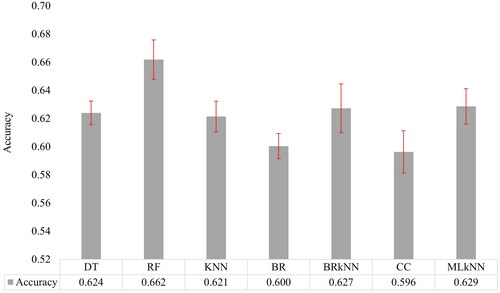
shows the result of multi-label classification with selected features on the unseen data. The Friedman test result shows a p value of 0.9196; hence, we accept the null hypothesis. So, there is no significant difference in the rank of model performance. Hence, we focused on hamming loss. The RF shows minimum hamming loss with 0.194 and has the highest accuracy and F1-score with 65.3% and 0.549, respectively.
Table 5. Classification results of emotion prediction with selected features with 30% unseen data.
4. Discussion
The result of these ML models helps instructors to motivate and engage students more effectively. Because it yields reliable results, supervised learning was the most frequently used method to forecast students’ satisfaction and emotions. ML is applied to online learning in many studies. Most studies were related to the student’s performance (Alsariera et al., Citation2022; Kaddoura et al., Citation2022). Most studies split the dataset according to the train-test split method. In this work, a fivefold CV is performed for ML analysis, and then the model is tested on unseen data. The ANN model (81% accuracy) performs better than the other classifiers evaluated for satisfaction prediction. The rank of each model is shown in . The LR and GNB models showed the least accuracy, with 72% accuracy. We also tested the LSTM and BiLSTM models with one and four hidden layers on the satisfaction prediction data. The results showed that the LSTM model has an accuracy of 65% with four hidden layers, and BiLSTM has 67% with four hidden layers. So, all other ML models outperform the LSTM and BiLSTM models for our proposed study.
Multi-label classification consists of more than one dimension in the target class. Few articles exist for multi-label prediction with imbalanced data (Tarekegn et al., Citation2021). The RF classifier outperforms all other models in emotion (bored and mindfulness) prediction with an accuracy of 65.3%. The least performed model is CC, with 58.8% accuracy. The rank of each model is shown in .
Many research articles used ANN, a machine learning (ML) and data mining method, to predict student performance better. ANN is a strong pattern recognizer and a vital method for classifying various outcomes (Baashar et al., Citation2022; Kurani et al., Citation2023). RF is an ensemble method that combines many DTs and is suitable for multi-class and multi-label classification problems. The result varies according to different datasets, features, and classifier algorithms. RF classifier performs highly in student performance prediction studies (Lu et al., Citation2020). In another emotion study article (Altrabsheh et al., Citation2015), the complement NB classifier shows high accuracy, with 67% for excitement and other emotions and 0.47 F1-score for boredom, which deals with student tweets after the lectures. In comparison, the proposed study focused on the mindset of students during online learning and obtained better performance in terms of F1-score = 0.549. Also, Altrabsheh et al. (Citation2015) found that single-emotion models outperformed multi-emotion models concerning accuracy. compares the proposed study with the related literature studies.
Table 6. Comparison of the proposed study with related literature studies.
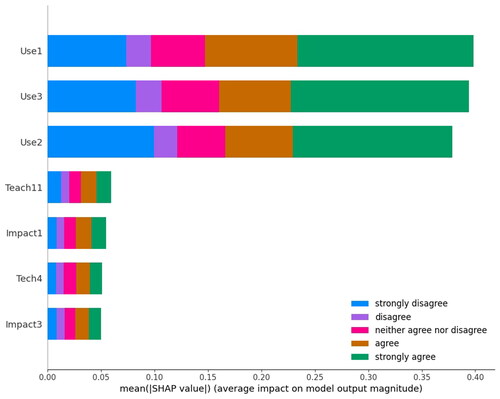
In the article (Ho et al., Citation2021), the feature importance parameter of ElasticNet regression is used to figure out the top features. The authors (Ho et al., Citation2021) mentioned that the top features were related to learning, instruction, and assessment constructs. Our study analyzes the essential predictors using the SHAP method. shows the essential predictors for students’ satisfaction with online learning prediction. From the total of 55 features, the BFS method selects seven features. The students prefer to use online learning if it is optional in the future curriculum (Use3), the existing functionalities of the online education platform match their learning needs (Use1), and Online learning is more attractive than traditional classroom learning (Use2) is the essential features. The remaining four predictors are Teach 11, Impact1 and 3, and Tech4 (as explained in ). The SHAP plot shows how each feature helps in the contribution of prediction to class 0 to class 4 (strongly disagree to agree strongly).
Figure 5. Feature contribution of the satisfaction prediction model.
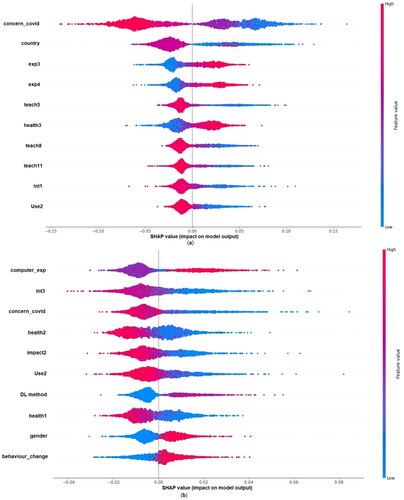
For multi-label emotion prediction, 36 features were selected based on the BFS method. The SHAP plot with the top 10 features for the multi-label prediction of emotion is shown in . The feature value is shown in red and blue, where red indicates a high feature value, and blue indicates a low feature value. Based on this, we can conclude how the features contribute to each target prediction. The positive side of the SHAP value shows a positive prediction of boredom or mindfulness. The top features contributing to emotional boredom are concern-covid, country, Exp3, Exp4, Teach5, Health3, Teacg8, Teach11, Int1, and Use2. For example, Exp3 in bored emotion ((a)) has red toward positive SHAP value. Students who agree that they face difficulty focusing on the computer all the time contribute more toward boredom (since it is coded as 0–4 from strongly disagree to agree strongly). Similarly, the highly contributed features for mindfulness emotion are computer experience, Int3, concern-covid, Health2, Impact2, Use2, DL method, Health1, gender, and behavior change. Here, the computer experience shows an important feature. The student who is an expert in computers feels mindfulness during online learning (the feature computer experience is coded as 0 for beginner, 1 for intermediate, and 2 for expert).
Figure 6. Feature contribution of the emotion prediction model. (a) Bored and (b) mindfulness.
In our study, the prediction model aims to identify potential learning challenges and areas where certain students may require more support. Once these students are identified, the instructor can employ various strategies. It might include providing more detailed and personalized feedback to these students, outlining specific areas for improvement, and suggesting targeted resources or exercises. Additionally, instructors might consider offering more one-on-one or small group tutoring sessions, allowing for tailored instruction. Instructors can also make adjustments to their teaching methods, perhaps incorporating more visual aids or interactive activities and gamification that might resonate better with those students. Continuous monitoring of these students’ progress and regular communication with them can aid in understanding their ongoing challenges and achievements, allowing the instructor to respond dynamically as needs change. Encouraging peer collaboration and study groups can foster a supportive learning community, helping those who may feel isolated or overwhelmed. The predictive analysis serves as a tool to guide these interventions, allowing the instructor to recognize potential challenges early in the learning process and take proactive measures to support those students who may be at risk. By addressing this in our study, we hope to contribute to a more inclusive and responsive personalized educational environment where all students are given the opportunities and support they need to succeed.
One of the strengths of this study is that it uses data from GCC students from different schools and colleges to implement the ML model. The GCC region, which has not previously been investigated, covers an area of one million square miles (2.6 million square meters) and houses approximately 60 million individuals with similar cultural backgrounds (World Population by Country, Citation2023). Also, different models like RF, DT, KNN, LR, GNB, ET, ANN, and SVM were used to predict the satisfaction model. Another important model is the multi-label classification model to predict students’ emotions during learning. MLkNN, BR, BRkNN, CC, KNN, DT, and RF are used for multi-label classification. A fivefold CV is performed on each model to avoid the overfitting problem, and unseen data are utilized to evaluate the model. Additionally, the features are chosen, and the dimensionality is decreased using the BFS approach.
4.1. Implications of the study
The study’s results show several important implications for educational institutions. The predicted models will help the instructors identify the less satisfied students and provide them with the necessary resources and motivation according to their needs. The emotion model provides valuable insights into students’ emotions during learning. It will help the institutions to focus on a more supportive learning environment. The association study between emotions and satisfaction levels highlights the need to provide comprehensive assistance for students. The findings suggest that online learning satisfaction was based on the usefulness, teaching style, and impact on learning. In contrast, the student’s emotion was related mainly to interaction, teaching style, health factors, and technical issues.
The relationships between student emotions and satisfaction levels are essential for our study’s goals and help us comprehend student well-being and learning experiences. The common features that help in predicting satisfaction and emotion are related to the teaching style (Teach11), online learning more attractive than traditional learning (Use2), and lack of knowledge in using tools for online learning (Tech4). The Chi-square test is evaluated on satisfaction and emotion, which resulted in no evidence to support that mindfulness and satisfaction are related (p value = 0.33). But, a significant relation exists between boredom and satisfaction (p value < 0.001). Students are more satisfied with their online education when they are satisfied with the teaching style and when they meet their learning needs. The difficulties that are thought to be involved in obtaining academic achievement (which includes satisfying teaching style and lack of knowledge in using online tools for learning) may contribute to developing negative emotions (boredom), leading to decreased satisfaction. Institutions might consider providing different teaching styles and engagement during the lectures to enhance students’ academic and learning experiences.
4.2. Limitations and future works
Even though the study has many strengths, there are a few limitations also. Investigating students’ learning styles for individual subjects is a future work that will help the instructor select different tools based on different subjects, as some subjects might require hands-on or experimental lab work that might not fit equally with other subjects. Another future enhancement can be studying the data with different feature selection methods and combining the results. Furthermore, our study opens the door to significant future exploration in two critical areas. First, investigating students’ learning styles across individual subjects presents an opportunity to tailor education to the unique demands of various disciplines. It includes recognizing the distinct needs of practical subjects requiring hands-on experiences, theoretical subjects demanding more abstract thinking, and creative subjects fostering personal expression. The selection of appropriate tools and methodologies for each subject can enhance the overall learning experience. Second, enhancing our data analysis through different feature selection methods offers exciting possibilities. Employing various statistical, ML, or hybrid approaches in feature selection may lead to a more nuanced understanding of the data. These two intertwined avenues of investigation hold the potential to significantly enrich both educational methodology and analytical precision, paving the way for more personalized and effective learning experiences.
5. Conclusions
Online education is one of the most significant components of modern learning, and it is likely to continue growing in the coming decades of education as well. In this study, we aimed to determine how satisfied students were with online learning. To do this, we used two ML classification models to identify their emotions and levels of satisfaction. Rather than diving into the nuances of specific subjects, we aimed to understand broader trends and attitudes, creating a more generalized understanding applicable across various educational contexts. These models provide valuable insights for institutions and instructors, enabling targeted guidance and support based on students’ emotions and satisfaction levels. Our exploration into different feature selection methods also offers opportunities to enhance the analytical robustness of our findings. By prioritizing a holistic view of online learning, our research contributes to human–computer interaction, highlighting the complex interplay between technology and human emotions. Our results show how important it is for online learning to be personalized and adaptable. They also pave the way for future research that could go deeper into subject-specific analysis or other complex parts of the online education scene.
Ethics statement
The study was conducted in accordance with the Declaration of Helsinki and approved by the Committee from the Office of the Vice Dean for Academic Affairs, Research and Graduate Studies, College of Engineering and Petroleum of Kuwait University (protocol code 24/2/533).
Consent form
Informed consent was obtained from all subjects involved in the study.
Disclosure statement
No potential conflict of interest was reported by the author(s).
Data availability statement
The data are not publicly available due to privacy reasons.
Correction Statement
This article was originally published with errors, which have now been corrected in the online version. Please see Correction (http://dx.doi.org/10.1080/10447318.2024.2326715)
Additional information
Notes on contributors
A. M. Mutawa
A. M. Mutawa received his PhD from Syracuse University, New York, USA, in 1999 in Artificial Intelligence and joined the Computer Engineering Department at Kuwait University (1999–present). He specializes in Artificial intelligence, and his research interests are Robotics, Expert Systems, Artificial Intelligence, Signal Processing, Pattern Recognition, Deep Learning, and e-Learning.
Sai Sruthi
Sai Sruthi received her MTech from SRM University in 2015 and her BTech from Calicut University, India, in 2012. She is currently a research assistant at the Computer Engineering Department at Kuwait University (2020–present). Her research interest includes E-Learning, Machine learning, Deep learning, and Natural language processing.
References
- Abdelkader, H. E., Gad, A. G., Abohany, A. A., & Sorour, S. E. (2022). An efficient data mining technique for assessing satisfaction level with online learning for higher education students during the COVID-19. IEEE Access, 10, 6286–6303. https://doi.org/10.1109/ACCESS.2022.3143035
- Adedoyin, O. B., & Soykan, E. (2023). Covid-19 pandemic and online learning: The challenges and opportunities. Interactive Learning Environments, 31(2), 863–875. https://doi.org/10.1080/10494820.2020.1813180
- Aggrawal, R., & Pal, S. (2021). Elimination and backward selection of features (P-value technique) in prediction of heart disease by using machine learning algorithms. Turkish Journal of Computer and Mathematics Education (TURCOMAT), 12(6), 2650–2665. https://doi.org/10.17762/turcomat.v12i6.5765
- Akour, I. A., Al-Maroof, R. S., Alfaisal, R., & Salloum, S. A. (2022). A conceptual framework for determining Metaverse adoption in higher institutions of gulf area: An empirical study using hybrid SEM-ANN approach. Computers and Education: Artificial Intelligence, 3, 100052. https://doi.org/10.1016/j.caeai.2022.100052
- Alenezi, A. R. (2022). Modeling the social factors affecting students’ satisfaction with online learning: A structural equation modeling approach. Education Research International, 2022, 1–13. https://doi.org/10.1155/2022/2594221
- Alhothali, A., Albsisi, M., Assalahi, H., & Aldosemani, T. (2022). Predicting student outcomes in online courses using machine learning techniques: A review. Sustainability, 14(10), 6199. https://doi.org/10.3390/su14106199
- Ally, M. (2019). Competency profile of the digital and online teacher in future education. The International Review of Research in Open and Distributed Learning, 20(2), 302–318. https://doi.org/10.19173/irrodl.v20i2.4206
- Alnagar, D. K. F. (2020). Using artificial neural network to predicted student satisfaction in e-learning. American Journal of Applied Mathematics and Statistics, 8(3), 90–95. https://doi.org/10.12691/ajams-8-3-2
- Alsariera, Y. A., Baashar, Y., Alkawsi, G., Mustafa, A., Alkahtani, A. A., & Ali, N. A. (2022). Assessment and evaluation of different machine learning algorithms for predicting student performance. Computational Intelligence and Neuroscience, 2022, 4151487. https://doi.org/10.1155/2022/4151487
- Altrabsheh, N., Cocea, M., & Fallahkhair, S. (2015). Predicting students’ emotions using machine learning techniques. In C. Conati, N. Heffernan, A. Mitrovic, M. Verdejo (Eds.), Artificial Intelligence in Education. AIED 2015. Lecture Notes in Computer Science (Vol. 9112). Springer. https://doi.org/10.1007/978-3-319-19773-9_56
- Arpaci, I., Karatas, K., Kusci, I., & Al-Emran, M. (2022). Understanding the social sustainability of the Metaverse by integrating UTAUT2 and big five personality traits: A hybrid SEM-ANN approach. Technology in Society, 71, 102120. https://doi.org/10.1016/j.techsoc.2022.102120
- Azizan, S., Lee, A., Crosling, G., Atherton, G., Arulanandam, B., Lee, C., & Rahim, R. A. (2022). Online learning and COVID-19 in higher education: The value of IT models in assessing students’ satisfaction. International Journal of Emerging Technologies in Learning (iJET), 17(3), 245–278. https://doi.org/10.3991/ijet.v17i03.24871
- Baashar, Y., Alkawsi, G., Mustafa, A., Alkahtani, A. A., Alsariera, Y. A., Ali, A. Q., Hashim, W., & Tiong, S. K. (2022). Toward predicting student’s academic performance using artificial neural networks (ANNs). Applied Sciences, 12(3), 1289. https://doi.org/10.3390/app12031289
- Batdı, V., Doğan, Y., & Talan, T. (2021). Effectiveness of online learning: A multi-complementary approach research with responses from the COVID-19 pandemic period. Interactive Learning Environments, 31(7), 4113–4146. https://doi.org/10.1080/10494820.2021.1954035
- Bhutto, E. S., Siddiqui, I. F., Arain, Q. A., & Anwar, M. (2020). Predicting students’ academic performance through supervised machine learning. In 2020 International Conference on Information Science and Communication Technology (ICISCT) (pp. 1–6). IEEE. https://doi.org/10.1109/ICISCT49550.2020.9080033
- Dejaeger, K., Goethals, F., Giangreco, A., Mola, L., & Baesens, B. (2012). Gaining insight into student satisfaction using comprehensible data mining techniques. European Journal of Operational Research, 218(2), 548–562. https://doi.org/10.1016/j.ejor.2011.11.022
- Dogan, M. E., Goru Dogan, T., & Bozkurt, A. (2023). The use of artificial intelligence (AI) in online learning and distance education processes: A systematic review of empirical studies. Applied Sciences, 13(5), 3056. https://doi.org/10.3390/app13053056
- Donohue, T. L., & Wong, E. H. (1997). Achievement motivation and college satisfaction in traditional and nontraditional students. Education, 118(2), 237–244. https://link.gale.com/apps/doc/A20479498/AONE?u=googlescholar&sid=bookmark-AONE&xid=af7cef96
- Du Boulay, B. (2016). Artificial intelligence as an effective classroom assistant. IEEE Intelligent Systems, 31(6), 76–81. https://doi.org/10.1109/MIS.2016.93
- Elfaki, N. K., Abdulraheem, I., & Abdulrahim, R. (2019). Impact of e-learning vs traditional learning on student’s performance and attitude. International Journal of Medical Research & Health Sciences, 8(10), 76–82. https://www.ijmrhs.com/medical-research/impact-of-elearning-vs-traditional-learning-on-students-performance-and-attitude.pdf
- George, D., & Mallery, P. (2021). IBM SPSS Statistics 27 step by step: A simple guide and reference (17th ed.). Routledge. https://doi.org/10.4324/9781003205333
- Gibson, J., Atkins, D. C., Creed, T. A., Imel, Z., Georgiou, P., & Narayanan, S. (2022). Multi-label multi-task deep learning for behavioral coding. IEEE Transactions on Affective Computing, 13(1), 508–518. https://doi.org/10.1109/TAFFC.2019.2952113
- Ha, D. T., Loan, P. T. T., Giap, C. N., & Huong, N. T. L. (2020). An empirical study for student academic performance prediction using machine learning techniques. International Journal of Computer Science and Information Security (IJCSIS), 18(3), 21–28. https://www.researchgate.net/publication/340351775_An_Empirical_Study_for_Student_Academic_Performance_Prediction_Using_Machine_Learning_Techniques
- Ho, I. M. K., Cheong, K. Y., & Weldon, A. (2021). Predicting student satisfaction of emergency remote learning in higher education during COVID-19 using machine learning techniques. PLOS One, 16(4), e0249423. https://doi.org/10.1371/journal.pone.0249423
- Hossin, M., & Sulaiman, M. N. (2015). A review on evaluation metrics for data classification evaluations. International Journal of Data Mining & Knowledge Management Process, 5(2), 1–11. https://doi.org/10.5121/ijdkp.2015.5201
- Iqbal, M., & Varshney, M. (2022). Developed model for analyzing perception of learner for digitize education during COVID19 using machine learning. International Journal of Mechanical Engineering, 7(4), 553–563. https://kalaharijournals.com/resources/APRIL_68.pdf
- Kaddoura, S., Popescu, D. E., & Hemanth, J. D. (2022). A systematic review on machine learning models for online learning and examination systems. PeerJ. Computer Science, 8, e986. https://doi.org/10.7717/peerj-cs.986
- Kamel, H., Abdulah, D., & Al-Tuwaijari, J. M. (2019). Cancer classification using Gaussian Naive Bayes algorithm. In 2019 International Engineering Conference (IEC) (pp. 165–170). IEEE. https://doi.org/10.1109/IEC47844.2019.8950650
- Kauffman, H. (2015). A review of predictive factors of student success in and satisfaction with online learning. Research in Learning Technology, 23. https://doi.org/10.3402/rlt.v23.26507
- Kurani, A., Doshi, P., Vakharia, A., & Shah, M. (2023). A comprehensive comparative study of artificial neural network (ANN) and support vector machines (SVM) on stock forecasting. Annals of Data Science, 10(1), 183–208. https://doi.org/10.1007/s40745-021-00344-x
- Lahbib, K., el Akkad, N., Satori, H., & Satori, K. (2023). A feature selection approach based on Archimedes’ optimization algorithm for optimal data classification. International Journal of Interactive Multimedia and Artificial Intelligence (In Press). https://doi.org/10.9781/ijimai.2023.01.005
- Li, J., Cheng, K., Wang, S., Morstatter, F., Trevino, R. P., Tang, J., & Liu, H. (2017). Feature selection: A data perspective. ACM Computing Surveys, 50(6), 1–45. https://doi.org/10.1145/3136625
- Li, X., & Asante, I. K. (2021). International students expectations from online education in Chinese universities: Student-centered approach. International Journal of Social Sciences & Educational Studies, 8(1), 113–123. https://doi.org/10.23918/ijsses.v8i1p113
- Liu, X., & Ardakani, S. P. (2022). A machine learning enabled affective E-learning system model. Education and Information Technologies, 27(7), 9913–9934. https://doi.org/10.1007/s10639-022-11010-x
- Lo, P.-S., Dwivedi, Y. K., Wei-Han Tan, G., Ooi, K.-B., Cheng-Xi Aw, E., & Metri, B. (2022). Why do consumers buy impulsively during live streaming? A deep learning-based dual-stage SEM-ANN analysis. Journal of Business Research, 147, 325–337. https://doi.org/10.1016/j.jbusres.2022.04.013
- Lu, D.-N., Le, H.-Q., & Vu, T.-H. (2020). The factors affecting acceptance of e-learning: A machine learning algorithm approach. Education Sciences, 10(10), 270. https://doi.org/10.3390/educsci10100270
- Luaces, O., Díez, J., Barranquero, J., del Coz, J. J., & Bahamonde, A. (2012). Binary relevance efficacy for multilabel classification. Progress in Artificial Intelligence, 1(4), 303–313. https://doi.org/10.1007/s13748-012-0030-x
- Lundberg, S. M., & Lee, S.-I. (2017). A unified approach to interpreting model predictions. Advances in Neural Information Processing Systems, 30, 4765–4774. https://doi.org/10.48550/arXiv.1705.07874
- Masa’deh, R., Almajali, D., Alrowwad, A., Alkhawaldeh, R., Khwaldeh, S., & Obeidat, B. (2023). Evaluation of factors affecting university students’ satisfaction with e-learning systems used during Covid-19 crisis: A field study in Jordanian higher education institutions. International Journal of Data and Network Science, 7(1), 199–214. https://doi.org/10.5267/j.ijdns.2022.11.003
- Mehmood, M., Alshammari, N., Alanazi, S. A., & Ahmad, F. (2022). Systematic framework to predict early-stage liver carcinoma using hybrid of feature selection techniques and regression techniques. Complexity, 2022, 1–11. https://doi.org/10.1155/2022/7816200
- Mutawa, A. M. (2020). Synchronous vs. asynchronous distance education during a worldwide epidemic. In 12th International Conference on Education and New Learning Technologies (pp. 7510–7515). IATED. https://doi.org/10.21125/edulearn.2020.1906
- Pallathadka, H., Wenda, A., Ramirez-Asís, E., Asís-López, M., Flores-Albornoz, J., & Phasinam, K. (2023). Classification and prediction of student performance data using various machine learning algorithms. Materials Today: Proceedings, 80(3), 3782–3785. https://doi.org/10.1016/j.matpr.2021.07.382
- Pedregosa, F., Varoquaux, G., Gramfort, A., Michel, V., Thirion, B., Grisel, O., Blondel, M., Prettenhofer, P., Weiss, R., & Dubourg, V. (2011). Scikit-learn: Machine learning in Python. Journal of Machine Learning Research, 12(85), 2825–2830. https://jmlr.csail.mit.edu/papers/volume12/pedregosa11a/pedregosa11a.pdf
- Permana, F. C., Rosmansyah, Y., & Abdullah, A. S. (2017). Naive Bayes as opinion classifier to evaluate students satisfaction based on student sentiment in Twitter Social Media. Journal of Physics: Conference Series, 893(1), 012051. https://doi.org/10.1088/1742-6596/893/1/012051
- Raj, N. S., & Renumol Renumol, V. G. (2022). Early prediction of student engagement in virtual learning environments using machine learning techniques. E-Learning and Digital Media, 19(6), 537–554. https://doi.org/10.1177/20427530221108027
- Rasheed, F., & Wahid, A. (2021). Learning style detection in E-learning systems using machine learning techniques. Expert Systems with Applications, 174, 114774. https://doi.org/10.1016/j.eswa.2021.114774
- Read, J., Pfahringer, B., Holmes, G., & Frank, E. (2009). Classifier chains for multi-label classification. In W. Buntine, M. Grobelnik, D. Mladenić, J. Shawe-Taylor (Eds.), Machine Learning and Knowledge Discovery in Databases. ECML PKDD 2009. Lecture Notes in Computer Science (Vol. 5782). Springer. https://doi.org/10.1007/978-3-642-04174-7_17
- Rezapour, M., & Elmshaeuser, S. K. (2022). Artificial intelligence-based analytics for impacts of COVID-19 and online learning on college students’ mental health. arXiv preprint arXiv:2202.07441.
- Rincon-Flores, E. G., Lopez-Camacho, E., Mena, J., & Olmos, O. (2022). Teaching through learning analytics: Predicting student learning profiles in a physics course at a higher education institution. International Journal of Interactive Multimedia and Artificial Intelligence, 7(7), 82. https://doi.org/10.9781/ijimai.2022.01.005
- Saputra, E. P., Sugiono, I., & Supriatiningsih, H. N. (2021). Grouping of success levels in E-learning learning factors: Approaches with machine learning algorithm. Jurnal Mantik, 5(1), 78–85. https://iocscience.org/ejournal/index.php/mantik
- Skrbinjek, V., & Dermol, V. (2019). Predicting students’ satisfaction using a decision tree. Tertiary Education and Management, 25(2), 101–113. https://doi.org/10.1007/s11233-018-09018-5
- Sorower, M. S. (2010). A literature survey on algorithms for multi-label learning. Oregon State University, Corvallis, 18(1), 25. https://www.researchgate.net/publication/266888594_A_Literature_Survey_on_Algorithms_for_Multi-label_Learning
- Spyromitros, E., Tsoumakas, G., & Vlahavas, I. (2008). An empirical study of lazy multilabel classification algorithms. Artificial Intelligence: Theories, Models and Applications, 5138, 401–406. https://doi.org/10.1007/978-3-540-87881-0_40
- Szymański, P., & Kajdanowicz, T. (2019). Scikit-multilearn: A scikit-based Python environment for performing multi-label classification. The Journal of Machine Learning Research, 20(6), 1–22. https://jmlr.csail.mit.edu/papers/volume20/17-100/17-100.pdf
- Tarekegn, A. N., Giacobini, M., & Michalak, K. (2021). A review of methods for imbalanced multi-label classification. Pattern Recognition, 118, 107965. https://doi.org/10.1016/j.patcog.2021.107965
- Tran, Q. H., & Nguyen, T. M. (2021). Determinants in student satisfaction with online learning: A survey study of second-year students at private universities in HCMC. International Journal of TESOL & Education, 2(1), 63–80. https://doi.org/10.54855/ijte22215
- Tzeng, J.-W., Lee, C.-A., Huang, N.-F., Huang, H.-H., & Lai, C.-F. (2022). MOOC evaluation system based on deep learning. The International Review of Research in Open and Distributed Learning, 23(1), 21–40. https://doi.org/10.19173/irrodl.v22i4.5417
- Varzaneh, Z. A., Orooji, A., Erfannia, L., & Shanbehzadeh, M. (2022). A new COVID-19 intubation prediction strategy using an intelligent feature selection and K-NN method. Informatics in Medicine Unlocked, 28, 100825. https://doi.org/10.1016/j.imu.2021.100825
- Wang, Y.-M., Wei, C.-L., Chen, W.-J., & Wang, Y.-S. (2023). Revisiting the E-learning systems success model in the post-COVID-19 age: The role of monitoring quality. International Journal of Human–Computer Interaction, 1–16. https://doi.org/10.1080/10447318.2023.2231278
- Warner, P. (2008). Ordinal logistic regression. The Journal of Family Planning and Reproductive Health Care, 34(3), 169–170. https://doi.org/10.1783/147118908784734945
- World Population by Country. (2023). https://worldpopulationreview.com/
- Wu, X.-Z., Zhou, Z.-H. (2017). A unified view of multi-label performance measures. In Proceedings of the 34th International Conference on Machine Learning (pp. 3780–3788). JMLR.org.
- Zapata-Cuervo, N., Montes-Guerra, M. I., Shin, H. H., Jeong, M., & Cho, M.-H. (2021). Students’ psychological perceptions toward online learning engagement and outcomes during the COVID-19 pandemic: A comparative analysis of students in three different countries. Journal of Hospitality & Tourism Education, 35(2), 108–122. https://doi.org/10.1080/10963758.2021.1907195
- Zhang, H. (2004). The optimality of naive Bayes. In Proceedings of the Seventeenth International Florida Artificial Intelligence Research Society Conference (FLAIRS 2004) (p. 2). The AAAI Press.
- Zhang, M.-L., & Zhou, Z.-H. (2007). ML-KNN: A lazy learning approach to multi-label learning. Pattern Recognition, 40(7), 2038–2048. https://doi.org/10.1016/j.patcog.2006.12.019
- Zhu, M., & Song, J. (2013). An embedded backward feature selection method for MCLP classification algorithm. Procedia Computer Science, 17, 1047–1054. https://doi.org/10.1016/j.procs.2013.05.133
- Zu, Z. Y., Jiang, M. D., Xu, P. P., Chen, W., Ni, Q. Q., Lu, G. M., & Zhang, L. J. (2020). Coronavirus disease 2019 (COVID-19): A perspective from China. Radiology, 296(2), E15–E25. https://doi.org/10.1148/radiol.2020200490
- Zupan, J. (1994). Introduction to artificial neural network (ANN) methods: What they are and how to use them. Acta Chimica Slovenica, 41(3), 327–352. https://www2.chemie.uni-erlangen.de/publications/ANN-book/publications/ACS-41-94.pdf
Appendix A
Table A1. The constructs and related questions of the study.
Table A2. Internal reliability of the constructs.
Table A3. The selected features p value during the BFS method for satisfaction model.
Table A4. The selected features p value during the BFS method for emotion model.
Appendix B
Figure B1. The number of devices used by students for online learning.
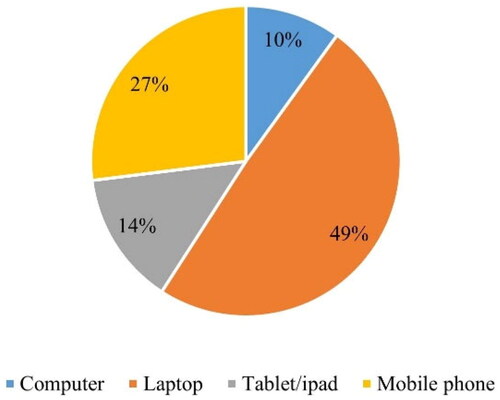
Table B1. Demographic and other details of students.