
ABSTRACT
Fish is increasingly produced in recirculating aquaculture systems (RAS), which can offer some production and environmental benefits. Unfortunately, there is a tendency to develop off-flavors in RAS, mainly caused by geosmin (GSM) and 2-methyl isoborneol (MIB) accumulating in the fish flesh from the circulating water. These off-flavors are objectionable to consumers, reducing the profitability of production and causing an unwanted reputation for this fish production sector. In this study, combinations of oxidative chemicals: ozone (O3), hydrogen peroxide (H2O2), and peracetic acid (PAA) were applied in a commercial, full-scale (1.3 M kg a−1) RAS rearing rainbow trout (Oncorhynchus mykiss). Inlet water from a nearby lake, circulating water, and depuration water were treated to increase their quality and enhance the depuration procedure. The results showed a decrease of 77% (MIB) and 93% (GSM) in the concentrations of off-flavors in circulating water after the treatments with oxidative chemicals.
Introduction
In the Nordic countries, aquaculture production is more than 1 million metric tons, including recirculating aquaculture systems (RAS)s (Dalsgaard et al. Citation2013). In Finland, fish production was 14.3 thousand tons in 2018, including approximately 0.6 thousand tons in RAS (Natural Resources Institute Finland 86/Citation2019). Atlantic salmon and rainbow trout are the most produced species in the Nordic countries, while in Finland up to 92% of the produced fish is rainbow trout. Land-based, intensive RAS enables the optimization of fish growth and a reduction in water consumption and nutrient discharge (Dalsgaard et al. Citation2013; Davidson et al. Citation2014). Unfortunately, the tendency for the development of off-flavor compounds in the circulating water and in the flesh of fish is a drawback that negatively affects consumer acceptance, causing financial losses and an unwanted reputation for the industry (Smith, Boyer, and Zimba Citation2008).
Certain off-flavors in fish have a musty, muddy, and earthy flavor, caused by the semi-volatile lipophilic compounds geosmin (GSM, trans-1,10-dimethyl-trans-9-decalol) and 2-methyl isoborneol (MIB (1-R-exo)-1,2,7,7-tetramethyl-bicyclo[2.2.1]heptan-2-ol) (Auffret et al. Citation2011; Gerber Citation1968, Citation1969), leaving an unpleasant taste and odor (Howgate Citation2004; Tucker Citation2000). They are considered as the main compounds causing off-flavors in fish flesh, but a large number of other unwanted off-flavor-inducing compounds have also been identified in fish flesh and skin (Mahmoud and Buettner Citation2017). GSM and MIB have very low human detection limits, typically 0.7 ng g−1 for MIB and 0.9 ng g−1 for GSM in rainbow trout Oncorhynchus mykiss (Jones, Fuller, and Carton Citation2013; Robertson et al. Citation2005), but even lower detection limits (0.25 ng g−1 GSM in rainbow trout) have been reported (Petersen et al. Citation2011).
GSM and MIB are produced by terpene synthases as secondary metabolites of a wide variety of microorganisms, such as actinomycetes, cyanobacteria, proteobacteria, and fungi (Dickschat et al. Citation2005; Ludwig et al. Citation2007). In a RAS, a biofilter is often the main reservoir of microbes (Lindholm-Lehto et al. Citation2019a; Rurangwa and Verdegem Citation2015), but GSM- and MIB-producing bacteria have been found to also colonize other RAS sections (Auffret et al. Citation2013; Guttman and van Rijn Citation2008; Schrader and Summerfelt Citation2010). In particular, Streptomyces, actinomycetes, and myxobacteria are considered to be responsible for GSM and MIB production in RAS (Dickschat et al. Citation2005; Guttman and van Rijn Citation2008; Schrader and Summerfelt Citation2010). In our previous study, Streptomyces was identified as the major GSM producer (Lindholm-Lehto et al. Citation2019a).
Hydrogen peroxide (H2O2) is an effective oxidizing compound that is easily degradable without any harmful by-products (Schmidt, Gaikowski, and Gingerich Citation2006). It is even referred to as complying with the principles of green chemistry. It has been used to disinfect, prevent and diminish parasite infections or bacterial diseases in fish (Madsen, Buchmann, and Mellergård Citation2000; Schreier, Rach, and Howe Citation1996). H2O2 can oxidize slowly degradable organic matter, including humic matter and biofilms, to more degradable compounds (Neyens et al. Citation2002). It decomposes into water and oxygen, following first-order kinetics (Pedersen, Pedersen, and Sortkjær Citation2006). Decomposition of H2O2 depends, for example, on light intensity, organic matter, temperature, and catalyzing metals (Saez and Bowser Citation2001). H2O2 has rarely been used as the only component to remove the off-flavor compounds in RAS, but more typically as a component in advanced oxidation processes (AOP)s, such as H2O2/UV (Klausen and Grønborg Citation2010) or H2O2/O3 (Rosenfeldt et al. Citation2006).
Ozonation is a typical procedure to remove off-flavors in drinking water production. Ozone (O3) can oxidize GSM and MIB by forming hydroxyl radicals (OH•) via the interaction with hydroxide ions (OH−). Similarly, H2O2 can oxidize GSM and MIB via formation of OH• and OH− via the Fenton reaction. Several factors, such as dosage, temperature, organic matter content in water, and pH (Westerhoff, Nalinakumari, and Pei Citation2006), can affect the reaction efficiency. GSM is known to oxidize more quickly than MIB, possibly due to greater steric hindrance in the chemical structure of MIB (Ho et al. Citation2004).
Ozone has been applied to RAS at low doses to break down refractory organic molecules (Summerfelt et al. Citation2009). It can disinfect, reduce turbidity and water color, and control nitrogen species (Park et al. Citation2013). Additionally, ozone can be used to treat incoming water, effluent water, or for controlling the circulating water (Powell and Scolding Citation2016). However, with continuous ozone addition at 248 mV, Schrader et al. (Citation2010) reached no significant reduction of off-flavors and suspected a need for higher dosage. This would require sufficient UV irradiation, sufficient delay, or use of activated carbon to prevent residual ozone from causing harmful effects on the raised species.
Peracetic acid (PAA, CH3CO3H), is an efficient disinfecting agent used in aquaculture and wastewater treatment plants (Koivunen and Heinonen-Tanski Citation2005). Pure PAA has a stronger antimicrobial effect than hydrogen peroxide (Alasri et al. Citation1992), but hydrogen peroxide is an additional source of hydroxyl radicals, and the combination of both has synergetic effects (Flores et al. Citation2014). Unlike many other antimicrobial disinfectants, PAA is degraded mainly by chemical oxidation into harmless acetic acid and water, without toxic or harmful by-products (Monarca et al. Citation2002; Pedersen et al. Citation2009). Large doses of PAA (2.8–9.3 mg PAA L−1) are known to induce lethal effects on fish (Straus et al. Citation2018). Additionally, a commercial PAA solution typically contains a part (20–25%) of H2O2, which can also be lethal to fish at large doses (>1 mL H2O2 L−1, Rach et al. Citation1997). Use of disinfectants in RAS includes the risk of impairing nitrifying communities, which can lead to inefficient ammonium and nitrite removal (Pedersen et al. Citation2009), but there is no evidence that PAA impairs nitrification in the biofilters at low dosages (<1 mg L−1). Unfortunately, PAA has not been shown to selectively reduce GSM- and MIB-producing microorganisms or fully remove off-flavors (Lindholm-Lehto et al. Citation2019a), and it can act as a carbon source for microbes, including those producing off-flavors (Suurnäkki et al. Citation2020).
A variety of combination treatments, such as O3/H2O2, O3/UV, and UV/H2O2, referred to as advanced oxidation processes (AOP)s (Klausen and Grønborg Citation2010; Rosenfeldt, Melcher, and Linden Citation2005; Rurangwa and Verdegem Citation2015), has been studied and applied to oxidize off-flavor compounds. The effect of AOPs is based mainly on the generation of highly reactive hydroxyl radical species. A combination of ozone and H2O2 has successfully been used to remove GSM and MIB from drinking water (Rurangwa and Verdegem Citation2015), but thus far, they have not been extensively used in RAS. A combined use of oxidants in an AOP can lead to increased oxidation efficiency compared to the sum of each compound alone (Azbar, Yonar, and Kestioglu Citation2004). Generally, AOPs have rarely been studied in RAS and to the best of our knowledge, not in a commercial large-scale RAS. We therefore decided to test the effect of the three selected oxidants (H2O2, O3, and PAA) together and hypothesized that the combination would result in a more significant decrease in concentrations of off-flavors than any of them alone. Moreover, depuration in clean water remains the only efficient method of removing the off-flavors. This can be costly, because a large amount of tank space and clean water is required, leading to reduced fish size, because the fish are not fed during the depuration period. Even a decrease in depuration time can therefore increase the cost-effectiveness of fish production.
Most studies of removing or decreasing off-flavor-related issues have been conducted in small-scale or pilot-scale systems (Lindholm-Lehto et al. Citation2019a; Schrader et al. Citation2010). For example, Schrader et al. (Citation2010) studied the effect of ozonation on off-flavors in water and the flesh of rainbow trout, but the study was performed in a small experimental setup. However, Pedersen and Pedersen (Citation2012) studied the effect of H2O2 addition in a full-scale RAS, but they did not study off-flavors. Lukassen et al. (Citation2019) studied microbial dynamics in a full-scale saltwater RAS with ozone addition, while Podduturi et al. (Citation2020) studied off-flavors in a commercial RAS rearing pikeperch (Stizostedion lucioperca), but they did not use oxidants. This experiment was performed in a full-scale commercial facility, and the experimental setup was therefore of a problem-solving type instead of featuring accurately planned setups for small-scale experiments. A large production scale with big financial investments and high expectations rarely allows process-related trials. However, experiments performed in commercial systems can give more insight into the off-flavor-related challenges faced in real commercial facilities, which is the aim of this study. Additionally, concentrations of GSM and MIB in different parts of the process after the varying treatment combinations can provide beneficial information for the optimization of the full-scale processes and reduce the need for depuration.
Materials and methods
Experimental setup
The RAS facility has a design production volume of 1.3 million kg of rainbow trout per year. The process design was based on the Danish Billund Akvakultur A.S. RAS concept. The facility has a total area of 4400 m2. Altogether, there are 17 circular bottom-drained tanks, 10 of which are 540 m3 rearing tanks with a height of 5.5 m and 12 m in diameter, and seven are 240 m3 depuration tanks. Both types are concrete. All the rearing tanks are part of one RAS with shared water treatment processes. The treated inlet water was first led to the depuration tanks before entering the circulation.
The circular tanks with bottom drains remove all the water, solid particles and sludge (Supplementary Figure S1). Water was pumped from the rearing tanks into three drum filters (Hydrotech, HDF2009-1AS 304), equipped with a 90 µm mesh size to remove particulate matter.
The water was pumped into fully stabilized up-flow fixed-bed biofilters to transform ammonium first into nitrite and then into less harmful nitrate. Dissolved carbon dioxide was removed from the water using a countercurrent trickling filter at a flow rate of 2500 L s−1 and air at about 10 m3 s−1. The hydraulic retention time of the RAS was 77.5 hours. The circulating water was treated with UV light (6 Ultraqua MR8-440-SS) at 120 mJ cm−1). The water temperature was maintained at 16.8 ± 0.5°C. Water from the drum filters was collected in a reservoir tank in which the pH was adjusted and monitored with two pH sensors located in the header tanks. The pH of the circulating water was kept at 7.0 ± 0.1 and adjusted with NaOH addition, ranging from 25 to 100 kg d−1. Oxygen was stored in a tank of liquid oxygen, maintaining the oxygen levels in the fish tanks at 8.0–10.0 mg L−1.
Inlet water was pumped from Lake Unnukka (62°25ʹ N 27°55ʹ E), which belongs to the Vuoksi catchment area and has a surface area of 80.45 km2, an average depth of 6.27 m, and a water volume of 0.5 km3. It is part of Lake Saimaa, the largest lake in Finland, based on its surface area of 4400 km2. Lake Unnukka is considered a mesotrophic lake with a brownish color due to the high content of humic matter.
Inlet water from Lake Unnukka was added at an average of 25–33 L s−1 with a maximum of 35 L s−1 to replace, for example, the water removed with the sludge, and disinfected with UV light (Atlantium RZ-163). The addition equated to an average 1070 L kg−1 feed, while 15–30 L s−1 of circulating water was removed.
The RAS process was monitored constantly and adjusted by the Arvo-Tec (Joroinen, Finland) process control system. Additionally, water quality was regularly monitored by pooled sampling from the rearing tanks, including total ammonia, ammonium, nitrite, and nitrate nitrogen by quick spectrophotometric laboratory tests (Procedure 8038 Nessler, LCK340, LCK341, Supplementary Figure S2). Turbidity was measured with a Hach 2100Q Turbidimeter, USA, and UV transmittance (UV-T, %) was measured at 254 nm, which was used to define water clarity (Supplementary Figures S2-S4). The concentration of nitrite-N was kept at below 0.45 mg L−1, while that of nitrate-N remained below 65 mg L−1 (), a suitable level for salmonids (Kroupova et al. 2005).
Figure 1. Concentrations of ammonium-N (NH4-N, mg L−1), nitrite-N (NO2-N, mg L−1), nitrate-N (NO3-N, mg L−1, y-axis on the right-hand side), and turbidity (NTU) in the header tank water.
Fish handling
The rainbow trout fry originated in the Hollola flow-thru hatchery, and they were allowed to grow to a weight of 50–100 g at the Huutokoski RAS farm before they were brought to the facility. The fish were typically reared until they reached 700 g. On average, there were 45000–47000 fish in each rearing tank, each growing on average from 130 to 700 g, with a biomass ranging from about 5800 kg to 30500 kg in each tank. Moreover, there were 20000–25000 fish in each depuration tank. The fish were visually inspected on a daily basis. Any mortalities were removed, and changes in fish behavior (if any) were monitored and recorded. The experiment occurred between August 2019 and January 2020.
During the experiment, feeding ranged from 1.2% to 1.5% of the biomass, 2.2–3.3 ton d−1. The fish were mostly (88–90%) fed with BioMar Orbit 4.5 mm pellets (Biomar A/S, Denmark), some (10–12%) were fed with Crystal Omega Astax 4.5 mm pellets (Alltech Coppens, Germany). Feeding was evenly executed with a commercial centralized pipe feeding system (Arvo-Tec, Joroinen, Finland) 10–14 times per day in constant light.
Oxidative treatments
H2O2 addition
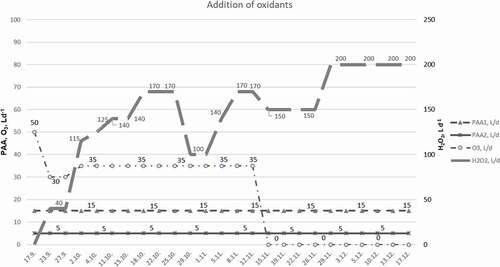
H2O2 (50%, Bang & Bonsomer, Helsinki, Finland) was constantly added to the circulating water by dosing pumps; one nozzle into the flow after the biofilter and the other nozzle into the header tank. At first, the amount of H2O2 ranged from 20 to 125 L d−1 (0.00009–0.0006 L H2O2 m−3, 216000 m3 d−1), but later it was increased to 200 L d−1 (0.0009 L H2O2 m−3). The dosing timelines of H2O2 are presented in . H2O2 was added to the circulating water before returning to the rearing tanks. After a month, the point of H2O2 addition was changed to the pump sumps, located after the trickling filter. Water samples were taken to analyze of off-flavor compounds. The occurrence of any residual peroxide was tested with colorimetric peroxide test strips (0.5–25 mg H2O2 L−1, MQuant™, Merck) once a week to ensure the removal of residual peroxide from the system.
Figure 2. Addition of PAA, H2O2, and O3 over the course of experiment. PAA1 was added (15 L d−1, 5.2•10−3-5.4•10−3 L PAA m−3) into the inlet water and PAA2 (4–6 L d−1, 1.4•10−3-2.1•10−3 L PAA m−3) into the aeration system of the depuration tanks. H2O2 was added 20–200 L d−1 (0.00009–0.0009 L H2O2 m−3) to the circulating water and O3 30–50 L d−1 (0.010–0.018 L O3 m−3) to the inlet water.
PAA addition
Peracetic acid (PAA, Bonsoxo 2901, Bang & Bonsomer, Helsinki, Finland) contained 12–13 w-% of PAA and, 19–23 w-% of hydrogen peroxide, the rest being acetic acid. PAA was added to the untreated inlet water (32–33 L s−1, 2800–2900 m3 d−1) pipeline at a flow rate of 15 L d−1 (5.2•10−3-5.4•10−3 L PAA m−3) before the UV treatment. The treated inlet water was first pumped to the depuration tanks before entering the circulation. Additionally, PAA was constantly pumped into the aeration system of the depuration tanks (à 240 m3) at a flow rate of 4–6 L d−1 (1.4•10−3-2.1•10−3 L PAA m−3). The dosing timelines of PAA are also presented in .
O3 addition
At the beginning of the experiment, ozone (O3) was added to the inlet water (32–33 L s−1, 2800–2900 m3 d−1) with a flow rate of 50 L d−1 (0.018 L O3 m−3) and a pressure of 3.5 bars. Later, the dosage was decreased to 30 L d−1 and increased back to 35 L d−1, corresponding to a dosage of 0.010–0.013 L O3 m−3. The dosing timelines of O3 are presented in . Unfortunately, due to the ozonation system failure, ozone addition was stopped by mid-November.
Sampling and analysis
Sampling
Circulating water was sampled from the outlet pipeline before the drum filter. Sampling was performed by collecting water from the two outlet pipelines before drum filters 1 and 2. Similarly, samples were collected from both header tanks (HT 1 and 2) and biofilters (BF 1 and 2) before the UV treatment. Additionally, inlet water from Lake Unnukka was sampled from the inlet pipeline before further treatments. Finally, water samples were taken directly from the 240 m3 depuration tank. Water samples were collected in 250 mL high-density polyethylene (HDPE) plastic jars with HDPE plastic caps, and stored frozen at −22°C before the analysis.
Fish were sampled from the rearing and depuration tanks. In both cases, two fish were taken, euthanized, gutted, and frozen. The fish were stored at −22°C until preparation for the pretreatment. The fish were then thawed, filleted, and sampled from the lateral part of the fillet, as defined by Hathurusingha and Davey (Citation2016).
Pretreatment
A manual solid phase micro extraction (SPME) assembly with an extraction fiber coated with StableFlex divinylbenzene/carboxene/polydimethyl siloxane (DVB/CAR/PDMS), 1 cm, 50/30 µm (part no. 57328-U) in a manual holder was purchased from Supelco (Merck). Additionally, 10 mL headspace (HS) glass vials and polytetrafluoroethylene (PTFE) septum caps were purchased from Merck.
To quantify GSM and MIB, 3-isobutyl-2-methoxypyrizine (IBMP, C9H14N2O, CAS nbr. 24683–00-9) from Sigma Aldrich (99%, 0.99 g mL−1) was used as an internal standard. A solution of 90 ng L−1 was prepared by diluting with methanol (99%, J.T. Baker, WVR). High-performance liquid chromatography (HPLC) grade methanol was obtained from J.T Baker.
Pretreatment for chemical analysis was performed as described by Lindholm-Lehto et al. (Citation2019b). In short, GSM and MIB were extracted by using HS-SPME. A volume of 1 mL of aqueous sample or 1 g of fish flesh was placed in a 10 mL HS vial with 1 g of solid NaCl (98%, Merck). An internal standard solution of 30 µL was added into a sample vial. A sealed sample vial was placed in a water bath at 60°C. A DVB/CAR/PDMS fiber was exposed to the headspace and kept for 30 minutes to complete the extraction before introducing the fiber directly into the inlet of the gas chromatograph-mass spectrometer (GC-MS).
Chemical analysis
As previously reported by Lindholm-Lehto et al. (Citation2019b), separation and quantification of GSM and MIB in the circulating water and in rainbow trout flesh was carried out using a GC-MS equipment by Agilent 6890 series/5973 N GC/MSD (Palo Alto, CA, USA) system with a Phenomenex Zebron ZB-5MSi (Torrance, CA, USA) capillary column (30 m × 0.25 mm × 0.25 µm). The temperature of the injector was adjusted to 270°C in the splitless mode. The carrier gas was helium at a flow rate of 0.7 mL min−1. The temperature of the oven started at 45°C for 3 min, increasing by 30°C min−1 to achieve 300°C (total time 14.5 min).
The electron impact (EI)-MS conditions were selected as 230°C for the ion source with a 5 min delay time and ionizing voltage of 70 eV. The selected ion monitoring (SIM) mode was used for the detection of GSM with m/z 112, 126, and 182, MIB with m/z 95, 135, and 168 (MIB), and the internal standard IBMP with m/z 137. Base peak areas of m/z 95 and m/z 112 were used for the quantification of GSM and MIB. A fully detailed method and validation data have been reported by Lindholm-Lehto et al. (Citation2019b).
Microbial count
The number of total colony-forming units of viable bacterial and fungal cells (cfu mL−1) was determined by the laboratory of Stora Enso Varkaus mill according to standard ISO 8784. Samples were collected on seven selected days between September and December 2019 from the clean water inlet, after the rearing tanks, from the depuration tank, biofilter, and from the header tank.
Statistical analyses
A regression analysis was carried out with Systat software, version 13.1 . Linear regression relationships were studied between the oxidant additions and GSM and MIB concentrations. The significance level was set at 0.05.
Results
Off-flavors in circulating water
According to the results (), the concentrations ranged from <LOD to 34 ng L−1 (GSM), and from 6.1 ng L−1 to 68 ng L−1 (MIB), in water from the biofilter. After the application of H2O2 with a constant flow of up to 100 L d−1 into the circulating water flow of 2500 L s−1, the concentrations dropped from 68 ng L−1 to 29.1 ng L−1 (MIB), and from 15 ng L−1 to <LOD (GSM). However, after a week, the concentrations of GSM and MIB increased again, peaking at 57.6 ng L−1 (MIB), despite the fact the H2O2 solution was administered 140 L d−1. The concentrations of MIB decreased and remained below 17 ng L−1, while concentrations of GSM fluctuated up to 34 ng L−1. Finally, after a H2O2 dosage at 170 L d−1 for several weeks, the levels of both off-flavor compounds remained below 10 ng L−1 ().
Figure 3. Concentrations of GSM and MIB (n = 4, ± SD, ng L−1) in the circulating water after the biofilter. An H2O2 solution was applied, with a dosage of 0–170 L d−1. PAA was applied to the inlet water 15 L d−1 (PAA1) and 4–6 L d−1 (PAA2) into the aeration system of the depuration tanks.
In the header tanks, an H2O2 solution was administered at levels from 40 L d−1 to 170 L d−1. At the beginning of the experiment, the levels of GSM remained at 20 ng L−1, while those of MIB were below LOD (, Supplementary Figure S5). However, in late October, the concentrations of both compounds peaked at 33 ng L−1. This occurred before the end of ozone administration with a normal amount of feed. Similar behavior was not observed after the biofilter or after the rearing tanks.
Figure 4. Concentrations of GSM and MIB (n = 4, ± SD, ng L−1) in the circulating water from the header tanks before entering the rearing tanks. An H2O2 solution was applied, with a dosage of 0–170 L d−1. PAA was applied to the inlet water 15 L d−1 (PAA1) and 4–6 L d−1 (PAA2) into the aeration system of the depuration tanks.
During the experiment, the total colony-forming unit counts of viable bacterial and fungal cells (cfu mL−1) decreased from 17 000 to 4900 in the drum filters, and from 216 000 to 1500 in the depuration tanks. The total colony-forming unit counts are listed in Supplementary Table 1
Concentrations in the depuration tanks were studied twice during the experiment in September and November. In both cases, concentrations of GSM and MIB were analyzed after 1 d, and after 7 d in depuration (). Similarly, untreated water from Lake Unnukka was analyzed three times during the experiment, in September, October, and November ().
Table 1. Concentrations of GSM and MIB (ng L−1, n = 4, ± SD) in untreated inlet water from Lake Unnukka and in depuration tank water after 1 and 7 d
Later, the dosage of H2O2 was further increased to 200 L d−1 when added to the circulating water (2500 L s−1) in the pump sumps. Concentrations of GSM then decreased to a few ng L−1 (). However, concentrations of MIB increased and remained at about 18 ng L−1, despite a continuous administration of H2O2.
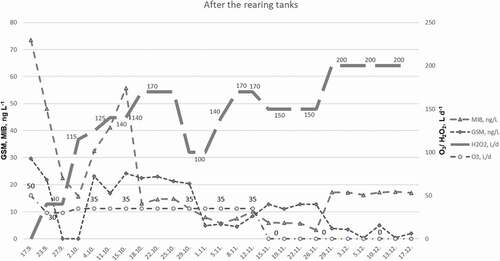
Figure 5. Concentrations of GSM and MIB (n = 4, ± SD, ng L−1) in the circulating water after the rearing tanks. An H2O2 solution was applied with a dosage of 0–200 L d−1 to the circulating water (2500 L s−1) and ozone (O3) 0–50 L d−1 to the inlet water (32–33 L s−1).
The coefficient for correlating the H2O2 additions, GSM, and MIB concentrations resulted in moderate to low R2 values of 0.166 for GSM, and 0.316 for MIB. After the biofilters, R2 values of 0.435 for MIB and 0.005 for GSM were observed, while R2 values of 0.201 (GSM) and 0.002 (MIB) resulted from the header tanks. Linear regression equations, p values, and R2 values are listed in . The p values are listed only in the case of significant correlation (p < .05).
Table 2. Linear regression correlations between different H2O2 additions with GSM and MIB concentrations
. Linear regression correlations between different H2O2 additions with GSM and MIB concentrations. The significance level was set at 0.05.
Fish fillet
Off-flavors in rainbow trout fillet were studied once, at the end of the experiment. Concentrations of 1.3 ± 0.2 ng g−1 (MIB) and 3.6 ± 0.1 ng g−1 (GSM) were detected in rainbow trout sampled from a rearing tank with circulating water. After the depuration period of 7 d, 0.3 ± 0.1 ng g−1 of MIB and 0.4 ± 0.1 ng g−1 of GSM were found in the fish fillet.
Other observations
According to visual inspection, water clarity improved within a few weeks of starting the experiment. Additionally, turbidity decreased from 1.1 to 0.5 NTU by mid-November (Supplementary Figure S2). As the ozone addition stopped due to equipment failure, turbidity increased, returning to 1.0 NTU.
Discussion
The treatment of inlet and circulating water with oxidants seemed to decrease the overall concentrations of off-flavors. However, no linear correlation between the H2O2 dosage and the concentrations in the header tanks or after the biofilters was found (). Concentrations of both off-flavor compounds fluctuated after the rearing tanks (). First, the levels of MIB dropped, while those of GSM increased, and later, the concentrations of GSM decreased, while those of MIB increased again. Auffret et al. (Citation2011) reported that the number of potential off-flavor producers in a RAS can change rapidly and differ greatly in the water and biofilter. This may explain the observed changes in concentrations. Additionally, organic matter may have been consuming the oxidative chemicals, or there may have been a local increase in microbes producing off-flavors.
As shown in , a decrease in ammonium removal efficiency was not observed throughout the observation period. Although Pedersen and Pedersen (Citation2012) reported that H2O2 addition to the biofilter reduced ammonium removal efficiency, they added H2O2 in a biofilter section, but in this study, it was administered after the biofilter and into the header tank. From the header tank, water was led into the rearing tanks. Additionally, a very low dose (200 L d−1 into 2500 L s−1) was used. Pedersen and Pedersen (Citation2012) used H2O2 (15–64 mg H2O2 L−1) at a commercial RAS rearing rainbow trout, but they did not study its effect on off-flavors. At 64 mg L−1 levels, they observed reduced ammonium removal efficiency. Similarly, Schwartz et al. (Citation2000) studied a dosage of 100 mg H2O2 L−1 and observed an 80% reduction in ammonium removal. In this study, much lower concentrations were used (up to 200 L d−1, 0.0023 L s−1 H2O2 into 2500 L s−1 flow), a fraction of those in the previous reports.
Throughout the experiment, the factors describing nitrogen compounds and general water quality remained relatively stable (Supplementary Figures S2, S4). This means that the process remained stable throughout the experiment, and the added oxidants did not show adverse effects in the function of biofilters (, Supplementary Figure S2). The inlet water from Lake Unnukka increased in UV-T and decreased in turbidity during the experiment (Supplementary Figure S3). This can be considered typical of higher temperatures and microbial production in the early autumn compared to winter. The highest reaction rates for MIB production have been reported in August and September (Watson Citation2004). In addition to temperature, eutrophication also affects the occurrence of off-flavors in waterbodies, and even in winter, concentrations of more than 100 ng L−1 (MIB) have been reported (Wang et al. Citation2015). Based on this, treatment of inlet water is highly recommended, especially in summer.
Ozone can oxidize organic compounds, coagulate small organic particles into larger ones, and enhance mechanical filtration (Rahmadi and Kim Citation2014) which may have been the case in the middle part of the experiment, when decreased turbidity was observed in the circulating water (). However, a relatively small dose of ozone (30 L O3 d−1) was applied to the inlet water (32–33 L s−1). After ozonation, the inlet water was led through sand filters and UV treatment. Ozonation mainly influenced the inlet water quality, inducing only a moderate effect on the circulating water. According to Bruce, Westerhoff, and Brawley-Chesworth (Citation2002), lower alkalinity enhances GSM and MIB oxidation. In the Nordic countries, alkalinity is typically very low in lake water (0.22–0.25 mmol L−1 in Lake Unnukka, HERTTA Citation2020). Since it is used as inlet water, it also affects the alkalinity of the RAS. Unfortunately, the alkalinity data of the system were unavailable.
The improved water quality was probably caused by H2O2 and ozone additions. Ozone-induced improved water quality has also been reported by Krumins, Ebeling, and Wheaton (Citation2001) and Summerfelt et al. (Citation2009). Additionally, the amount of biofilm decreased at the beginning of the experiment, which led to a reduced requirement to clean the tanks and easier maintenance work. This effect was also observed at the end of the experiment, despite stopping the ozone addition, emphasizing the effect of H2O2 and PAA additions.
Treatments with UV/H2O2 and UV/O3 have potential in degrading GSM and MIB in RAS, but the degradation rate can be reduced due to competitive reactions with organic matter (Klausen and Grønborg Citation2010). This emphasizes the importance of organic matter removal in RAS when aiming to remove off-flavors using oxidative chemicals. Klausen and Grønborg (Citation2010) suggested a pretreatment before AOP treatments to improve the feasibility of the treatment. Pedersen and Pedersen (Citation2012) observed improved water quality due to H2O2 addition, similar to the results of this study.
In the case of PAA, pulse application has been reported to remove bacterial biofilm more efficiently (Liu et al. Citation2017) than continuous application. In this study, low doses of PAA (15 L d−1, 5.2 · 10−3-5.4 · 10−3 L PAA m−3) were administered continuously to the inlet water from the nearby lake. Later, the pulse application of PAA and its effect on biofilm growth, bacterial density, and off-flavor concentrations will be worth studying.
In previous studies, a thick layer of mucus has been observed on fish skin after PAA addition (2.2 mg PAA L−1 1–4 times per week, Lindholm-Lehto et al. Citation2019a). In this study, neither this effect nor any signs of discomfort in fish behavior were observed, which was probably due to the much lower dose of PAA: 15 L PAA d−1, to inlet water of 32–33 L s−1 (5.2 · 10−3-5.4 · 10−3 L PAA m−3), and 4–6 L PAA d−1 to the aeration system of the depuration tanks (1.4 · 10−3-2.1 · 10−3 L PAA m−3). Fish can adapt to moderate (0.2–1 mg PAA L−1 for 6 weeks) PAA concentrations (Gesto et al. Citation2018).
The highest unit counts of viable bacterial and fungal cells (cfu mL−1) were found in the depuration tank, while the lowest number was found in the inlet water. The unit counts dropped during the experiment in all sampling locations (Supplementary Table S1). This may be due to the addition of oxidative chemicals.
Overall, the detected concentrations of GSM and MIB of this study () were in the same range as those reported by Sarker et al. (Citation2014). They found 16 ng L−1 (GSM) in tank water and 30 ng L−1 in a biofilter of a RAS rearing rainbow trout. On the other hand, Hathurusingha and Davey (Citation2016) reported higher concentrations (161 ng L−1 GSM, 150 ng L−1 MIB) in the circulating water of a commercial barramundi (Lates calcarifer) RAS farm. This shows that the concentrations of off-flavors in this study can be considered typical, although each facility has its own unique microbiome. However, several factors have an influence on the off-flavor concentrations in RAS, including water temperature, water renewal rate, fish density, and the off-flavor concentrations in the supply water (Drake et al. Citation2010; Howgate Citation2004), and one should be careful in making comparisons between different RASs.
In this study, the concentrations in the fish fillet were 1.3 ± 0.2 ng g−1 for MIB and 3.6 ± 0.1 ng g−1 for GSM before the depuration. They were significantly above the sensory thresholds determined for rainbow trout: 0.9 ng g−1 for GSM, and 0.7 ng g−1 for MIB (Robertson et al. Citation2006, Citation2005), but as low as 0.1–0.2 ng g−1 for MIB, and 0.25–0.5 ng g−1 for GSM in catfish (Ictalurus punctatus) have been reported (Grimm, Lloyd, and Zimba Citation2004). Somewhat higher concentrations of MIB have previously been found in RAS farmed rainbow trout (Oncorhynchus mykiss) (0.27–0.59 ng g−1 for GSM, and 4.8–19.7 ng g−1 for MIB, Zimba et al. Citation2012). After the depuration period of this study, the concentrations were 0.4 ng g−1 for GSM, and 0.3 ng g−1 for MIB, emphasizing the importance of sufficient depuration. The lipid content affects the sensory threshold (Howgate Citation2004), and the results should be assessed based on that information. Although only a couple of fish were selected for analysis, concentrations remained below the commonly accepted threshold values, which is suitable for even the most sensitive consumers.
Conclusions
A combination of oxidative chemicals at sufficient doses seemed to reduce the concentrations of off-flavor compounds in a full-scale RAS. The H2O2 especially seemed to have a reducing effect on the off-flavor compounds. Additionally, improved overall water quality and reduced biofilm formation were observed, which reduced the daily maintenance work. This cannot be solely due to ozone because of its moderate dose in the inlet water. However, concentrations of off-flavors did not correlate with the applied dose in each stage, suggesting that a number of other factors affect them. For example, the content of organic matter or an increase in microbial count can affect off-flavor concentrations. As certain microbes decrease due to oxidant administration, others can increase. In conclusion, oxidative chemicals can be a justified addition to control off-flavors in a commercial RAS and especially to ensure a good quality of inlet water. However, they have not been fully able to remove the problem, depuration being still required. The present study was performed in a large-scale commercial RAS and was neither designed nor able to differentiate systematically between the specific effects of each chemical or their synergetic effect. This remains a subject for future research with an appropriately replicated experimental design. All in all, this study indicated that a combination of suitable oxidants (H2O2, O3, and PAA) seemed to be able to decrease the overall off-flavor concentrations in the circulating water, suggesting a need for a reduced depuration period. In large-scale production, even a small improvement can have a positive effect on profitability.
Author contributions
The experiment was planned by PH. PLL conducted the sample preparations and the chemical analyses of off-flavors. The others were organized by PH. The manuscript was drafted by PLL. TK and PH critically examined and revised the manuscript.
Supplemental Material
Download Zip (247.7 KB)Acknowledgments
Financial support provided from the European Maritime and Fisheries Fund is gratefully acknowledged. We also wish to express our gratitude to Maarit Auvinen from Stora Enso Varkaus mill for performing the microbial tests.
Disclosure statement
No potential conflict of interest was reported by the authors.
Supplementary material
Supplemental data for this article can be accessed on the publisher’s website.
Related Research Data
References
- Alasri, A., C. Roques, G. Michel, C. Cabassu, and P. Aptel. 1992. Bactericidal properties of peracetic-acid and hydrogen-peroxide, alone and in combination, and chlorine and formaldehyde against bacterial wastewater. Canadian Journal of Microbioly 38:635–42. doi:https://doi.org/10.1139/m92-104.
- Auffret, M., A. Pilote, E. Proulx, D. Proulx, G. Vandenberg, and R. Villemur. 2011. Establishment of a real-time PCR method for quantification of geosmin-producing Streptomyces spp. in recirculating aquaculture systems. Water Research 45:6753–62. doi:https://doi.org/10.1016/j.watres.2011.10.020.
- Auffret, M., E. Yergeau, A. Pilote, É. Proulx, D. Proulx, C. W. Greer, G. Vandenberg, and R. Villemur. 2013. Impact of water quality on the bacterial populations and off-flavours in recirculating aquaculture systems. FEMS Microbiology Ecology 84:235–47. doi:https://doi.org/10.1111/1574-6941.12053.
- Azbar, N., T. Yonar, and K. Kestioglu. 2004. Comparison of various advanced oxidation processes and chemical treatment methods for COD and color removal from a polyester and acetate fiber dyeing effluent. Chemosphere 55:35–43. doi:https://doi.org/10.1016/j.chemosphere.2003.10.046.
- Bruce, D., P. Westerhoff, and A. Brawley-Chesworth. 2002. Removal of 2-methylisoborneol and geosmin in surface water treatment plants in Arizona. Journal of Water Supply: Research and Technology - AQUA 51:183–97. doi:https://doi.org/10.2166/aqua.2002.0016.
- Dalsgaard, J., I. Lund, R. Thorarinsdottir, A. Drengstig, K. Arvonen, and P. Bovbjerg Pedersen. 2013. Farming different species in RAS in Nordic countries: Current status and future perspectives. Aquacultural Engineering 53:2–13. doi:https://doi.org/10.1016/j.aquaeng.2012.11.008.
- Davidson, J., K. Schrader, E. Ruan, B. Swift, J. Aalhus, M. Juarez, W. Wolters, G. Burr, C. Good, and S. T. Summerfelt. 2014. Evaluation of depuration procedures to mitigate the off-flavor compounds geosmin and 2-methylisoborneol from Atlantic salmon Salmo salar raised to market-size in recirculating aquaculture systems. Aquacultural Engineering 61:27–34. doi:https://doi.org/10.1016/j.aquaeng.2014.05.006.
- Dickschat, J. S., H. B. Bode, T. Mahmud, R. Müller, and S. Schulz. 2005. A novel type of geosmin biosynthesis in myxobacteria. Journal of Organic Chemistry 70:5174–82. doi:https://doi.org/10.1021/jo050449g.
- Drake, S. L., M. A. Drake, R. Sanderson, H. V. Daniels, and M. D. Yates. 2010. The effect of purging time on the sensory properties of aquacultured southern flounder (Paralichthys lethostigma). Journal of Sensory Studies 25:246–59. doi:https://doi.org/10.1111/j.1745-459X.2009.00255.x.
- Flores, M. J., M. R. Lescano, R. J. Brandi, A. E. Cassano, and M. D. Labas. 2014. A novel approach to explain the inactivation mechanism of Escherichia coli employing a commercially available peracetic acid. Water Science and Technology 69:358–63. doi:https://doi.org/10.2166/wst.2013.721.
- Gerber, N. N. 1968. Geosmin from microorganisms in trans-1,10-dimethyl-trans-9-decalol. Tetrahedron Letters 25:2971–74. doi:https://doi.org/10.1016/S0040-4039(00)89625-2.
- Gerber, N. N. 1969. A volatile metabolite of actinomycetes: 2-methylisoborneol. Journal of Antibiotics 22:508–09. doi:https://doi.org/10.7164/antibiotics.22.508.
- Gesto, M., D. Liu, L.-F. Pedersen, T. Meinelt, D. L. Straus, and A. Jokumsen. 2018. Confirmation that pulse and continuous peracetic acid administration does not disrupt the acute stress response in rainbow trout. Aquaculture 492:190–94. doi:https://doi.org/10.1016/j.aquaculture.2018.04.009.
- Grimm, C. C., S. W. Lloyd, and P. V. Zimba. 2004. Instrumental versus sensory detection of off-flavors in farm-raised channel catfish. Aquaculture 236:309–19. doi:https://doi.org/10.1016/j.aquaculture.2004.02.020.
- Guttman, L., and J. van Rijn. 2008. Identification of conditions underlying production of geosmin and 2-methylisoborneol in a recirculating system. Aquaculture 279:85–91. doi:https://doi.org/10.1016/j.aquaculture.2008.03.047.
- Hathurusingha, P., and K. R. Davey. 2016. Experimental validation of a time-dependent model for chemical taste taint accumulation as geosmin (GSM) and 2-methylisoborneol (MIB) in commercial RAS farmed barramundi (Lates calcarifer). Ecological Modelling 340:17–27. doi:https://doi.org/10.1016/j.ecolmodel.2016.08.017.
- HERTTA. 2020. Environmental information system, Finnish Environment Institute. https://wwwp2.ymparisto.fi/scripts/hearts/welcome.asp.
- Ho, L., J.-P., Croué, and G. Newcombe. 2004. The effect of water quality and NOM character on the ozonation of MIB and geosmin. Water Science and Technology 49: 246–255. doi:https://doi.org/10.2166/wst.2004.0583
- Howgate, P. 2004. Tainting of farmed fish by geosmin and 2-methyl-iso-borneol: A review of sensory aspects and of uptake/depuration. Aquaculture 234:155–81. doi:https://doi.org/10.1016/j.aquaculture.2003.09.032.
- Jones, B., S. Fuller, and A. G. Carton. 2013. Earthy‐muddy tainting of cultured barramundi linked to geosmin in tropical northern Australia. Aquaculture Environment Interactions 3:117–24. doi:https://doi.org/10.3354/aei00056.
- Klausen, M. M., and O. Grønborg. 2010. Pilot scale testing of advanced oxidation processes for degradation of geosmin and MIB in recirculated aquaculture. Water Science & Technology: Water Supply 10:217–25. doi:https://doi.org/10.2166/ws.2010.246.
- Koivunen, J., and H. Heinonen-Tanski. 2005. Inactivation of enteric microorganisms with chemical disinfectants, UV irradiation and combined chemical/UV treatments. Water Research 39:1519–26. doi:https://doi.org/10.1016/j.watres.2005.01.021.
- Krumins, K., J. M. Ebeling, and F. Wheaton. 2001. Part-day ozonation for nitrogen and organic carbon control in recirculating aquaculture systems. Aquacultural Engineering 24:231–41. doi:https://doi.org/10.1016/S0144-8609(01)00061-9.
- Lindholm-Lehto, P. C., H. Pakkanen, J. Vielma, and R. Alén. 2019b. Depuration of geosmin- and 2-methylisoborneol-induced off-flavors in recirculating aquaculture system farmed European whitefish Coregonus lavaretus. Journal of Food Science and Technology 56:4585–94. doi:https://doi.org/10.1007/s13197-019-03910-7.
- Lindholm-Lehto, P. C., S. Suurnäkki, J. T. Pulkkinen, S. L. Aalto, M. Tiirola, and J. Vielma. 2019a. Effect of peracetic acid on levels of geosmin, 2-methylisoborneol, and their potential producers in a recirculating aquaculture system for rearing rainbow trout (Oncorhynchus mykiss). Aquacultural Engineering 85:56–64. doi:https://doi.org/10.1016/j.aquaeng.2019.02.002.
- Liu, D., D. L. Straus, L.-F. Pedersen, and T. Meinelt. 2017. Pulse versus continuous peracetic acid applications: Effects on rainbow trout performance, biofilm formation and water quality. Aquacultural Engineering 77:72–79. doi:https://doi.org/10.1016/j.aquaeng.2017.03.004.
- Ludwig, F., A. Medger, H. Börnick, M. Opitz, K. Lang, M. Göttfert, and I. Röske. 2007. Identification and expression analyses of putative sesquiterpene synthase genes in Phormidium sp. and prevalence of geoA-like genes in a drinking water reservoir. Applied Environmental Microbiology 73:6988–93. doi:https://doi.org/10.1128/AEM.01197-07.
- Lukassen, M. B., R. Podduturi, B. Rohaan, N. O. G. Jørgensen, and J. L. Nielsen. 2019. Dynamics of geosmin-producing bacteria in a full-scale saltwater recirculated aquaculture system. Aquaculture 500:170–77. doi:https://doi.org/10.1016/j.aquaculture.2018.10.008.
- Madsen, H. C. K., K. Buchmann, and S. Mellergård. 2000. Treatment of trichodiniasis in eel (Anguilla anguilla) reared in recirculation systems in Denmark: Alternatives to formaldehyde. Aquaculture 186:221–31. doi:https://doi.org/10.1016/S0044-8486(99)00379-8.
- Mahmoud, M. A. A., and A. Buettner. 2017. Characterisation of aroma-active and off-odour compounds in German rainbow trout (Oncorhynchus mykiss). Part II: Case of fish meat and skin from earthen-ponds farming. Food Chemistry 232:841–49. doi:https://doi.org/10.1016/j.foodchem.2016.09.172.
- Monarca, S., S. D. Richardson, D. Feretti, M. Grottolo, A. D. Thruston, C. Zani, G. Navazio, P. Ragazzo, I. Zerbini, and A. Alberti. 2002. Mutagenicity and disinfection by-products in surface drinking water disinfected with peracetic acid. Environmental Toxicology and Chemistry 21:309–18. doi:https://doi.org/10.1002/etc.5620210212.
- Natural Resources Institute Finland 86/2019. Accessed February 19, 2020. https://stat.luke.fi/sites/default/files/luke-luobio_86_2019_0.pdf.
- Neyens, E., J. Baeyens, M. Weemas, and B. De Heyder. 2002. Advanced biosolids treatment using H2O2 oxidation. Environmental Engineering Science 19:27–35. doi:https://doi.org/10.1089/109287502753590214.
- Park, J., P. K. Kim, T. Lim, and H. V. Daniels. 2013. Ozonation in seawater recirculating systems for black seabream Acanthopagrus schlegelii (Bleeker): Effects on solids, bacteria, water clarity, and color. Aquacultural Engineering 55:1–8. doi:https://doi.org/10.1016/j.aquaeng.2013.01.002.
- Pedersen, L.-F., and P. B. Pedersen. 2012. Hydrogen peroxide application to a commercial recirculating aquaculture system. Aquacultural Engineering 46:40–46. doi:https://doi.org/10.1016/j.aquaeng.2011.11.001.
- Pedersen, L.-F., P. B. Pedersen, J. L. Nielsen, and P. H. Nielsen. 2009. Peracetic acid degradation and effects on nitrification in recirculating aquaculture systems. Aquaculture 296:246–54. doi:https://doi.org/10.1016/j.aquaculture.2009.08.021.
- Pedersen, L.-F., P. B. Pedersen, and O. Sortkjær. 2006. Dose-dependent decomposition rate constants of hydrogen peroxide in small-scale bio filters. Aquacultural Engineering 34:8–15. doi:https://doi.org/10.1016/j.aquaeng.2005.03.005.
- Petersen, M. A., G. Hyldig, B. W. Strobel, N. Henriksen, and N. O. G. Jørgensen. 2011. Chemical and sensory quantification of geosmin and 2-methylisoborneol in rainbow trout (Oncorhynchus mykiss) from recirculated aquacultures in relation to concentrations in basin water. Journal of Agricultural and Food Chemistry 59:12561–68. doi:https://doi.org/10.1021/jf2033494.
- Podduturi, R., M. A. Petersen, M. Vestergaard, and N. O. G. Jørgensen. 2020. Geosmin fluctuations and potential hotspots for elevated levels in recirculated aquaculture system (RAS): A case study from pikeperch (Stizostedion lucioperca) production in Denmark. Aquaculture 514:734501. doi:https://doi.org/10.1016/j.aquaculture.2019.734501.
- Powell, A., and J. W. S. Scolding. 2016. Direct application of ozone in aquaculture systems. Reviews in Aquaculture 10:424–38. doi:https://doi.org/10.1111/raq.12169.
- Rach, J. J., T. M. Schreier, G. E. Howe, and S. D. Redman. 1997. Effect of species, life stage, and water temperature on the toxicity of hydrogen peroxide to fish. The Progressive Fish-Culturist 59:41–46. doi:https://doi.org/10.1577/1548-8640(1997)059<0041:EOSLSA>2.3.CO;2.
- Rahmadi, P., and Y. R. Kim. 2014. Effects of different levels of ozone on ammonia, nitrite, nitrate, and dissolved organic carbon in sterilization of seawater. Desalination and Water Treatment 52:4413–22. doi:https://doi.org/10.1080/19443994.2013.803702.
- Robertson, R. F., A. Hammond, K. Jauncey, M. C. M. Beveridge, and L. A. Lawton. 2006. An investigation into the occurrence of geosmin responsible for earthy–musty taints in UK farmed rainbow trout. Onchorhynchus mykiss. Aquaculture 259:153–63. doi:https://doi.org/10.1016/j.aquaculture.2004.11.046.
- Robertson, R. F., K. Jauncey, M. C. M. Beveridge, and L. A. Lawton. 2005. Depuration rates and the sensory threshold concentration of geosmin responsible for earthy–musty taint in rainbow trout. Onchorhynchus mykiss. Aquaculture 245:89–99. doi:https://doi.org/10.1016/j.aquaculture.2004.11.045.
- Rosenfeldt, E. J., K. G. Linden, S. Canonica, and U. von Gunten. 2006. Comparison of the efficiency of ·OH radical formation during ozonation and the advanced oxidation processes O3/H2O2 and UV/H2O2. Water research 40: 3695–3704. doi:https://doi.org/10.1016/j.watres.2006.09.008
- Rosenfeldt, E. J., B. Melcher, and K. G. Linden. 2005. UV and UV/H2O2 treatment of methylisoborneol (MIB) and geosmin in water. Journal of Water Supply: Research and Technology - AQUA 54:423–34. doi:https://doi.org/10.2166/aqua.2005.0040.
- Rurangwa, E., and M. C. J. Verdegem. 2015. Microorganisms in recirculating aquaculture systems and their management. Reviews in Aquaculture 7:117–30. doi:https://doi.org/10.1111/raq.12057.
- Saez, J. A., and P. R. Bowser. 2001. Hydrogen peroxide concentrations in hatchery culture units and effluent during and after treatment. North American Journal of Aquaculture 63:74–78. doi:https://doi.org/10.1577/1548-8454(2001)063<0074:HPCIHC>2.0.CO;2.
- Sarker, P., A. Pilote, M. Auffret, E. Proulx, R. Villemur, M.-H. Deschamps, and G. Vandenberg. 2014. Reducing geosmin off-flavor compounds and waste outputs through dietary phosphorus management in rainbow trout aquaculture. Aquaculture Environment Interactions 6:105–17. doi:https://doi.org/10.3354/aei00119.
- Schmidt, L. J., M. P. Gaikowski, and W. H. Gingerich. 2006. Environmental assessment for the use of hydrogen peroxide in aquaculture for treating external fungal and bacterial diseases of cultured fish and fish eggs. USGS Report, 180 pp.
- Schrader, K. K., J. W. Davidson, A. M. Rimando, and S. T. Summerfelt. 2010. Evaluation of ozonation on levels of the off-flavor compounds geosmin and 2-methylisoborneol in water and rainbow trout Oncorhynchus mykiss from recirculating aquaculture systems. Aquacultural Engineering 43:46–50. doi:https://doi.org/10.1016/j.aquaeng.2010.05.003.
- Schrader, K. K., J. W. Davidson, and S. T. Summerfelt. 2013. Evaluation of the impact of nitrate-nitrogen levels in recirculating aquaculture systems on concentrations of the off-flavor compounds geosmin and 2-methylisoborneol in water and rainbow trout (Oncorhynchus mykiss). Aquacultural Engineering 57:126–30. doi:https://doi.org/10.1016/j.aquaeng.2013.07.002.
- Schrader, K. K., and S. T. Summerfelt. 2010. Distribution of off-flavor compounds and isolation of geosmin producing bacteria in a series of water recirculating systems for rainbow trout culture. North American Journal of Aquaculture 72:1–9. doi:https://doi.org/10.1577/A09-009.1N.
- Schreier, T. M., J. J. Rach, and G. E. Howe. 1996. Efficiency of formalin, hydrogen peroxide and sodium chloride on fungal-infected rainbow trout eggs. Aquaculture 140:323–31. doi:https://doi.org/10.1016/0044-8486(95)01182-X.
- Schwartz, M. F., G. L. Bullock, J. A. Hankins, S. T. Summerfelt, and J. A. Mathias. 2000. Effects of selected chemo-therapeutants on nitrification in fluidized-sand biofilters for cold water fish production. International Journal of Recirculating Aquaculture 1:61–81. doi:https://doi.org/10.21061/ijra.v1i1.1362.
- Smith, J. L., G. L. Boyer, and P. V. Zimba. 2008. A review of cyanobacterial odorous and bioactive metabolites: Impacts and management alternatives in aquaculture. Aquaculture 280:5–20. doi:https://doi.org/10.1016/j.aquaculture.2008.05.007.
- Straus, D. L., T. Meinelt, D. Liu, and L. F. Pedersen. 2018. Toxicity of peracetic acid to fish: Variation among species and impact of water chemistry. Journal of the World Aquaculture Society 49:715–40. doi:https://doi.org/10.1111/jwas.12475C.
- Summerfelt, S. T., M. J. Sharrer, S. M. Tsukuda, and M. Gearheart. 2009. Process requirements for achieving full-flow disinfection of recirculating water using ozonation and UV irradiation. Aquacultural Engineering 40:17–27. doi:https://doi.org/10.1016/j.aquaeng.2008.10.002.
- Suurnäkki, S., J. T. Pulkkinen, P. C. Lindholm-Lehto, M. Tiirola, and S. L. Aalto. 2020. The effect of peracetic acid on microbial community, water quality, nitrification and rainbow trout (Oncorhynchus mykiss) performance in recirculating aquaculture systems. Aquaculture 516:734534. doi:https://doi.org/10.1016/j.aquaculture.2019.734534.
- Tucker, C. S. 2000. Off-flavor problems in aquaculture. Reviews in Fisheries Science 8:45–88. doi:https://doi.org/10.1080/10641260091129170.
- Wang, R., D. Li, C. X. Jin, and B. W. Yang. 2015. Seasonal occurrence and species specificity of fishy and musty odor in Huajiang Reservoir in winter, China. Water Resources and Industry 11:13–26. doi:https://doi.org/10.1016/j.wri.2015.04.002.
- Watson, S. B. 2004. Aquatic taste and odor: A primary signal of drinking-water integrity. Journal of Toxicology and Environmental Health, Part A 67:1779–95. doi:https://doi.org/10.1080/15287390490492377.
- Westerhoff, P., B. Nalinakumari, and P. Pei. 2006. Kinetics of MIB and geosmin oxidation during ozonation. Ozone: Science & Engineering 28:277–86. doi:https://doi.org/10.1080/01919510600892836.
- Zimba, P. V., K. K. Schrader, G. Hyldig, B. W. Strobel, and N. O. G. Jørgensen. 2012. Evaluation of geosmin and 2-methylisoborneol off-flavour in smoked rainbow trout fillets using instrumental and sensory analyses. Aquaculture Research 43:149–53. doi:https://doi.org/10.1111/j.1365-2109.2011.02795.x.