?Mathematical formulae have been encoded as MathML and are displayed in this HTML version using MathJax in order to improve their display. Uncheck the box to turn MathJax off. This feature requires Javascript. Click on a formula to zoom.
ABSTRACT
This study is the first to investigate how an online course consisting solely of multiple-choice questions and detailed formative feedback compares to an online course format that was previously shown to be highly effective. Specifically, a pure question-based learning (pQBL) version of a course was compared to a question-based learning course (QBL) which consisted of the same questions and feedback as the pQBL course, but also included ordinary texts about the subject. To explore how pQBL and QBL compared in terms of learning outcomes and completion time, 492 employees at the Swedish Employment Agency were randomized to either a pQBL or a QBL version of a course about IT security. The results indicate that the pQBL course resulted in equally good or better learning outcomes compared to the QBL course. This result was robust to changes in how course quality was defined. In addition, participants completed the pQBL course slightly faster. Because a pQBL course requires less resources to produce, there are benefits to relying on the pQBL method when teachers or students have limited time. Further benefits that come with the flexibility of the pQBL method are discussed.
Why is saffron important in the Swedish Christmas tradition?
Fermented fish with saffron is a traditional Swedish Christmas food.
Saffron is used to color Swedish Christmas hats.
Saffron buns are eaten around Christmas.
If you select option 1, we can inform you that – Although it is correct that fermented fish is sometimes eaten in Sweden, it is usually not combined with saffron nor eaten during Christmas. If you select option 2, we can inform you that – Although yellow Christmas hats would be delightful, it is not part of the Swedish tradition. However, if you select option 3, we would confirm that – Correct! In Sweden, it is common to have S-shaped saffron buns around Christmas, called lussebulle or lussekatt.
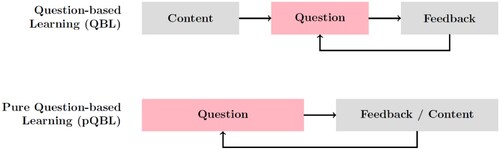
You have just learned about Swedish saffron buns by answering a question and then receiving feedback on your responses. We call this type of learning activity without prior studying of text, audio, or video: Pure Question-Based Learning (pQBL) (Bälter et al., Citation2024). This methodology is a further development of Question-Based Learning (QBL), in which the question above would have been preceded by a text on Swedish Christmas traditions. In many types of learning, it is common for students to first watch a presentation (live or video) or read a text and then answer questions about said presentation or text and later be assessed on it. Thus, pQBL differs from traditional learning, and QBL, in that it moves the initial, passive exposure to the to-be-learned information into the feedback of the questions, making the learning activity more active. The same principle can be used in classroom education, but the present study focuses on learning in online education.
The present research takes inspiration and builds upon, research about the doer effect (Koedinger et al., Citation2016). The doer effect is the finding that students learn more and faster when they study by doing interactive learning activities, such as answering multiple-choice questions (MCQ), compared to learning by more passive means, such as watching videos or reading texts (Koedinger et al., Citation2016). Many studies investigating the doer effect have interspersed learning material with auto-graded questions with constructive feedback to make students actively engage with the material. It is possible that this methodology could be improved further by making it even more activating by using pQBL. We illustrate the difference between QBL and pQBL in .
Figure 1. Comparison between Question-based Learning (QBL), and Pure Question-based Learning (pQBL) in terms of the sequencing of and focus on different learning activities.
We have previously investigated the effect of pQBL in a qualitative study (Bälter et al., Citation2024) and small proof-of-concept studies (Andraszek, Citation2023; Mannerfelt, Citation2022), with encouraging results. However, the effect of pQBL on learning at a large scale is still unknown.
Therefore, the goal of the present study is to compare the effects of QBL with pQBL on learning. More specifically, using an online experiment, we aimed to examine if QBL and pQBL differ in learning outcomes, course completion time, and a range of questions related to the course experience.
Active and passive learning activities
Chances are high that if you take an online course today, it will in large parts consist of texts, images, video lectures, and perhaps some quizzes. These courses may work fine, however, if they would lean more on active learning activities, they would likely be more beneficial to students’ long-term learning.
The Encyclopedia of the Sciences of Learning defines active learning as
instructional techniques that allow learners to participate in learning and teaching activities, to take the responsibility for their own learning, and to establish connections between ideas by analysing, synthesizing, and evaluating. […] The learner’s role is being involved in learning activities such as discussions, reviewing, and evaluating, concept mapping, role-playing, hands-on projects, and cooperative group studies to develop higher-order thinking skills such as analysis, synthesis, and evaluation. (Gogus, Citation2012, p. 77)
There is a body of research aimed at determining whether active learning is better than passive learning. The consensus seems to be that active is better than passive, but this is difficult to say in general terms. For instance, there are studies (Haidet et al., Citation2004) that observed no difference beyond reducing passive delivery of content by 50% (the other 50% being the active part; see also Bransford & Schwartz, Citation1999, for more similar results), there are other studies (see Table 1 in Michel et al., Citation2009) that only observed improvement in retention for active learning. There are other studies (see Table 1 in Michel et al., Citation2009) showing that students like active learning better, while other studies (Deslauriers et al., Citation2019) show that students perceive passive approaches as better for learning despite the active actually being better in that particular case.
Table 1. Results of varying the arbitrary boundary between poor and good skills.
There are even studies (Smith & Smith, Citation2015) making valid arguments for passive learning. However, the active methods used by Smith and Smith (Citation2015) are social: discussion forums and synchronous teaching sessions. However, as we will see, students can be active yet not interact with others. Question-based learning might be a better form of active learning for passive students, so that they can be active without social interaction.
We would like to highlight three tracks of research: First, one initiated by Székely (Citation1950), whether the students should try first or be told first. Second, a series of papers started by Koedinger et al. (Citation2015) treating active in its simplest form: just actively working with problems in the topic at hand. Third, the field of retrieval practice (Adesope et al., Citation2017) shows the benefit of practicing by retrieving information from memory.
Székely (Citation1950) let the learners try to solve a problem before they were taught how to solve the problem and found that this led to improvement in both performance and retention compared to teaching the students first and letting them try afterward. This has later been reproduced by other studies (Marton, Citation2015; see for instance Bransford & Schwartz, Citation1999). Further support for this comes from the research showing that being tested on the material before studying it can facilitate learning (Little & Bjork, Citation2011, Citation2016).
Koedinger et al. (Citation2015) studied the effect of certain active elements (solving problems with automated feedback, not social) compared to the passive elements (video lectures) of a large MOOC course. They concluded that “extra doing” (one standard deviation increase) was more than six times that of “extra watching or reading”. In a series of follow-up studies (Koedinger et al., Citation2016; Koedinger et al., Citation2018; van Campenhout et al., Citation2021) concluded that this is a causal relationship.
Numerous studies have shown that actively retrieving previously studied information from memory benefits long-term learning more than, more passively, re-studying the same information (Adesope et al., Citation2017; Carpenter, Citation2009; Rowland, Citation2014), presumably as a result of the increased mental effort associated with retrieving information from memory compared to reading. This increased effort may, in turn, lead to increased integration of the new information into memory (Carpenter, Citation2009; Rowland, Citation2014). Importantly, the positive effect of retrieval practice is large, and the benefits can be found not only following short answer tests but also MCQs (Adesope et al., Citation2017). This is important for the present study, as the methodology we use relies heavily on MCQs.
Question-based learning and pure question-based learning
The Open Learning Initiative (OLI) was established in 2002 at Carnegie Mellon University to advance teaching and learning through science. Since then, the organization has conducted extensive research in this area and achieved meaningful progress. Their work is built on established learning science principles and has been successful in closing achievement gaps and improving the performance of students in STEM fields who are traditionally underrepresented (Kaufman et al., Citation2013; Ryan et al., Citation2016; Yarnall et al., Citation2016). Two of the most impressive results are a halving in learning time (Lovett et al., Citation2008) and that this type of learning is six times more efficient than reading and watching videos (Koedinger et al., Citation2016).
In the present study, we use the OLI methodology as well as their online courseware, but to separate the methodology from the project, we use the term Question-Based Learning to refer to their pedagogical method. At the core of QBL courses are questions (activities) organized into skills, with response-dependent constructive feedback. From a student’s point of view, the course material looks like an interactive textbook with questions and other activities interspersed with the learning material. However, it requires resources to create this kind of high-quality instructional content. In comparison, pQBL only use the question and feedback part of the QBL methodology. More specifically, pQBL has been defined as Learning material that consists solely of questions with constructive formative feedback (Bälter et al., Citation2024). Therefore, using pQBL could have the added benefits of both fully utilizing the doer effect as well as reducing the amount of learning material that has to be created.
Research question
RQ: Do QBL and pQBL differ in terms of learning outcomes, course completion time, and learner experience?
As we are comparing the new pQBL method with the previously demonstrated effectiveness of QBL, we do not expect dramatic differences in learning gains. The traditional QBL method has the advantage that students are familiar with the concept (read first, then answer questions on the reading material). A pQBL course consists of only questions. These may be perceived as a test, which might stress some learners and reduce performance. On the other hand, pQBL may offer time savings when producing learning material, and less time is spent on passive reading, which gives more time to answer questions. If pQBL turns out to be on par with QBL, there are several interesting opportunities that open up as each question in pQBL is self-contained, and courses could be tailored much easier. One example would be to change the course format entirely and, for example, create a course that consists of a daily email with one question.
Methods
Design and participants
The study used a between-subject design. Specifically, employees at the Swedish Employment Agency were randomized into taking either a QBL version or a pQBL version of a course about IT security. In total, 492 employees participated in the online experiment, 234 in the QBL condition and 258 in the pQBL condition. The participants completed the courses as part of the Agency’s continuing education of their employees, and only data from employees who consented to share their data for the purpose of research was included in the study. The courses were created and run using Carnegie Mellon University’s Open Learning Initiative courseware Torus, and were offered through the learning management system Canvas internally at the Agency.
Material
Participants were randomized to one of two versions of the IT security course. Independent of condition (i.e. QBL or pQBL version), the participants were exposed to the same information. The aim was that the courses should take approximately 2 hours to complete. However, because the study was self-paced, we could not control this. The course content was inspired by IT security competence in the European Union’s digital competence framework DigComp 2.1 (Carretero et al., Citation2018; Punie et al., Citation2013). Based on this competence we defined 25 skills, for example: “knowing how to detect phishing emails”.
One-hundred multiple-choice questions
In the courses, each skill was covered in 4 MCQs, resulting in a total of 100 MCQs. The reason for only using 4 questions, was that we estimated that the participants would only have time to complete 100 questions in two hours that the Swedish Employment Agency had allocated for the course. Each MCQ consisted of three elements: the question itself, response alternatives (1 correct and 3 distractors), and unique constructive feedback for each response. The questions were constructed to be easy to understand, and the responses were made with the intention that none of the alternatives should be obviously correct or incorrect. The feedback to the correct responses informed the participant that the alternative was correct while also informing them why it was correct. Feedback to distractors explained why the response was incorrect without providing the correct answer. For an example, see the Appendix Example question with feedback.
Course structure
The QBL and pQBL courses were largely the same. The only difference was that the QBL course included texts about the to-be-learned material above the MCQ questions, whereas the pQBL course only had the MCQ questions. The courses consisted of 23 sequentially organized pages. The first page was an onboarding page informing the participant that the course used question-based learning and that the questions were not exams but a way to learn. It also informed them that question-based learning can sometimes feel effortful, but that this extra effort aids learning, and because of the extra effort, they should consider not doing the whole course in one go and instead doing it in shorter sessions. The onboarding page was followed by 18 pages with the learning material. The pages included a heading indicating the topic of the page and the MCQ questions related to the skills covered on the page. The questions were always in the same order on the page. In the QBL version of the course, participants could first read a text about the information covered in the questions. On 14 pages, only one skill was covered. For the remaining 4 pages, more than one skill was covered because the skills were closely related (e.g. different aspects of phishing). On these pages, the texts and questions related to each skill were kept separate by presenting one skill with questions and then another. After the 18 learning pages, there was a page with a questionnaire (see below), a page with information about the final test, and then a page with the final test itself (see below). The course ended with a page informing the participants that the course was finished.
Responding to the multiple-choice questions
Participants could respond to the questions as many times as they wanted, even after selecting the correct response. The order of the response alternatives was randomized for each MCQ and participant. Furthermore, when a question was answered, the order of the alternatives was randomized for that question again.
Navigating the course
Participants navigated the course using either an overview page where they could view the names of all pages in sequential order or by going from one page to the next or the previous page using arrow buttons at the bottom of each page. Technically, participants could go to any page at any time and even start the course by doing the final test. However, most likely, participants completed the pages in sequential order, from beginning to end.
Questionnaire
On the page after the learning pages, participants were given a questionnaire with 13 items related to their course experience. The items and scales below are translations from Swedish.
The first 8 items were answered on a scale ranging from 1 to 5, where the scale ends were marked completely disagree (1) and completely agree (5):
I understood the instructions.
I like internet-based learning.
The course was informative.
The questions were of appropriate difficulty.
The feedback in the questions was helpful.
The fact that the course was question-based helped me learn the material.
The fact that the course was question-based motivated me.
If I take an online course in the future, I hope it is question-based.
The following 4 questions were answered on a scale consisting of a 5-step scale consisting of the words: Never, Rarely, Sometimes, Often, and Always.
I looked for the correct answer (e.g. on the internet) before answering the questions.
I tried my best to answer the questions correctly on the first try.
After answering a question correctly, I continued to click on incorrect answers to get more feedback.
How often did you feel frustrated during the course?
In the last question, participants estimated how long it took them to complete the course (in minutes).
Approximately how long did it take you to complete the course? Answer in minutes.
Final test
The final test consisted of the first question related to each of the 25 skills. That is, of the 4 MCQs related to each skill, the uppermost on the skill’s page was repeated during the final test. On the final test, participants could only respond to each question 1 time and only received feedback about their responses after completing the test. There was no time limit on the test. Participants responded by selecting an option for each question and clicking “submit answers” below the final question. The order of the questions and the order of the response alternatives were randomized for each participant. The final test looked similar to the learning pages, and as such, participants could likely complete it without any instructions. Nevertheless, participants were informed how to complete the test.
Procedure
Before starting the IT security course, all participants had completed a 30-minute screening of their digital competence. This screening was given to all employees at the Swedish Employment Agency, and anyone whose screening indicated they could benefit from a course about IT security was recommended to take the course. However, the course was open to any employee regardless of what the screening test recommended. Before starting the course, all employees could accept or decline to share their data with this study, and independent of their selection, they could proceed to the course. Thereafter, participants took the course at their own pace whenever they wanted and had the time. Participants could return to the course after finishing it, but the final test could not be completed more than once.
Data analysis
The mathematical details of the data analysis are discussed in detail in Appendix Data analysis. To understand the main body of the article, it is necessary to understand the following: We define the quality Qi of version i of a learning module as the probability that a participant who showed poor skills in the learning module itself went on to show good skills in the final test. We consider a participant to have poor initial skills if they answered less than 50% of the questions correctly on the first try, and good final skills if they answered more than 80% of the test questions correctly. Given our estimates of the qualities for the learning module, we estimate the difference D in quality between the versions and calculate the probability that it differs by more than 0.1, this being the smallest difference that we believe is of any practical significance.
Time spent on learning modules
We asked the participants to estimate the time they spent on the learning modules. In addition to that, we attempt to derive our own estimates. We assume that the time spent is the time interval between the first and final answer – except where the individual timestamps on the answers show that the user has been inactive for more than 5 minutes. In that case, we assume that the participant had left the computer for a coffee/bathroom break and assume only 5 min were actually spent on the question.
Results
Course quality
We estimate the quality of the QBL and pQBL versions of the course using the procedure described in the Data analysis section. We find that in the QBL group, there are 26 participants with initially poor skills of which 7 eventually acquire good skills. In the pQBL group there are 90 members with initially poor skills of which 32 acquire good skills. Based on this, we find that the probability is 55% that the pQBL version is practically significantly better and 40% that there is no practically significant difference, leaving only a 4% probability that the pQBL is practically significantly worse. illustrates the probability distribution over D.
Figure 2. The probability distribution d(D) over the difference in quality D between the two versions of the learning module. The dashed lines denote the bounds of what difference we consider to be of practical significance.
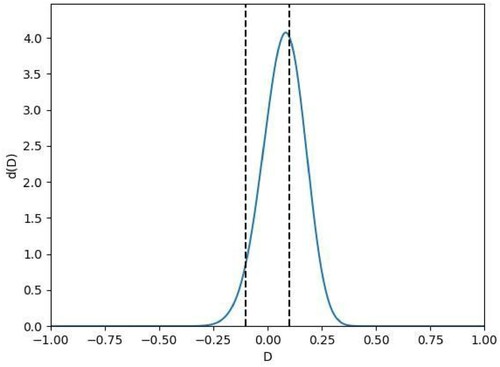
The number of participants considered to have started out with poor results is quite small in the group given QBL. We believe that this is an artifact of the fact that our estimate of their initial skill is not actually based on the skill they had before starting on the course, but on the skill they displayed on the first question. At that point, the QBL group had already received some information that the pQBL group had not. To test the robustness of our results, we tried varying the boundaries defining poor and good skills from those above – which we had defined prior to starting the study. For simplicity, we set a single boundary such that all below it are considered to have poor skills and all above have good skills. The results are shown below in . Based on this, our results seem to be robust to changes in the boundary. While the probability estimates vary between favoring the hypotheses of pQBL being better and there being no practically significant difference, they never favor QBL.
Questionnaire answers
When answering the questionnaire described in Questionnaire section in the Appendix, there were no notable differences between the two groups of participants. The responses to the individual questions are shown in the Appendix.
Time consumption
Using the two procedures described in Questionnaire section in the Appendix, we get very similar results. Using the participants’ own estimates, they spent, on average 90 minutes on the QBL version of the module and 80 minutes on the pQBL version. Using our own estimates, they spent, on average 98 minutes on the QBL version of the module and 83 minutes on the pQBL version. In both cases, the course took about an hour and a half, but the pQBL version was slightly faster. Histograms are shown in Appendix Questionnaire responses.
Discussion
The goal of the study was to investigate differences between QBL and pQBL, using two versions of an online course about IT security. More specifically, using an online experiment, we aimed to examine if QBL and pQBL differ in terms of learning outcomes and course completion time, and a range of questions related to the course experience.
The results of the study show that using a pQBL method will most likely result in equal or better learning gains compared to a QBL course, and it is unlikely that a QBL course will be better. Furthermore, the results indicate that there were no important differences in terms of how students experience taking the courses. However, the results indicate that a pQBL is faster to complete. Specifically, in the present study, the participants in the pQBL condition completed the course, on average, 15% quicker (11% if going by participants’ own time estimates) than in the QBL condition.
These results favor the use of a pQBL design for online courses for three reasons. First and foremost, although the time difference was fairly small, the 15% time difference could be important for a longer course.
Second, for the pQBL course, the constructors only had to create the questions instead of creating both questions and other learning material. As creating online courses can be a resource-demanding activity, saving time (and money) while not losing any learning gains is an important factor in producing high-quality online courses. Thus, in environments with limited time, both for course constructors and students, pQBL seems to be a superior option over QBL.
As can be seen in Figures A1–A14 in the Questionnaire responses in the Appendix, there were no meaningful differences on any of the items in the questionnaire except the question about completion time (see the questions in the Questionnaire section of the method). In other words, the participants behaved similarly, were equally positive about online learning and learning by answering questions with feedback, experienced that they learned a lot, and were equally motivated, independent of the course version. The additional texts in the QBL version did not add anything important to the participants’ learning experience, another reason not to waste resources on developing them in the first place.
Furthermore, this study was explorative and did not directly test any hypotheses related to the doer effect (Koedinger et al., Citation2016), pretesting (Little & Bjork, Citation2016), or retrieval practice (Adesope et al., Citation2017). Nevertheless, indirectly, the study supports the general idea that students benefit from moving from more passive forms of learning, such as reading texts, to more active forms of learning, like learning with the help of MCQs with feedback. That is, although participants in the QBL course likely repeated the material more times by first reading about the topics and then answering questions about them, it did not help them learn more than only answering the questions.
However, in a situation where students’ level of understanding is low in relation to the level of a course, that is, the course is at the further end of the zone of proximal development (Vygotsky, Citation1978), you could argue that the pQBL method might require more self-motivation and that the students guess more, compared to QBL. On the other hand, that is generally not how a course should be designed. It should start at the nearer end of the zone and move further as the learners develop with the learning material.
Furthermore, the course was short, taking approximately 1.5 hours to complete, and the subject of IT security was fairly concrete and straightforward. It is possible that learning from MCQs with feedback is not an optimal form of learning when the learning goals focus on higher-order cognitive skills, such as evaluation or creation of novel material (Anderson & Krathwohl, Citation2001). However, neither are more passive forms of learning, such as reading longer texts. Thus, we still believe pQBL would fare equally well in teaching these skills as QBL. However, it is still possible that higher-order cognitive skills could be taught effectively using pQBL, and future research should investigate this.
Conclusions
The present study is the first to show that a course based on pure question-based learning can be as effective, or better, than a course consisting of both texts and questions. Furthermore, pQBL courses take less time to produce for teachers and less time to consume for the students. Thus, our study indicates that pQBL may be an effective method of conducting online course development that can benefit both teachers and students.
During this project, we observed that pQBL may have interesting benefits that are not directly related to learning outcomes. Namely, as each pQBL question becomes independent of the learning environment, pQBL material can be sliced and reorganized in ways that traditional learning material cannot.
Besides the added flexibility, the method also allows educators to take advantage of ordering effects that are beneficial to long-term learning. For example, the spacing effect can be made use of by spacing questions related to one skill over multiple different sessions/pages during a course (Cepeda et al., Citation2006). Furthermore, to use the positive effect of interleaving (Taylor & Rohrer, Citation2010). For example, by mixing questions related to one skill with questions teaching similar, closely related skills. To exemplify, in the pQBL course in the present study, instead of presenting all four questions related to each skill on the same page, each question could be presented on separate pages together with questions on other skills. Being able to easily take advantage of the spacing and interleaving effects as a course creator could have large positive effects on students’ learning. This study will hopefully inspire more research investigating when and how this promising method of constructing online learning material can be used for the best effect.
Open data statement
Due to the Russian full-scale invasion of Ukraine, the Swedish Employment Agency was in October 2022 upgraded to the status of “beredskapsmyndighet”, meaning that they are considered important to Swedish national defense. As such, they are very restrictive with making public any information about their staff. Because of that, we are not permitted to share the raw data that this study is based on.
Ethics statement
The research does not fall within the scope of the Swedish Ethical Review Act since it does not involve any processing of sensitive personal data or put any participants at risk. Accordingly, the research has not been reviewed by the Swedish Ethical Review Authority. The research has followed established research praxis principles, such as The European Code of Conduct for Research Integrity (ALLEA).
Disclosure statement
No potential conflict of interest was reported by the author(s).
Additional information
Funding
Notes on contributors
Andreas Jemstedt
Andreas Jemstedt is a senior lecturer at the Department of Education at Stockholm University, Stockholm, Sweden. His research interests include effective online course design, metacognition, and self-regulated learning. Jemstedt received his Ph.D. in Psychology from Stockholm University in 2018.
Olle Bälter
Olle Bälter is an Associate Professor in Human–Computer Interaction, Ph.D. in Computer Science. He is one of the two heads of the research group for Technology Enhanced Learning at KTH Royal Institute of Technology, Stockholm, Sweden. His research interests include effective online course design, learning analytics, and question-based learning. Olle was awarded his Ph.D. in Computer Science at KTH Royal Institute of Technology in 1998.
Alvin Gavel
Alvin Gavel is currently a bibliometric analyst at Karolinska Institutet Library, Stockholm, Sweden. His research interests all revolve around statistical analysis. He received his Ph.D. in astronomy from Uppsala University, Uppsala, Sweden.
Richard Glassey
Richard Glassey is a teacher at KTH Royal Institute of Technology, Stockholm, Sweden. His current research interests include computer science education, learning analytics, and sustainable education. Glassey received his Ph.D. in computer science from the University of Strathclyde, Glasgow, Scotland. He is a member of ACM.
Daniel Bosk
Daniel Bosk is Lecturer of Computer Science at KTH Royal Institute of Technology, Stockholm, Sweden. His research interests are in technology enhanced learning and e-learning, as well as in security and privacy with a focus on democracy enhancing technologies.
Notes
1 Since QBL requires the participant to keep answering until they find the correct answer, we will use ‘answer correctly’ as a shorthand for answering correctly on the first try.
References
- Adesope, O. O., Trevisan, D. A., & Sundararajan, N. (2017). Rethinking the use of tests: A meta-analysis of practice testing. Review of Educational Research, 87(3), 659–701. https://doi.org/10.3102/0034654316689306
- Anderson, L. W., & Krathwohl, D. R. (2001). A taxonomy for learning, teaching, and assessing: A revision of Bloom’s taxonomy of educational objectives : complete edition. Addison Wesley Longman, Inc. https://eduq.info/xmlui/handle/11515/18824.
- Andraszek, D. (2023). Enhancing learning outcomes with pure question-based learning : A study on the effectiveness of the method in a Primary School Environment (Dissertation). https://urn.kb.se/resolve?urn=urn:nbn:se:kth:diva-337054.
- Bälter, O., Glassey, R., Jemstedt, A., Bosk, D., & Viberg, O. (2024). Pure question-based learning. Manuscript submitted for publication.
- Bransford, J. D., & Schwartz, D. L. (1999). Chapter 3: Rethinking transfer: A simple proposal with multiple implications. Review of Research in Education, 24(1), 61–100. https://doi.org/10.3102/0091732X024001061
- Carpenter, S. K. (2009). Cue strength as a moderator of the testing effect: The benefits of elaborative retrieval. Journal of Experimental Psychology. Learning, Memory, and Cognition, 35(6), 1563–1569. https://doi.org/10.1037/a0017021
- European Commission, Joint Research Centre, Carretero, S., Vuorikari, R., & Punie, Y. (2018). Digcomp 2.1: The digital competence framework for citizens with eight proficiency levels and examples of use. Publications Office. https://doi.org/10.2760/38842
- Cepeda, N. J., Pashler, H., Vul, E., Wixted, J. T., & Rohrer, D. (2006). Distributed practice in verbal recall tasks: A review and quantitative synthesis. Psychological Bulletin, 132(3), 354–380. https://doi.org/10.1037/0033-2909.132.3.354
- Chacon, S., & Straub, B. (2014). Pro git. Apress.
- Deslauriers, L., McCarty, L. S., Miller, K., Callaghan, K., & Kestin, G. (2019). Measuring actual learning versus feeling of learning in response to being actively engaged in the classroom. Proceedings of the National Academy of Sciences, 116(39), 19251–19257. https://doi.org/10.1073/pnas.1821936116
- Gelman, A., & Loken, E. (2014). The statistical crisis in science. American Scientist, 102(6), 460. https://doi.org/10.1511/2014.111.460
- Gogus, A. (2012). Active learning. In N. M. Seel (Ed.), Encyclopedia of the sciences of learning (pp. 77–80). Springer US. https://doi.org/10.1007/978-1-4419-1428-6_489
- Goodman, W. M., Spruill, S. E., & Komaroff, E. (2019). A proposed hybrid effect size plus p-value criterion: Empirical evidence supporting its use. The American Statistician, 73(sup1), 168–185. https://doi.org/10.1080/00031305.2018.1564697
- Haidet, P., Morgan, R. O., O’malley, K., Moran, B. J., & Richards, B. F. (2004). A controlled trial of active versus passive learning strategies in a large group setting. Advances in Health Sciences Education, 9(1), 15–27. https://doi.org/10.1023/B:AHSE.0000012213.62043.45
- Harris, C. R., Millman, K. J., van der Walt, S. J., Gommers, R., Virtanen, P., Cournapeau, D., Wieser, E., Taylor, J., Berg, S., Smith, N. J., Kern, R., Picus, M., Hoyer, S., van Kerkwijk, M. H., Brett, M., Haldane, A., del R´ıo, J. F., Wiebe, M., Peterson, P., … Oliphant, T. E. (2020). Array programming with NumPy. Nature, 585(7825), 357–362. https://doi.org/10.1038/s41586-020-2649-2
- Hunter, J. D. (2007). Matplotlib: A 2d graphics environment. Computing in Science & Engineering, 9(3), 90–95. https://doi.org/10.1109/MCSE.2007.55
- Kaufman, J., Ryan, R., Thille, C., & Bier, N. (2013). Open learning initiative courses in community colleges: Evidence on use and effectiveness. Mellon University. https://hewlett.org/wp-content/uploads/2013/12/CCOLI_Report_Final_1.pdf.
- Koedinger, K. R., Kim, J., Jia, J. Z., McLaughlin, E. A., & Bier, N. L. (2015). Learning is not a spectator sport: Doing is better than watching for learning from a MOOC. Proceedings of the Second (2015) ACM Conference on Learning @ Scale (pp. 111–120). https://doi.org/10.1145/2724660.2724681.
- Koedinger, K. R., McLaughlin, E. A., Jia, J. Z., & Bier, N. L. (2016). Is the doer effect a causal relationship? How can we tell and why it’s important. Proceedings of the sixth international conference on learning analytics & knowledge (pp. 388–397). https://doi.org/10.1145/2883851.2883957
- Koedinger, K., Scheines, R., & Schaldenbrand, P. (2018, July 1). Is the doer effect robust across multiple data sets? Educational Data Mining. https://www.semanticscholar.org/paper/Is-the-Doer-Effect-Robust-Across-Multiple-Data-Sets-Koedinger-Scheines/dca7fb177fe4e5d8cc796b6fedd3967b88c4f851.
- Little, J., & Bjork, E. (2011). Pretesting with multiple-choice questions facilitates learning. Proceedings of the Annual Meeting of the Cognitive Science Society. Presentation at Cognitive Science Society, Boston, MA, USA. https://www.researchgate.net/publication/265883438_Pretesting_with_Multiple-choice_Questions_Facilitates_Learning.
- Little, J., & Bjork, E. (2016). Multiple-choice pretesting potentiates learning of related information. Memory & Cognition, 44(7), 1085–1101. https://doi.org/10.3758/s13421-016-0621-z
- Lovett, M., Meyer, O., & Thille, C. (2008). The open learning initiative: Measuring the effectiveness of the OLI statistics course in accelerating student learning. Journal of Interactive Media in Education, 2008(1), Art. 13. https://doi.org/10.5334/2008-14
- Mannerfelt, S. (2022). Rent frågebaserat lärande som metod i utbildningsmaterial (Master’s thesis). KTH Royal Institute of Technology.
- Marton, F. (2015). Necessary conditions of learning. Routledge.
- McKinney, W. (2010). Data structures for statistical computing in python. In S. van der Walt & J. Millman (Eds.), Proceedings of the 9th Python in science conference (pp. 56–61). https://doi.org/10.25080/Majora-92bf1922-00a
- Michel, N., Cater III, J. J., & Varela, O. (2009). Active versus passive teaching styles: An empirical study of student learning outcomes. Human Resource Development Quarterly, 20(4), 397–418. https://doi.org/10.1002/hrdq.20025
- Pérez, F., & Granger, B. E. (2007). IPython: A system for interactive scientific computing. Computing in Science & Engineering, 9(3), 21–29. https://doi.org/10.1109/MCSE.2007.53
- Joint Research Centre, Institute for Prospective Technological Studies, Punie, Y., Ferrari, A., & Brečko, B. (2013). DIGCOMP : a framework for developing and understanding digital competence in Europe (Y. Punie & B. Brečko, Eds.). Publications Office. https://doi.org/10.2788/52966
- Rowland, C. A. (2014). The effect of testing versus restudy on retention: A meta-analytic review of the testing effect. Psychological Bulletin, 140(6), 1432–1463. https://doi.org/10.1037/a0037559
- Ryan, S., Kaufman, J., Greenhouse, J., She, R., & Shi, J. (2016). The effectiveness of blended online learning courses at the community college level. Community College Journal of Research and Practice, 40(4), 285–298. https://doi.org/10.1080/10668926.2015.1044584
- Smith, D., & Smith, K. (2015). Case for ‘passive’ learning – The ‘silent’ community of online learners. European Journal of Open, Distance and E-Learning, 17(2), 86–99. https://doi.org/10.2478/eurodl-2014-0021
- Székely, L. (1950). Productive processes in learning and thinking. Acta Psychologica, 7, 388–407. https://doi.org/10.1016/0001-6918(50)90026-6
- Taylor, K., & Rohrer, D. (2010). The effects of interleaved practice. Applied Cognitive Psychology, 24(6), 837–848. https://doi.org/10.1002/acp.1598
- van Campenhout, R., Johnson, B., & Olsen, J. (2021). The doer effect: Replicating findings that doing causes learning. Proceedings of the 13th International Conference on Mobile, Hybrid, and On-line Learning. IARIA, France (pp. 1–6).
- Van Rossum, G., & Drake, F. L. (2009). Python 3 reference manual. CreateSpace.
- Virtanen, P., Gommers, R., Oliphant, T. E., Haberland, M., Reddy, T., Cournapeau, D., Burovski, E., Peterson, P., Weckesser, W., Bright, J., van der Walt, S. J., Brett, M., Wilson, J., Millman, K. J., Mayorov, N., Nelson, A. R. J., Jones, E., Kern, R., Larson, E., … SciPy 1.0 Contributors (2020). Scipy 1.0: Fundamental algorithms for scientific computing in Python. Nature Methods, 17(3), 261–272. https://doi.org/10.1038/s41592-019-0686-2
- Vygotsky, L. S. (1978). Interaction between learning and development. In M. Cole, V. Jolm-Steiner, S. Scribner, & E. Souberman (Eds.), Mind in society (pp. 79–91). Harvard University Press; JSTOR. https://doi.org/10.2307/j.ctvjf9vz4.11
- Yarnall, L., Means, B., & Wetzel, T. (2016). Lessons Learned From Early Implementations of Adaptive Courseware. SRI International.
Appendix
Example question with feedback
The following question was used to teach the participants about detecting phishing emails (translated from Swedish):
You have received an email from a trusted sender warning you of suspicious activity on your account. They are urging you to click on a link to reset your password. Which of the following options is most effective in determining whether the email is malicious?
Two of the four response alternatives were these:
“Contact the sender by phone and verify that the email is legitimate”
“Look at the email address the message was sent from, not just the sender’s name”.
If the participant selected the first option, they are informed that:
Even though it is true that it is a possible way to detect phishing, it is not an effective alternative. Constantly calling the sender can take a lot of time and be disruptive. Sometimes it is not even possible to contact the sender. One of the other alternatives is a more efficient way to detect phishing.
Correct! A good way to detect phishing is to verify that the email address the message is coming from is legitimate. Specifically, check that the domain name is correct, which is the part of the address after the @ symbol. There are many ways to make a fake address appear legitimate, but it is common for one or more letters in the address to be swapped or for extra words to be added to the domain name. For example, @arbetsformedilngen.se or @arbetsformedlingen.svar.se instead of @arbetsformedlingen.se.
Data analysis
The objective of our statistical analysis is to find out whether one pedagogical approach is better than another, and whether the differences are significant in the sense that this is useful to know for a person designing courses similar to ours. We performed two separate tests to do this. The first test looks at what we believe is the best measure of the effectiveness of a pedagogical approach, and is the one discussed in the main article. We defer discussion of the second test to Section 14.2 Alternate definition of Q as it is intended mostly for comparison: If the tests give clearly discrepant results, that is evidence of problems in our analysis. Even if they qualitatively agree, the quantitative disagreement can give us a rough idea of how robust our conclusions are to the choice between two reasonable ways of doing the analysis. This often-overlooked source of uncertainty is discussed in more detail in Gelman & Loken (Citation2014).
For our primary measure of quality the results of interest are the number of questions that a participant answered correctlyFootnote1, in the learning module and on the test. We define the quality Q to be the probability that a participant who got less than rlow correct answers in the learning module will get more than rhigh correct answers on the test. The reason why we choose two levels rather than a single boundary is that this would risk optimizing our courses for lifting participants from just below to just above the boundary – a change which is not necessarily of any practical importance. This way, we look at participants that are clearly in need of improvement, and consider the course to have been effective only for those who are clearly competent afterwards.
When comparing two pedagogical approaches a and b we estimate the difference in quality D = Qa − Qb. However, we do not simply estimate the probability of D being positive, since a positive D could still easily be too small to be of any practical interest. Instead, we define a practical significance level Dsig. and look at the probability that D > Dsig.. The use of practical significance levels is discussed in more detail in Goodman et al. (Citation2019).
Mathematical implementation
Assume that a learning module with pedagogical approach i is given to a group of participants out of which ni get results below rlow in the learning module and out of these ki end up getting results above rhigh on the test. We estimate Qi from this data using a Bayesian approach. This means that the probability distribution qi over the parameter Qi is given by the likelihood for Qi given the observations, multiplied by the prior probability for Qi, divided by the prior probability for the observation ki:
(A1)
(A1) While P (ki|ni) has a formal interpretation, we can treat it as simply a normalisation factor for the probability distribution.
In our case, the likelihood is given by a binomial distribution that has the quality Qi as a parameter.
(A2)
(A2) For simplicity, we assume that Qi has a prior which is uniform in the open interval [0,1]. We leave out the endpoints since we do not believe a pedagogical approach can be so good that it is guaranteed to succeed with every imaginable student, nor so bad as to fail with everyone.
(A3)
(A3) Inserting (2) into (1) and normalizing gives us:
(A4)
(A4) Where
(A5)
(A5) This expression is not defined at exactly Qi = 0 in the case that ki = 0, nor at Qi = 1 when ni − ki = 0. However, we do not need to worry about these edge cases since we in any case assume that Qi is strictly larger than zero and strictly smaller than one.
Given this, we can calculate qi for every pedagogical approach that we try. When comparing two approaches a and b, we will look at the difference in quality D. This follows a probability distribution d which is given by the convolution of qa (Q) and qb (−Q). This allows us to calculate the probability that a is better than b to a practically significant extent as:
(A6)
(A6) Analogously, the probability that b is better than a is given by:
(A7)
(A7) Finally, the probability that the quality does not differ to any practically significant extent is given by:
(A8)
(A8)
Adopted parameter values
This method requires setting values for the parameters rlow, rhigh and Dsig. What values are appropriate is not in itself a scientific question. It is an engineering question that has to be based on professional judgement of how much a course has to achieve to be worth the investment in time and money, and how much a change in a course has to improve it to be worth the bother. Based on the demands in our specific case, we adopt the values:
(A9)
(A9)
(A10)
(A10)
(A11)
(A11)
Alternate definition of Q
As described in Section 5.4, we compare the results in the main body of our article to those for a second measure of quality and check that our conclusions still hold up. As our second measure, Qmed, we pick the probability that a participant given one pedagogical approach will have better results than the median participant for both approaches together. One drawback of this choice is that it does not permit us to talk about the quality of a pedagogical approach in isolation – the quality is only defined with respect to a comparison with a specific other approach.
This measure also requires a more complicated definition of the results r for a participant, since we need to rank all participants by their results instead of simply comparing them to two thresholds. In this ranking, we start by looking at the answers they give on the final test. If one participant gets more correct answers than another, then that participant is considered to have a better result.
Mathematically, this is very similar to the analysis in Section Mathematical implementation. We still have a binomial variable, but this time it describes whether any participant did better than the median, rather than whether a participant starting with results below rlow moved above rhigh. In the end, we get a distribution over the quality given by:
(A12)
(A12) where Ni is the number of participants given pedagogical approach i, and Ki is the number of them that did better than the median over all pedagogical approaches. The probability of any approach, or none, being significantly superior is again given by Eqs. (A6)–(A8). Arbitrarily, we choose a module to be practically significantly better if it has a probability 0.1 higher of moving a participant above the shared median.
Applying this alternate measure to our data, we instead find a 94% probability that the two versions are about equally good, and a 6% probability that pQBL does practically significantly worse. In other words, our conclusions seem to be robust to different choices of analysis method.
Software tools used
The code used for the analysis was written in Python 3 (Van Rossum & Drake, Citation2009). The code was run interactively using IPython (Pérez & Granger, Citation2007). The scientific analysis makes use of the libraries SciPy, NumPy and Matplotlib (Harris et al., Citation2020; Hunter, Citation2007; Virtanen et al., Citation2020). Some preprocessing to convert data between different file formats made use of the library Pandas (McKinney, Citation2010). The code was developed using the version control system git (Chacon & Straub, Citation2014). The code can be found in the GitHub repository https://github.com/Alvin-Gavel/Demodigi.
Questionnaire responses
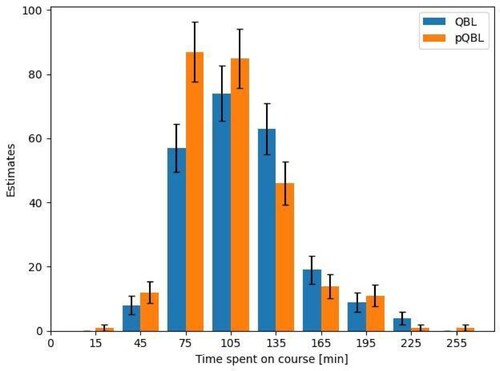
As described in Section Questionnaire the participants were given a questionnaire to estimate their satisfaction with the course. Figures A1–A14 show the frequencies for each response to the questions, for QBL and pQBL. For comparison with Figure A13, which shows the participants’ own estimates of the time spent on the course, Figure A14 shows our estimates, made with the method described in Section Time spent on learning modules.
Figure A1. Frequencies for the possible answers to the question “I understood the instructions”.
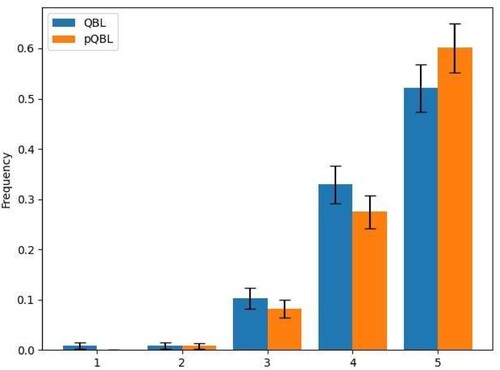
Figure A2. Frequencies for the possible answers to the question “I like internet-based learning”.
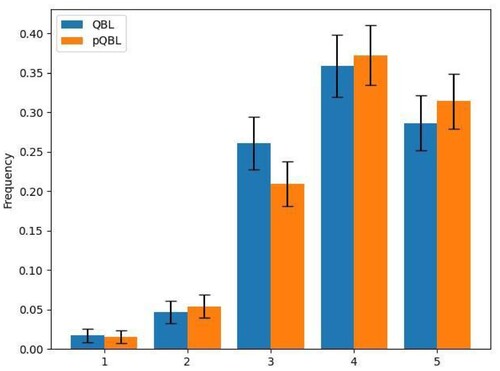
Figure A3. Frequencies for the possible answers to the question “The course was informative”.
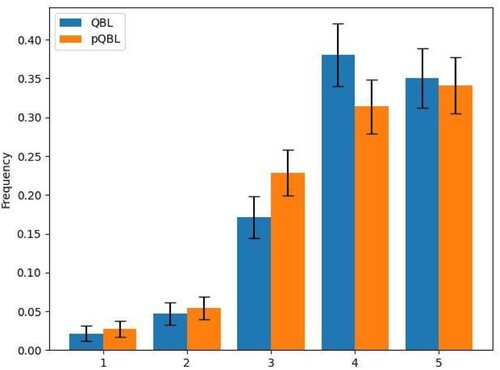
Figure A4. Frequencies for the possible answers to the question “The questions were of appropriate difficulty”.
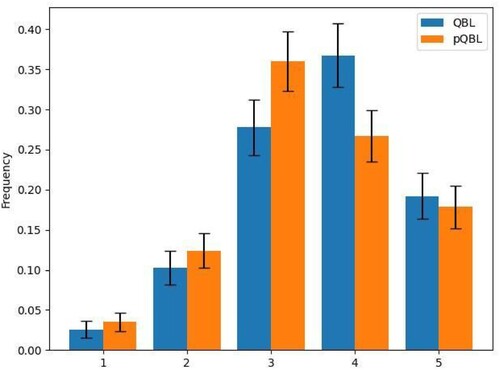
Figure A5. Frequencies for the possible answers to the question “The feedback in the questions was helpful”.
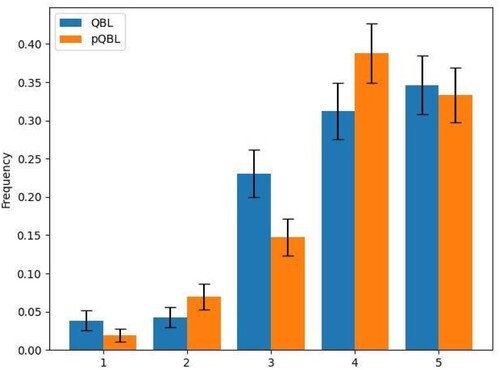
Figure A6. Frequencies for the possible answers to the question “The fact that the course was question-based helped me learn the material”.
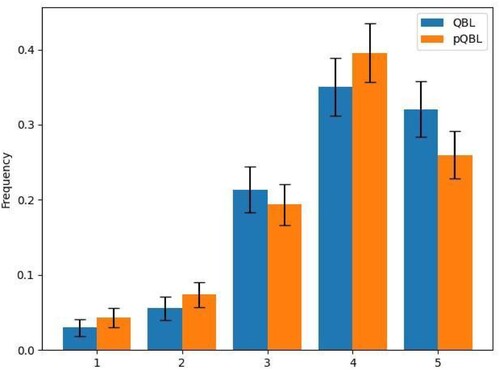
Figure A7. Frequencies for the possible answers to the question “The fact that the course was question-based motivated me”.
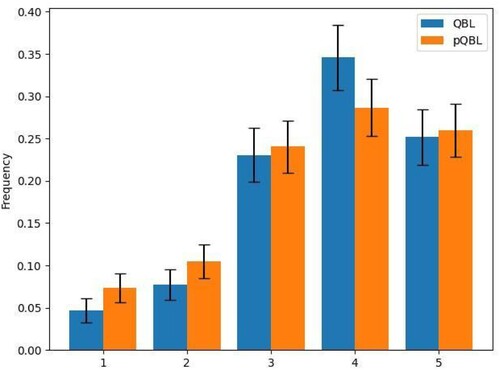
Figure A8. Frequencies for the possible answers to the question “If I take an online course in the future, I hope it is question-based”.
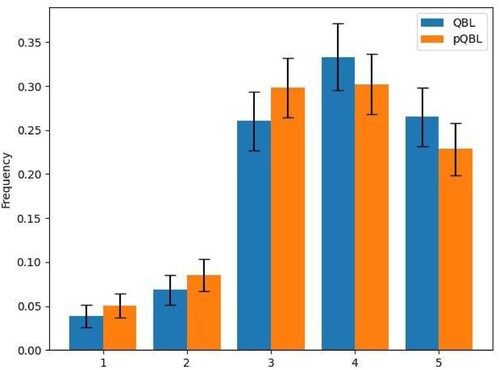
Figure A9. Frequencies for the possible answers to the question “I looked for the correct answer (e.g. on the internet) before answering the questions”.
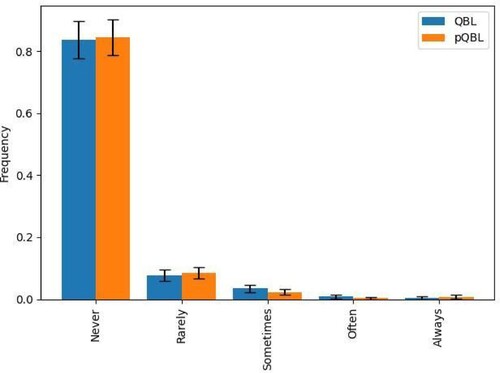
Figure A10. Frequencies for the possible answers to the question “I tried my best to answer the questions correctly on the first try”.
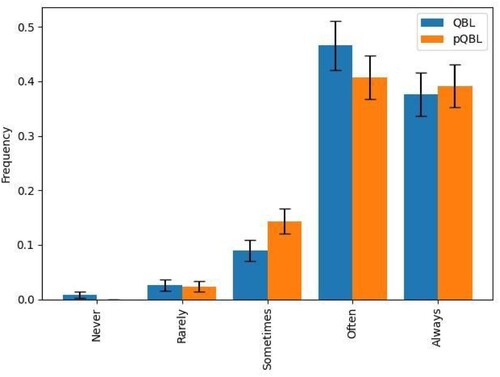
Figure A11. Frequencies for the possible answers to the question “After answering a question correctly, I continued to click on incorrect answers to get more feedback”.
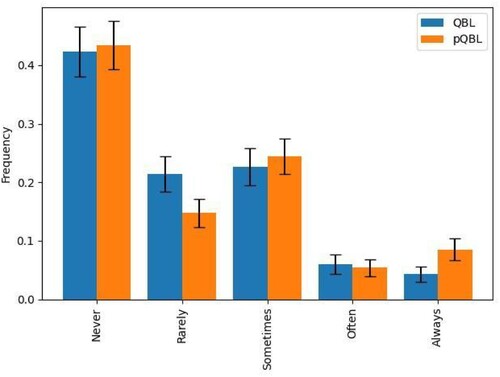
Figure A12. Frequencies for the possible answers to the question “How often did you feel frustrated during the course?”.
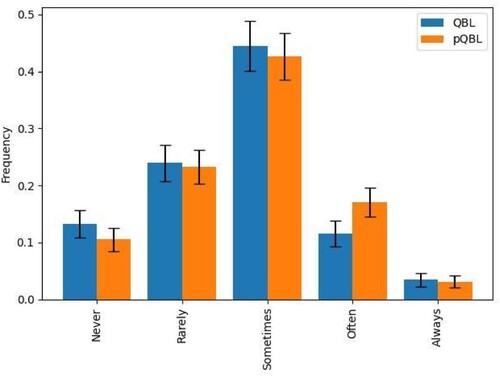
Figure A13. Frequencies for the possible answers to the question “Approximately how long did it take you to complete the course? Answer in minutes”, grouped by the nearest half-hour.
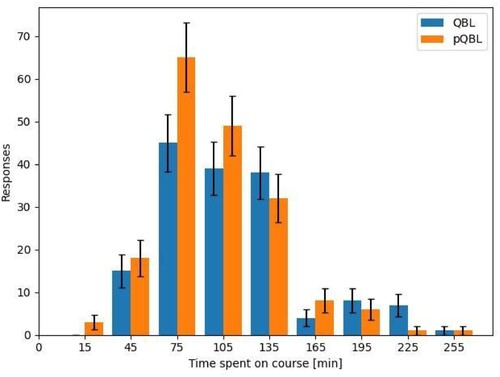
Figure A14. Our estimates of the time participants spent on the course, grouped by the nearest half-hour.