
 ?Mathematical formulae have been encoded as MathML and are displayed in this HTML version using MathJax in order to improve their display. Uncheck the box to turn MathJax off. This feature requires Javascript. Click on a formula to zoom.
Abstract
Previous researches revealed a copy number variation (CNV) region in the bovine fibroblast growth factor 13 (FGF13) gene. However, its effects remain unknown. This study detected the various copy number types in seven Chinese cattle breeds and analysed their population genetic characteristics and effects on growth traits and transcription levels. Copy number Loss was more frequent in Caoyuan Red cattle and Xianan cattle than in the other breeds. Association analysis between CNV and growth traits of Qinchuan indicated that the CNV was significantly related to chest depth, hip width and hucklebone width (P < 0.05). Additionally, the growth traits of individuals with copy number Loss were significantly inferior to those with copy number Gain or Median (P < 0.05). Besides, we found two splicing isoforms, AS1 and AS2, in FGF13 gene, which resulted from alternative 5′ splicing sites of intron 1. These isoforms showed varied expression levels in various tissues. Moreover, CNV was significantly and negatively associated with the mRNA expression of AS1 (r = −0.525, P < 0.05). The CNVs in bovine FGF13 gene negatively regulated growth traits and gene transcription. These observations provide new insights into bovine FGF13 gene, delivering potentially useful information for future Chinese cattle breeding programs.
Introduction
Growth traits and meat quality are the main constraints in the beef cattle industry. These could be improved by exploring molecular mechanisms underlying cattle growth and beef production. Copy number variation (CNV), ranging from 1 kb to n Mb, have been investigated as crucial sources of phenotypic variations. Recent researches indicated that CNVs might regulate growth, reproduction and meat development by changing gene structure and dosage, altering gene regulation and recessive alleles exposures.Citation1–4 Alternative splicing (AS), the process through which pre-mRNA is spliced into mature mRNA or removed, is another contributor to genetic complexity. AS was shown to play an important role in biological processes, contributing to protein localization, enzymatic properties, protein binding domains and more.Citation5 Recently, many CNVs and AS events have been discovered in cattle. Liu identified over 200 candidate CNV regions in total among diverse cattle breeds using array comparative genomic hybridization.Citation6 A total of 9313 deletion and 234 duplication CNV regions were found in Chinese Simmental beef cattle by whole genomic sequencing.Citation7 In addition, Fang identified seven AS events in cattle, including 115 differentially expressed alternative spliced genes between Japanese black cattle and Chinese Red steppes.Citation8 However, the molecular mechanisms of these CNV regions and AS events underlying cattle growth and development remain unclear.
Growth factors greatly contribute to the individual’s development. Fibroblast growth factor (FGF) is an important growth factor family involved in embryonic development, cell growth, morphogenesis and tissue repair.Citation9–11 Among them, FGF13, located on chromosome X, is transcribed as a microtubule-binding protein in the nervous system.Citation12 It was reported that FGF13 was expressed in reproductive tract and involved in adipogenesis in cattle goat.Citation13,Citation14 GenBank reports many CNV loci in the FGF13 gene, including esv743500 and esv712818 in mice and nsv2773697 and nsv2772128 in humans. Furthermore, many transcriptional variants of FGF13 have been reported.Citation15,Citation16 Based on the re-sequencing result of Chinese cattle referring to NCBI Sequence Database (RefSeq: ref_Bos_taurus_UMD_3.1_gnomon_top_level.gff3),Citation17 a CNV region (ChrX: 22664203-22665978) was overlapped with FGF13 gene (Accession number: AC_000187.1, https://www.ncbi.nlm.nih.gov/nuccore/AC_000187.1?report=genbank&from=22043201&to=22693090&strand=true). It is well known that genetic variations in growth factors could be associated with growth traits, meat quality, reproduction traits and incidence of diseases. These variations could be used as molecular markers in livestock breeding and disease diagnosis.Citation18,Citation19 But detailed reports regarding the genetic effects of CNVs or AS of FGF13 in Chinese cattle are lacking.
Based on the non-species specificity of FGF13 gene, it was hypothesized that genetic variants within bovine FGF13 gene was relevant to growth traits in cattle. Therefore, the CNVs in various Chinese cattle breeds were detected, and their effects on growth characteristics were investigated. In addition, given the lack of information, splicing variations in bovine FGF13 gene were revealed. In order to detect whether the CNVs worked via dosage effect on transcriptional level, the relationship between relative copy number of FGF13 gene and expression level of different splicing variants was also examined. Our research will help discover bovine population genetic characteristics related to FGF13 and establish a theoretical and data basis for the molecular breeding of Chinese cattle.
Materials and methods
Sample collection
All experimental procedures were approved by the Institutional Animals Care and Use Committee (IACUC) of the College of Animal Science and Technology of Henan Agricultural University, China (Permit Number: 11-0085; Date: 06-2011). For population genetic analysis, 210 Chinese cattle from seven breeds, Qinchuan (QC), Nanyang (NY), Jiaxian Red cattle (JX), Luxi cattle (LX), Jinnan cattle (JN), Caoyuan Red cattle (CY) and Xianan cattle (XN), (n = 30 each) were randomly selected (Table S1). For the association analysis, a large group of QC (n = 132) was constructed and their body measurements (body height, height at hip cross, body length, heart girth, chest width, chest depth, rump length, hucklebone width, hip width) were recorded according to Qiu’s methodCitation20 (Table S2). All the animals were weaned at the age of six months and raised from weaning to slaughter on a corn–corn silage diet. They were around two years old, unrelated, healthy and female. Their blood samples were collected from jugular vein and mixed with anticoagulants at a rate of 1:6. The samples were stored at −80 °C pending analysis. Genomic DNA (gDNA) was isolated from the blood samples by phenol–chloroform extraction following the method of Sonstegard et al.Citation21
Tissue samples, including heart, liver, spleen, lung, kidney, skeletal muscle and adipose tissue from foetal (two months of gestation, n = 5, female) and adult (24-month-old, n = 5, female) QC cattle were collected for RNA isolation and exploration of the tissue expression profiles of the various splicing isoforms. Skeletal muscle and brain tissues from 21 foetal (two months of gestation, female) and lung tissues from 12 adult (2-year-old, female) QC cattle were used for RNA and gDNA extraction. The cattle were slaughtered in a commercial slaughterhouse in Yangling, Shaanxi. The foetuses were collected from slaughtered females. Samples were submerged in liquid nitrogen within ten minutes of slaughter and stored at stored at −80 °C until use. RNAplus reagent (TAKARA, Japan) was used to isolate total RNA. The concentrations and purities were measured by spectrophotometry (Pharmalia, Sweden). Subsequently, cDNA was synthesized with PrimeScript RT Reagent Kit (Perfect Real Time) (TAKARA, Japan). Tissue gDNA was extracted by proteinase K digestion, chloroform extraction and ethyl alcohol precipitation for copy number type detection.
Real-time quantitative PCR
A primer pair () was designed using Primer 5.0 with the DNA sequence in the CNV region as a reference to detect individual copy number types. The copy number types were determined by real-time quantitative PCR (qPCR) with gDNA as a template using the CFX 96TM Real-Time Detection System (BioRad, USA). Bovine basic transcription factor 3 (BTF3) was chosen as a diploid internal reference gene for genomic qPCR.Citation6
Table 1. The primers used in this study.
Tissue expression of the various splicing isoforms was assessed using cDNA qPCR. The primers targeted specific sequences of the different isoforms. The relative expression was normalized against the expression of glyceraldehyde-3-phosphate dehydrogenase (GAPDH). The primers’ sequences are shown in .
The qPCR reaction volume (20 μL) contained 50 ng gDNA for gDNA qPCR or 2 μL cDNA for cDNA qPCR, 10 μL SYBR Premix Ex Taq TM II (TAKARA, Japan) and 2 μL of each primer (10 μM). The thermal cycling conditions were 95 °C for 1 min, followed by 40 cycles of 95 °C for 10 s and 60 °C for 30 s. All qPCR experiments were repeated three times.
Identification of FGF13 splicing variations and bioinformatics analysis
A primer pair covering the coding region of the bovine FGF13 mRNA was designed based on the published sequence (GenBank accession number: NM_001098892.2; ). The PCR products were purified, ligated into a pGEM-T vector (Promega, USA) and sequenced. The sequencing results were displayed in ChromasPro. The nucleotide sequences of PCR products were aligned with NM_001098892.2 by BioXM2.6. The transcriptional products whose sequences were partly distinguished from NM_001098892.2 were identified as novel ones.
Statistics analysis
The 2−ΔΔCt method was used to detect individual copy number types following the method of Schmittgen and Livak.Citation22 The copy number types were classed as Gain (−ΔΔCt > 0.5), Median (−0.5 ≤ −ΔΔCt < 0.5) and Loss (−ΔΔCt ≤ .5) based on the −ΔΔCt value relative to the same reference QC cattle used in re-sequencing analysis, as described by Zhang et al.Citation23 and using BTF3 as internal control. Because cattle have two DNA segment copies, the individual relative copy number was calculated as 2 × 2−ΔΔCt. Gene expression was designated as 2−ΔΔCt using GAPDH as an internal control.
The following general linear model was applied to estimate the effect of copy number types on body size by analysis of variance using PASW Statistics for Windows, Version 18.0 (SPSS Inc., Chicago, IL, USA):
in which, Yi is the trait measurement, μ is the overall population mean, Ai is the effect of age, Gj is the copy number type effect and ei is the random error.Citation23 Since all the QC used in the association analysis were female and kept under the same condition, the effects of breed, farm and sex were not included in this model. The normal data distribution of data for the growth traits was detected by the Kolmogorov–Smirnov test. The correlations between relative copy numbers and AS expression levels were analysed to assess the dosage effect of CNV. The significance level was set as P < 0.05.
Results
Population genetic analysis of FGF13 CNVs
Sequence analysis revealed that the CNV region was 1776 bp in length and located in the longest intron of FGF13, intron 3. The amplification efficiency of the primers was validated before carrying out gDNA qPCR, showing only one peak in the melting curve and no products in the no-temple control reactions. The standard curve slopes ranged between −3.11 and −3.48, indicating nearly 100% PCR efficiency. Similarly, the target and reference gene amplification values differed by less than 0.05. Furthermore, the ΔΔCt value was compared between the NY and QC cattle, which were also used in a previous re-sequencing analysis. When compared NY to QC, CNVs with a −ΔΔCt difference of 1.15 were confirmed. Consequently, the designed primers were used to detect the relative copy numbers in this study.
The FGF13 CNVs differed significantly among breeds (). JX had the largest copy number, while CY had the smallest. Loss was most frequent in CY and XN, which had significantly fewer copies than the other breeds (). Median was common in NY, whose copy number differed significantly from the JX, JN, CY and XN (). The relative copy number frequencies in QC, NY, JX, LX, JN, CY and XN were 3, 2, 3, 4, 4, 0 and 1, respectively. The CNV type results indicated that Gain was dominant in QC, JX, LX and JN, Median in NY and Loss in XN ().
Figure 1. Population genetic analysis of FGF13 CNVs in seven Chinese cattle breeds. (a) Comparison of FGF13 CNVs in seven Chinese cattle breeds based on the −ΔΔCt values. Different lowercase letters indicate significant differences (P < 0.05). (b) Frequencies of the copy number types in seven Chinese cattle breeds. The bars represent the frequency values.
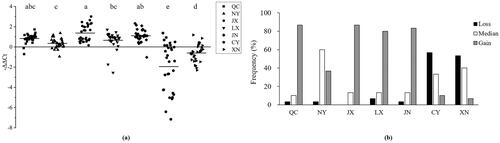
Table 2. The significance of relative copy number among different breeds (P values).
Identification of AS within the bovine FGF13 gene
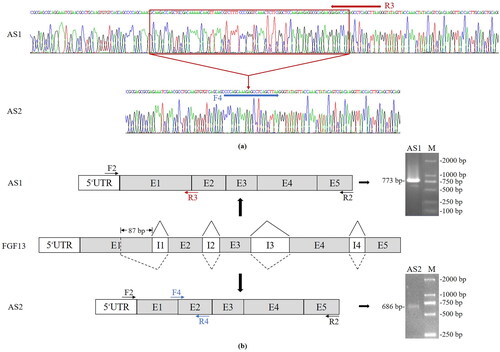
Sequencing of the recombined T-plasmids detected two transcriptional variants of bovine FGF13 (), named AS1 and AS2. The agarose gel electrophoresis patterns of their PCR products are shown in . Their nucleotide sequence alignment is shown in Supplementary Figure S1. The lengths of their respective coding region were 738 and 651 bp, indicating that AS2 encoded 29 amino acids fewer than AS1. The nucleotide sequence of AS1 is a known transcriptional product (GenBank accession number: NM_001098892.2), but that of AS2 is novel. The schematic diagrams of their AS are shown in . Both AS1 and AS2 have five exons. However, their nucleotide sequences at the 3′ end of exon 1 are different. Therefore, the AS events of AS1 and AS2 resulted from alternative 5′ splicing sites in intron 1.
Figure 2. Structure maps and schematic diagrams of AS products of the bovine FGF13 gene. (a) Sequencing chromatograms of AS1 and AS2. The red rectangle marks the region whose sequence differs between AS1 and AS2. (b) Schematic diagrams of mRNA splicing and the resultant AS1 and AS2. The primer positions are shown. Primers F2/R2 amplified the CDS regions of AS1 and AS2. Primers F2/R3 and F4/R4 were used in qPCR to detect the expressions of AS1 and AS2, respectively.
Association analysis
Previous studies showed significant associations between CNVs in functional gene sequences and phenotypes.Citation1 Therefore, we conducted an association analysis between the CNVs and growth traits in QC cattle. The results showed that this CNV was significantly associated with chest depth, hip width and hucklebone width (P < 0.05, ). Individuals with copy number Gain tended to have significantly smaller growth traits values than those with Loss or Median (P < 0.05). As a result, CNVs in FGF13 had a significantly negative effect on growth traits in QC cattle.
Table 3. The associations between the of FGF13 copy number type and growth traits in QC.
Tissue expression analysis
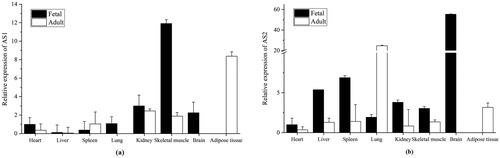
In order to evaluate the tissue expressions of different splicing isoforms in foetal and adult cattle, two pairs of specific primers, F3/R3 and F4/R4, were designed to amplify fragments covering unique sequences of AS1 and AS2, respectively ( ). As shown in , AS1 and AS2 differed in expression levels in various tissues. The expression of AS1 in the foetal heart, liver, lung, kidney and skeletal muscle and AS2 in the foetal heart, liver, spleen and skeletal muscle was higher than in adults. Interestingly, while AS1 was hardly detected in the adult lung, AS2 expression in the adult lung was higher than in the foetal lung. Importantly, the highest expression levels of AS1 and AS2 in foetal cattle were in the skeletal muscle and brain, respectively. The peak AS1 and AS2 expression levels in adult cattle were in the fat and lung tissues, respectively.
Figure 3. Tissue expression patterns of AS1 and AS2. (a) The expression levels of AS1 in various cattle foetal and adult tissues. (b) The expression levels of AS2 in various cattle foetal and adult tissues. In both (a) and (b), the expression level in the foetal heart was set as ‘1’. The bar was presented the mean ± SD.
Dosage effect detection
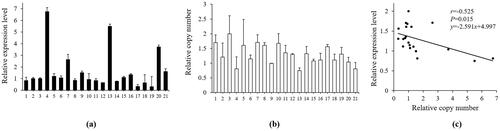
Pearson correlation analysis between the relative copy number and each splicing isoform expression was carried out to evaluate the effect of CNVs in non-coding regions on gene splicing. Since AS1 and AS2 showed the highest expression levels in the foetal skeletal muscle and brain, respectively, these foetal tissues were chosen to detect the dosage effect of CNVs on their expression levels. The relative AS1 expression levels in the foetal skeletal muscle varied from 0- to 7-fold (), while individual relative copy numbers ranged between 0.7- and 2.5-fold (). Importantly, Pearson correlation analysis detected a significant negative correlation between these variables (r = −0.525, P < 0.05; ). The relative AS2 expression levels in the foetal brain varied from 0 to 17-fold and were insignificantly negatively correlated to the relative copy number (r = −0.200, P > 0.05; Figure S2). Moreover, since only one isoform, AS2, was detected in the adult lung, 12 adult lungs were collected to evaluate the association between the CNV dosage and AS2 expression (Figure S2). We found an insignificant positive correlation between them. Consequently, FGF13 CNVs showed a significant dosage effect on the mRNA expression of AS1 in skeletal muscles but none on AS2 expression.
Figure 4. Correlation analysis between the relative copy number in FGF13 and the expression level of AS1 in the foetal QC cattle skeletal muscle. (a) The AS1 relative mRNA expression level in foetal skeletal muscle. (b) The relative copy number in FGF13 in foetal skeletal muscle. (c) Analysis of the correlation between the CNVs and AS1 expression. The bars represent the mean ± SD.
Discussion
As a member of the FGF family, FGF13 contributes greatly to growth and development. Previous reports indicated that genetic variations within growth factors, including the FGF family, could be potential molecular markers of growth and production traits. For example, polymorphisms of the bovine FGF21 gene were significantly associated with body weight.Citation24 Besides, it is known that genetic variations in the FGF13 gene are related to human development.Citation25 Given that members of this gene family usually have similar structures and functions, and the sequence and functions of FGF13 are highly conserved among species,Citation26 we hypothesized that genetic variations in FGF13 were associated with growth and development in cattle. As a result, the CNVs and splicing variants in bovine FGF13 are reported here for the first time. Their associations with growth traits and mRNA expression were also revealed. These results supplement the knowledge about genetic variations in Chinese cattle.
CNVs are an important source of genomic structural variations. The association between CNVs and production traits has been widely reported. In 2012, the integration of QTL mapping analysis in pigs identified seven CNVs in genes as potential candidates affecting multiple growth traits, including carcass length, backfat thickness, abdominal fat weight and scapular length.Citation27 CNVR#456 in BTA18 was closely associated with protein production, fat production and herd life in cattle.Citation28 This study found significant relationships between the CNVs and chest depth, hip width and hucklebone width in QC cattle, corresponding well with the crucial role of FGF13. We concluded that the CNVs in FGF13 negatively regulated cattle growth based on the poorer growth traits observed in cows with Gain type.
Additionally, the relative copy numbers of different cattle breeds were compared. It is worth noting that the relative copy numbers in CY and XN in this study were significantly smaller than in the other breeds, possibly due to the origin of these breeds. CY is a hybrid cattle breed developed from Shorthorn and Mongolian cattle. XN is a hybrid cattle breed developed from Charolais and NY cattle. Shorthorn and Charolais were originated from England and France. Conversely, the other five cattle breeds (QC, NY, JN, JX and LX) are native Chinese cattle breeds. The genetic characteristics of foreign breeds were significantly distinguished from native breeds, as a result, the CNVs of CY and NY were significantly different from other breeds. However, in order to prove this hypothesis, foreign cattle breeds should be applied for further study.
AS can direct the production of multiple transcriptional variants from one gene, resulting in multiple protein products and diverse biochemical properties.Citation16 It was reported that FGF13 in humans has five splicing isoforms that differ in their 5′ exon, promoter and N-terminal sequences.Citation15,Citation16 This research detected two transcriptional variants in the bovine FGF13 gene for the first time. However, unlike in humans, the AS event in cattle was the AS 5′ sites in intron 1. Because FGF13 is highly conserved, it is possible that additional splicing isoforms are present but were not detected in this research. In most tissues, AS1 and AS2 mRNA abundance in foetal cattle was higher than in adults, implying that AS1 and AS2 mainly control embryonic development in cattle, in all tissues except for the spleen and lung.
Genic CNVs are predict to influence phenotypes through several phenomena such as gene dosage, expression regulation changes and recessive allele exposure.Citation29,Citation30 Recent investigations about the effects of CNVs focused on gene dosage, in which CNVs changed gene expression. Furthermore, gene expression is likely sensitive to CNV-induced alterations.Citation31 CNVs and AS are widespread phenomena that increase protein function diversity.Citation32–34 Variations in non-coding regions could affect the splice donor and acceptor site,Citation35 resulting in the expression of various splicing isoforms. The CNV region reported in this study was in intron 1 of FGF13 gene. This research evaluated the dosage effects of CNV on the expression of splicing isoforms. We found that the highest expression levels of AS1 and AS2 were in foetal skeletal muscle and brain. Previous reports indicated that FGF13 gene was highly expressed in brain and skeletal muscle and played important roles in their development.Citation36 For this reason, we detected the dosage effects in foetal skeletal muscle and brain tissues. However, we only found a significantly negative correlation between the CNVs and AS1 expression. Positive corrections might be observed because overlapping copies of gene sequences could be actively transcribed and expressed, such as CNVs in CCL3L1 gene.Citation37 In contrast, since the complex regulatory elements involved in CNV region or their sequence nearby, CNVs might negatively alter gene expression, such as RHACD8 gene in chickenCitation38 and MICAL-L2 gene in cattle.Citation39 In GenBank, several splicing isoforms within bovine MICAL-L2 gene (NM_001098932.1, XM_059881237.1, XM_059881238.1 and XM_059881239.1) were observed. However, the researchers did not detect the association between CNVs and expression of different transcriptional variants of these genes. Since different splicing isoforms may show different expression patterns and have divergent functions,Citation5 the association between CNVs and total mRNA may not completely explain the dosage effect of CNVs on gene expression. Different from these researches, the dosage effects of CNVs on expression level of different transcriptional variants rather than the total mRNA were investigated. These finding might imply that the CNVs down-regulated the splicing of AS1 but had no effect on AS2 splicing. During mRNA splicing, splicing factors bound to the sequence of intron. As the CNVs located in the intron of FGF13 gene, splicing factors, like SF, U2AF, were predicted to bind on this region, it supposed that these CNVs affected the binding of splicing factors and then had an effect on the splicing of FGF13 gene. But this research was preliminary findings, a minigene assay is needed to further investigate the impact of CNVs on bovine FGF13 gene splicing.
This study detected CNVs and AS in bovine FGF13 gene in Chinese cattle breeds. The genetic distribution of CNV is significantly different among different breeds, especially, the relative copy numbers in CY and XN were significantly less than other breeds. The CNV was significantly associated with chest depth, hip width and hucklebone width in QC cattle, making the CNVs as a potential DNA marker for molecular breeding of QC cattle. Additionally, the individuals with Gain type showed significantly lower body size than those with Norm and Loss types. On the other hand, a novel transcriptional isoform of bovine FGF13 gene resulting from alternative 5′ splicing sites in intron 1 were found. Both of the two different transcriptional isoforms were expressed in multiple tissues. A significant negative correlation was found between the relative copy number in FGF13 and AS1 in foetal skeletal muscle, but no significant association between CNVs and AS2 was observed. Taken together, it supposed that CNVs in the bovine FGF13 gene negatively influenced growth traits through a negative dosage effect on transcriptional expression. This study provided preliminary information about genetic variations in the bovine FGF13 gene, which could be a valuable resource applied in further Chinese cattle breeding programs.
Supplemental Material
Download MS Word (574 KB)Disclosure statement
No conflict of interest exists.
Additional information
Funding
References
- Giuffra E, Törnsten A, Marklund S, et al. A large duplication associated with dominant white color in pigs originated by homologous recombination between LINE elements flanking KIT. Mamm Genome. 2002;13(10):1–10.
- Henrichsen CN, Chaignat E, Reymond A. Copy number variants, diseases and gene expression. Hum Mol Genet. 2009;18(R1):R1–R8.
- Wright D, Boije H, Meadows JR, et al. Copy number variation in intron 1 of SOX5 causes the Pea-comb phenotype in chickens. PLoS Genet. 2009;5(6):e1000512.
- Zhang F, Gu W, Hurles ME, Lupski JR. Copy number variation in human health, disease, and evolution. Annu Rev Genomics Hum Genet. 2009;10(1):451–481.
- Wright CJ, Smith CW, Jiggins CD. Alternative splicing as a source of phenotypic diversity. Nat Rev Genet. 2022;23(11):697–710.
- Liu GE, Hou Y, Zhu B, et al. Analysis of copy number variations among diverse cattle breeds. Genome Res. 2010;20(5):693–703.
- Yang L, Niu Q, Zhang T, et al. Genomic sequencing analysis reveals copy number variations and their associations with economically important traits in beef cattle. Genomics. 2021;113(1 Pt 2):812–820.
- Fang X, Xia L, Yu H, et al. Comparative genome-wide alternative splicing analysis of longissimus dorsi muscles between Japanese Black (Wagyu) and Chinese Red Steppes Cattle. Front Vet Sci. 2021;8:634577.
- Yamaguchi TP, Rossant J. Fibroblast growth factors in mammalian development. Curr Opin Genet Dev. 1995;5(4):485–491.
- Guillemot F, Zimmer C. From cradle to grave: the multiple roles of fibroblast growth factors in neural development. Neuron. 2011;71(4):574–588.
- Zhang X, Bao L, Yang L, Wu Q, Li S. Roles of intracellular fibroblast growth factors in neural development and functions. Sci China Life Sci. 2012;55(12):1038–1044.
- Wu QF, Yang L, Li S, et al. Fibroblast growth factor 13 is a microtubule-stabilizing protein regulating neuronal polarization and migration. Cell. 2012;149(7):1549–1564.
- Tríbulo P, Siqueira LGB, Oliveira LJ, Scheffler T, Hansen PJ. Identification of potential embryokines in the bovine reproductive tract. J Dairy Sci. 2018;101(1):690–704.
- Du Y, Ma J, Wang Y, et al. MiR-421 regulates goat intramuscular preadipocytes differentiation via targeting FGF13. Anim Biotechnol. 2022;33(6):1333–1343.
- Yang J, Wang Z, Sinden DS, et al. FGF13 modulates the gating properties of the cardiac sodium channel Nav1.5 in an isoform-specific manner. Channels. 2016;10(5):410–420.
- Johnstone CN, Pattison AD, Harrison PF, et al. FGF13 promotes metastasis of triple-negative breast cancer. Int J Cancer. 2020;147(1):230–243.
- Xu Y, Jiang Y, Shi T, et al. Whole-genome sequencing reveals mutational landscape underlying phenotypic differences between two widespread Chinese cattle breeds. PLoS One. 2017;12(8):e0183921.
- Ge W, Davis ME, Hines HC, Irvin KM, Simmen RCM. Association of single nucleotide polymorphisms in the growth hormone and growth hormone receptor genes with blood serum insulin-like growth factor I concentration and growth traits in Angus cattle. J Anim Sci. 2003;81(3):641–648.
- Chou HT, Chen CH, Tsai CH, Tsai FJ. Association between transforming growth factor-β1 gene C-509T and T869C polymorphisms and rheumatic heart disease. Am Heart J. 2004;148(1):181–186.
- Qiu H. Chinese Yellow Cattle. Beijing, China: Agriculture Press; 1992; 65.
- Sonstegard TS, Garrett WM, Ashwell MS, Bennett GL, Kappes SM, Van Tassell CP. Comparative map alignment of BTA27 and HSA4 and 8 to identify conserved segments of genome containing fat deposition QTL. Mamm Genome. 2000;11(8):682–688.
- Schmittgen TD, Livak KJ. Analyzing real-time PCR data by the comparative CT method. Nat Protoc. 2008;3(6):1101–1108.
- Zhang L, Jia S, Yang M, et al. Detection of copy number variations and their effects in Chinese bulls. BMC Genomics. 2014;15(1):480.
- Sun X, Li M, Li A, et al. Two novel intronic polymorphisms of bovine FGF21 gene are associated with body weight at 18 months in Chinese cattle. Livest Sci. 2013;155(1):23–29.
- Zhang L, Yang M, Li C, et al. Identification and genetic effect of a variable duplication in the promoter region of the cattle ADIPOQ gene. Anim Genet. 2014;45(2):171–179.
- Sun J, Xue J, Zhang C, Lan X, Lei C, Chen H. Haplotype combination of the caprine PC1 gene sequence variants and association with growth traits in Chinese Haimen breed. J Genet. 2012;93(S1):54–59.
- Pan X, Zhao J, Zhou Z, et al. 5′-UTR SNP of FGF13 causes translational defect and intellectual disability. Elife. 2021;10:e63021.
- Conrad B, Antonarakis SE. Gene duplication: a drive for phenotypic diversity and cause of human disease. Annu Rev Genomics Hum Genet. 2007;8(1):17–35.
- Spielmann M, Klopocki E. CNVs of noncoding cis-regulatory elements in human disease. Curr Opin Genet Dev. 2013;23(3):249–256.
- Boone PM, Campbell IM, Baggett BC, et al. Deletions of recessive disease genes: CNV contribution to carrier states and disease-causing alleles. Genome Res. 2013;23(9):1383–1394.
- Stankiewicz P, Lupski JR. Structural variation in the human genome and its role in disease. Annu Rev Med. 2010;61(1):437–455.
- Chen C, Qiao R, Wei R, et al. A comprehensive survey of copy number variation in 18 diverse pig populations and identification of candidate copy number variable genes associated with complex traits. BMC Genomics. 2012;13(1):733.
- Seroussi E, Glick G, Shirak A, et al. Analysis of copy loss and gain variations in Holstein cattle autosomes using BeadChip SNPs. BMC Genomics. 2010;11(1):673.
- Papp B, Pál C, Hurst LD. Dosage sensitivity and the evolution of gene families in yeast. Nature. 2003;424(6945):194–197.
- Wang ET, Sandberg R, Luo S, et al. Alternative isoform regulation in human tissue transcriptomes. Nature. 2008;456(7221):470–476.
- Barbazuk WB, Fu Y, McGinnis KM. Genome-wide analyses of alternative splicing in plants: opportunities and challenges. Genome Res. 2008;18(9):1381–1392.
- Lee H, Bae S, Choi BW, Choi JC, Yoon Y. Copy number variation of CCL3L1 influences asthma risk by modulating IL-10 expression. Clin Chim Acta. 2011;412(23-24):2100–2104.
- Wang X, Nahashon S, Feaster TK, Bohannon-Stewart A, Adefope N. An initial map of chromosomal segmental copy number variations in the chicken. BMC Genomics. 2010;11(1):351.
- Xu Y, Zhang L, Shi T, et al. Copy number variations of MICAL-L2 shaping gene expression contribute to different phenotypes of cattle. Mamm Genome. 2013;24(11–12):508–516.