
ABSTRACT
Objective: The aim of this study was to test if performance of airline pilots, in performing an aerodynamic stall recovery procedure, decreases when they are surprised, compared to when they anticipate a stall event.
Background: New flight-safety regulations for commercial aviation recommend the introduction of surprise and startle in upset prevention and recovery training. This calls for more evidence on the effects of surprise on pilot performance, as well as methods to effectively induce surprise in training simulators.
Method: The study took place in a motion-base simulator with a poststall aerodynamic model. Using a within-subjects design, the recovery performance of 20 pilots was tested in 2 conditions: 1 anticipated condition, and 1 surprise condition. In addition to flight parameters, subjective and physiological data relating to surprise and startle were measured.
Results: Pilots had significantly more difficulties with adhering to the recovery procedure in the surprise condition compared to the anticipation condition. The subjective and physiological measures confirmed that the manipulation mainly increased surprise, and to a lesser extent also startle.
Conclusion: The results suggest that pilots have more difficulty in managing an upset situation (i.e., an aerodynamic stall) when this situation is presented unexpectedly, underlining that upset prevention and recovery training should include elements of surprise.
Loss of control in flight currently makes up the largest category of fatal aviation accidents (Boeing, Citation2016). Several of these events have been associated with inappropriate responses of the flight crew (Belcastro & Foster, Citation2010), and it is commonly suspected that surprise and startle contribute to such inappropriate responses (see, e.g., Colgan Air flight 3407; National Transportation Safety Board, Citation2010). For this reason, aviation authorities recommend the introduction of surprise and startle in upset prevention and recovery training (European Aviation Safety Agency [EASA], Citation2015; Federal Aviation Administration [FAA], Citation2015).
The difference between surprise and startle is that the former relates specifically to a cognitive mismatch between new information and expectations, whereas the latter is a more physiological reaction to a highly salient stimulus (e.g., sudden, intense, or threatening; Rivera, Talone, Boesser, Jentsch, & Yeh, Citation2014). Surprise might thus occur in the absence of a startle, for instance when an event occurs slowly and is not immediately threatening. Similarly, a startle could occur in the absence of surprise, for instance when a stimulus is loud and scary but not unexpected. Surprise such as automation surprises seem to occur quite frequently in today’s operational practice, although it remains inconsequential in most cases (de Boer & Hurts, Citation2017; Kochan, Breiter, & Jentsch, Citation2004). One explanation for the occurrences of surprise is the increasing complexity of automated systems, including different flight modes, which might make the flying process less transparent to the pilot, and potentially lead to unexpected situations (Sarter, Woods, & Billings, Citation1997).
As outlined in our conceptual model (Landman, Groen, van Paassen, Bronkhorst, & Mulder, 2016), startle and surprise can both impair pilot performance, but in different ways. The negative consequences of startle involve an acute increase in stress (Martin, Murray, Bates, & Lee, Citation2015, Citation2016), which could negatively affect cognitive functioning as well as perceptual-motor control (Eysenck, Derakshan, Santos, & Calvo, Citation2007). The negative consequences of surprise include the need for mentally taxing efforts, or “sensemaking activities,” to solve the existing cognitive mismatch (Klein, Phillips, Rall, & Peluso, Citation2007) before one can take appropriate actions. Current cognitive models propose that interrelated knowledge and procedures are grouped in cognitive structures such as “schemata” or “frames” (e.g., Klein et al., Citation2007). Information is processed within the context of the currently active frame. If a mismatch arises between perceived information and the active frame, a frame switch might be required (i.e., “reframing,” see also Rankin, Woltjer, & Field, Citation2016). Reframing is relatively effortful, potentially requiring reasoning and knowledge-based behavior, meaning that it is vulnerable to negative aspects of stress (Eysenck et al., Citation2007). Difficulties with reframing might express themselves as confusion, loss of “grip” on the situation, or the adoption of a new, inappropriate frame.
Some recent experimental studies addressed the effects of startle or surprise on pilot performance. The results show that pilots have substantial difficulties with applying learned procedures when they are surprised (Casner, Geven, & Williams, Citation2013; Schroeder, Bürki-Cohen, Shikany, Gingras, & Desrochers, Citation2014), or when they must recover from an aerodynamic stall without a prior refresher of recovery procedures (Ledegang & Groen, Citation2015). It was also shown that the time to respond to an event increases when this event comes unexpectedly (Casner et al., Citation2013) or when it is accompanied by a startling stimulus (Martin et al., Citation2016).
Although these studies suggest that it is useful to familiarize pilots with unusual flight situations (e.g., upsets, aerodynamic stalls), or to practice situations with elements of surprise or startle, the design of the studies was not optimized to conclusively show the effects of surprise. For example, the studies of Ledegang and Groen (Citation2015) and Martin et al. (Citation2016) did not require a reaction to a surprising event, and the study of Martin et al. (Citation2016) was focused on startle instead of on surprise. Schroeder et al. (Citation2014) did not include a control condition to determine if the observed performance decrements were attributable to surprise. Casner et al. (Citation2013) did not report a manipulation check. The current study was aimed at complementing these previous studies by specifically manipulating surprise, while including a control condition and a manipulation check. As a novel approach, we included not only self-report measures but also physiological measures to check the surprise manipulation. The results of this study were intended to provide an indication of the effects of surprise on pilot performance in a simulated upset event, which should be of interest to those who seek to simulate such events for training or research purposes.
We expected that by creating a mismatch between pilots’ expectations and the upset event, adherence to a learned recovery procedure would be lower, as the retrieval of the procedure when pilots are not in the correct frame. On the other hand, when an upset event is anticipated, sensemaking might occur beforehand, eliminating the need to reframe at the moment when the upset occurs.
Method
Participants
Twenty male airline pilots participated in the study (M age = 36.3 years, SD = 7.88; M flying experience = 12.4 years, SD = 5.05; M flying hours = 6,986, SD = 3,804). Experience in operating medium-size twin-engine jet aircraft types was required. Eight pilots mainly had experience with the A330, five with the B737, six with the E190, and one with the A320. All pilots were employed at the time of the experiment, and they had been on duty at least once in the week prior to the experiment. Five were currently employed as captains, eleven as first officers, and three as second officers. To limit interindividual differences in experience, criteria for exclusion from participation were expecting jet lag at the time of the experiment; having experience in similar experiments; being a simulator training instructor; and having experience with flying in the air force, with aerobatics, or with glider flying. The trait anxiety scores (M = 29.0, SD = 6.23) of the participating pilots, measured beforehand with the State–Trait Anxiety Inventory (Spielberger, Gorsuch, & Lushene, Citation1970), were significantly lower than the norm (i.e., 36.7), t = −5.57, p < .01, indicating that they were not extraordinarily sensitive to threat. The pilots provided written informed consent prior to participation and the ethics committee of the TNO Soesterberg research institute approved the experiment.
Apparatus
The experiment was performed in the Desdemona flight simulator (AMST Systemtechnik; see Ledegang & Groen, Citation2015), located at TNO Soesterberg. Desdemona features a gimbaled system that allows for continuous rotations around three axes. This system can be moved within a stroke of 2 m vertically on a heave axis and 8 m laterally on a horizontal track. The centrifuge capability of the simulator was not used to generate g-forces. The cockpit mockup was styled after the Boeing 737NG, and included the left-side seat, primary flight display (without pitch limit indicator), navigation display, engine-indicating and crew-alerting system, and a partial mode control with autopilot mode controls. There was no overhead panel or flight management system. Controls consisted of a yoke (pitch and roll), rudder pedals with rudder limiter, throttles and a stabilizer with electric trim (tabs), and silent trim wheels. The yoke had control loading on pitch only. Flaps and speed brakes were not used.
The aerodynamic model used in the experiment featured an extended aerodynamic envelope of medium-sized modern transport category aircraft (e.g., Boeing 737NG, Airbus A321, Tu-204) into high angles of attack (Groen et al., Citation2012). The model includes aerodynamic phenomena like buffeting, longitudinal and lateral instabilities, dynamic hysteresis, and degradation of control response (Goman & Khrabrov, Citation1994).
Tasks and Conditions
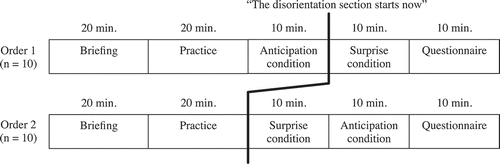
Before the experiment, pilots were informed that the simulator session would include two subsequent sections of approximately 20 to 30 min. They were told that they would perform recoveries from upsets and stalls to validate the simulator’s aerodynamic model in the first section, and that they would judge the fidelity of several simulated spatial disorientation illusions in the second section of the experiment. In reality, the first section was used for familiarization with the aerodynamic model and refreshing the recovery procedure, while the second section would not take place as described. It was made up to manipulate the pilots’ expectation before test conditions. shows an overview of the experimental design.
Figure 1. The experimental design.
First, a briefing on aerodynamics and recovery techniques was given in a 20-min session to groups of two pilots. They were asked to respond accurately to any simulated situation as if it was real, unless they were explicitly instructed to do otherwise. They were informed that sometimes they would be asked to fly manually straight and level for a few minutes with the purpose of obtaining a baseline measure of the physiological parameters. During the briefing, pilots received verbal instructions about the simulated aircraft model and the stall recovery template as advised by the FAA (Citation2015, p. 2), which involves the following steps:
1. Disconnect the autopilot and autothrottle/autothrust systems.
2a. Apply nose-down pitch control until impending stall indications are eliminated.
2b. Use nose-down pitch trim as needed.
3. Roll wings level.
4. Apply thrust as needed.
5. Retract speed brakes or spoilers.
6. Return the aircraft to the desired flight path.
Then, one pilot was outfitted with the physiological measuring equipment and seated in the simulator, while the other pilot waited in a different room. The simulator practice session consisted of a few minutes’ familiarization with the aircraft model (by performing basic flight maneuvers), followed by practicing recoveries from eight different upsets, in a set order, taken from the Airplane Upset Recovery Training Aid (Upset Recovery Industry Team, Citation2008). This practice session was aimed at providing a basic familiarity with the aircraft model outside the normal flight envelope, and to prevent potential excesses in stall-recovery behavior. The first four upsets involved unusual attitudes, starting with the aircraft in the following states:
35° pitch down at 5,000 ft.
22° pitch up at 5,000 ft.
35° pitch down at 37,000 ft.
120° overbank at 10,000 ft.
Next, four recoveries from aerodynamic stalls were conducted:
(5) A level flight stall at 20,000 ft.
(6) A 15° to 20° pitch-up stall at 38,000 ft (the pilots experimented with aileron inputs during the stall until the wing dropped and they recovered).
(7) A 15° to 20° pitch-up stall at 20,000 ft.
(8) A 20° pitch-down stall at 7,000 ft and at low speed.
Scenario 8 was repeated until the pilot was able to push down quickly and forcefully enough to avoid stick-shaker events, while avoiding overspeed or excessive g-load. It took pilots on average two to three times to succeed, and the maximum number of required attempts was five times. Pilots received feedback on their performance from the instructor. The angle of attack (AoA) was displayed during all scenarios except the last. Following Exercises 5 and 7, pilots were asked to fly manually straight and level for 2 min to habituate them to this task.
Unbeknownst to the pilots, the practice session transitioned into two test conditions in which the same aerodynamic stall scenario (see ) was presented, once in a surprise condition and once in an anticipation condition. The latter served as a control condition. The order of the two test conditions was counterbalanced between subjects. The two resulting groups (with order: anticipation–surprise and order: surprise–anticipation, see ) were added together for analysis.Footnote1
Figure 2. The stall recovery test scenario and the measured recovery actions.
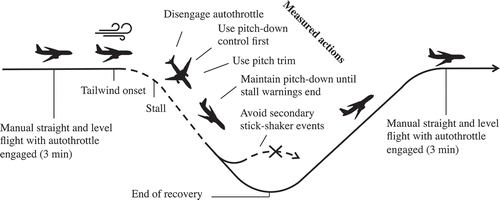
In the anticipation condition, the pilots were told that, when they crossed a landmarkFootnote2 after 3 min, an external factor would bring them into a stall. They were instructed to recover from this stall as safely as possible. The scenario occurred in accordance with the instructions. The stall was induced by creating a strong tailwind (decreasing the calibrated airspeed [CAS] by 75 kt in 5 s), and by simultaneously adjusting the pitch trim to 48% of the maximum pitch up input in 3 s time. In a post-hoc questionnaire all pilots reported that they had not been aware of any pitch trim adjustment. The simulator aerodynamic model was set to induce a slightly asymmetric stall, so that one wing would stall more quickly than the other, which results in a “wing drop” when the stall is not arrested.
In the surprise condition, exactly the same stall event was induced about 5 s before the landmark was reached. In this case, however, several measures were taken to mislead the pilots and to activate a cognitive frame that would mismatch with the stall situation. First, pilots were made to believe that the experiment would include a section about spatial disorientation. To make this more convincing, the general questionnaire that was taken before the experiment included several questions on the pilots’ experience with spatial disorientation. Also, pilots were told that the Desdemona simulator is particularly suitable for the reproduction of spatial disorientation illusions. Hence, in the surprise condition, the pilots were asked to do a climb-out above the landmark, and to pay special attention to pitch sensation as part of a potential somatogravic illusion. Finally, to further increase the mismatch between the stall event and the pilot’s active frame, their attention was taken away from the displays at the initiation of the stall. This was done by asking them to give a rating on a sickness scale that was displayed in the lower right of the cockpit, next to the throttle levers.
Performance Variables
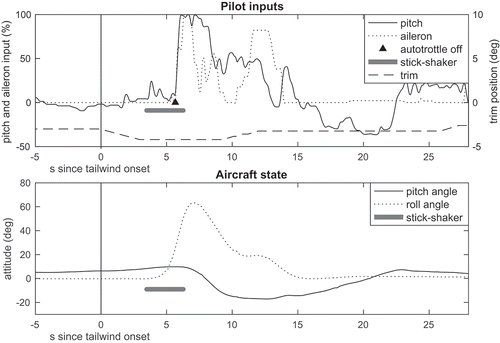
During the experiment, flight parameters were logged from the simulator at a sample rate of 100 Hz. These flight parameters were twice (forth and back) low-pass filtered using a second-order Butterworth filter with a cutoff frequency of 2 Hz. To extract the relevant data, the times of several events during the recovery were determined. First, tailwind onset was defined as the start of the externally induced decrease in CAS (and adjusting of the pitch trim). Second, to discern a pitch-down control response to the stall from normal fluctuations, the first moment after tailwind onset at which the cumulative sum of the pitch control signal moved beyond 5 SDs of its mean was determined (see, e.g., Mulder, Pleijsant, van der Vaart, & van Wieringen, Citation2000). The mean and standard deviation were obtained from 2 min of straight-and-level flight before tailwind onset. Because the standard deviations of rudder and aileron inputs before tailwind onset were sometimes zero due to the absence of turbulence, any change in rudder or aileron deflection was counted as a significant control response. Third, moments of interrupting or ending pitch-down control inputs were defined as moments at which the signal moved back to within 5 SDs from the mean. Finally, the end of the recovery was defined as the moment at which the descent stopped. The data were visually inspected to check whether each of these moments was detected correctly. The start of the significant pitch-down control input was manually reset for one pilot who gave a small (10% of maximum control deflection) pitch-down input that lasted approximately 1 s before truly starting pitching down (see ).
Figure 3. Time history of the control inputs of Participant 8 (top plot) and the aircraft’s state (bottom plot) in the surprise condition.
As the recovery from upsets can be highly dynamic and complex, it is difficult to determine a single or objective performance criterion. In line with the FAA’s (Citation2015, p. 16) recommendations, performance was evaluated by checking four criteria that were derived from the template’s principles. These criteria were created in such a way that they could be measured unambiguously in the data. Consequently, our criteria might diverge from those used for proficient recovery training. shows the four criteria that were checked using the simulator data and the corresponding steps from the FAA template described in the “Tasks and Conditions” subsection. The scoring on these performance criteria (met or unmet) was determined from the simulator data using a MATLAB script.
Table 1. Description of the four measured performance criteria, with the corresponding Federal Aviation Administration (Citation2015, p. 2) recovery template principles.
In addition to these binary variables, a number of flight parameters were collected to obtain a general impression of the stall event and the pilots’ performance profiles: response time (from tailwind onset to the first significant control input, including autothrottle disengagement, pitch, bank and rudder control), recovery duration (from the first significant control input to the end of the descent), maximum and minimum CAS, maximal rate of descent, maximal vertical g-load (Nz), duration of secondary stick-shaker events (see C3) and total altitude loss. It should be noted that these parameters are not necessarily indicative of the quality of the pilots’ performance and that the outcomes are likely to be influenced by the distraction manipulation.
Manipulation Check and Subjective Variables
As a measure of acute stress during the test scenarios, ratings of perceived anxiety were collected on an 11-point Likert-type version of the Anxiety Scale (Houtman & Bakker, Citation1989). The surprise manipulation was first checked by asking the pilots whether they had expected an upset at the landmark (yes–no). To obtain measures of the level of perceived surprise, startle, and confusion, similar 11-point Likert-type scales as the Anxiety Scale were created. For surprise and startle, the following questions were used, respectively: “Were you surprised by the upset?” and “Were you startled by the upset?”Footnote3 These could be rated from not at all (0) to very much (10). Confusion was assessed by an inversely scored item: “Did you immediately know how to respond when the upset occurred?” Overall workload during the recovery was rated on an Overall Workload Scale, ranging from 1 to 20 (see also Anthony & Biers, Citation1997).
To avoid suspicion during the experiment, subjective data were collected after the two conditions had ended. The pilots completed the questionnaires for each condition in the order in which the conditions were presented to them and did not visually compare ratings between the conditions.
Physiological Measurements
The physiological measurements were performed using Shimmer3 sensor units (Shimmer, Dublin, Ireland). Electrocardiography (ECG) was measured at 128 Hz with five electrodes placed on the pilot’s chest, which were connected to a portable data collector. Heartbeat (RR) interval durations were determined from the ECG signal using a script (Sedghamiz, Citation2014) implementing the algorithm of Pan and Tompkins (Citation1985). Artifacts in the RR intervals were removed with linear interpolation. From the resulting data, mean heart rate (HR) was obtained. The increase in mean HR (Δ mean HR) during the pilot’s response was determined by taking the mean HR over the 10 s following the pilot’s first significant control input, and subtracting a baseline mean HR measured between 130 s to 10 s prior to tailwind onset.
Galvanic skin response (GSR) data were obtained at 8 Hz using two electrodes, placed approximately 4 cm apart on the ventral side of the pilot’s left underarm, and using a portable data collector placed on a strap around the pilot’s left wrist. The data were twice band-pass filtered (forth and back) using a second-order Butterworth filter with a bandwidth of .01 to 2 Hz to eliminate drift and movement artifacts. The phasic change in the signal was obtained by measuring the peak skin conductance in the 10 s following tailwind onset, and subtracting the mean of the 10 s before tailwind onset (Boucsein, Citation2012).
Because HR and skin conductance are indicative of both stress and mental workload, the outcomes were expected to be higher in the surprise condition compared to the anticipation condition.
Statistical Analysis
Outliers, defined as values falling outside three times the interquartile range, were a priori excluded from statistical analyses (non-binary measures only). This led to the removal of one outlier with regard to the duration of secondary stick-shaker events. The effect of condition (anticipation or surprise) on the binary performance variables (i.e., meeting the criteria) was tested using GEE models of logistic regression. The effect of condition on the general flight parameters and on the pilots’ subjective and physiological (state) measures was tested with paired-samples t tests. The significance level of all analyses was set at alpha = .050. To limit potential Type I errors, the outcomes of the template adherence variables and the pilot state measures were checked separately using Holm’s sequential Bonferroni (Holm, Citation1979). Because the general flight parameters were not measured to test a hypothesis, these were not corrected in this way. Effect sizes of Cohen’s d = .2, .5, or .8 were considered small, medium, and large, respectively (Cohen, Citation1992). Effect sizes of GEE analyses were calculated by transforming B (cf. Chinn, Citation2000).
Results
Performance Examples
shows the control inputs of Participant 8 and the aircraft’s state in the surprise condition. This pilot met all criteria in the anticipation condition, but failed to meet two criteria in the surprise condition. Tailwind onset occurred at t = 0. The pilot’s first response was a maximal pitch-down control input and autothrottle disengagement at around t = 6 s. The bottom plot shows that a bank angle developed during the stall, to which the pilot immediately responded by giving maximum aileron control inputs in the opposite direction (both displayed as positive in accordance with conventions). Because pitch-down control and strong aileron inputs occurred at the same time, the pilot did not meet criterion C2 of pitching down first. The pilot also responded late (> 2 s) to the stick-shaker, meaning that criterion C3 of sufficient adjustment of loading was not met. As can be seen in the top plot of , the pilot met the criteria of using pitch trim and disengaging autopilot early.
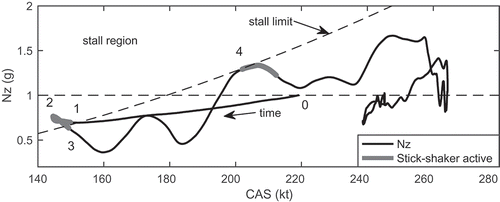
shows the V-N diagram of Participant 2 in the surprise condition to visualize a response that did not meet our criterion of sufficient adjustment of loading. In a V-N diagram, airspeed (CAS) is plotted against vertical g-load (Nz) to display the aerodynamic boundaries. Tailwind onset starts at CAS = 220 kt and Nz = 1 (event 0 in ). The tailwind reduced CAS to approximately 145 kt, which unloaded the aircraft to .7 g and elicited a stick-shaker event (1). The brief increase in Nz during the first stick-shaker event (2) can be attributed to rolling wings level in response to a wing drop (not shown). This was followed by pitch-down control, so that Nz dropped (3). However, when CAS reached 200 kt again, the pilot started loading the aircraft too aggressively and too early (Nz increases), leading to a secondary stick-shaker event (4).
Figure 4. V-N diagram of the recovery of Participant 2 in the surprise condition.
Adherence to the Recovery Template
The bitmap in provides an overview of the adherence to the four performance criteria by each pilot in the two conditions. None of the pilots met more criteria in the surprise condition than in the anticipation condition. Six pilots (30%) met an equal number of the criteria in both conditions; six pilots (30%) met one fewer criterion; three pilots (15%) met two fewer criteria; five pilots (25%) met three fewer criteria, and no pilots (0%) met four fewer criteria in the surprise condition than in the anticipation condition.
Figure 5. Bitmap of the performance criteria of each pilot. PP = participant number; C1 = disengage autothrottle early; C2 = start with pitch-down control; C3 = sufficient adjustment of loading; C4 = use pitch trim.
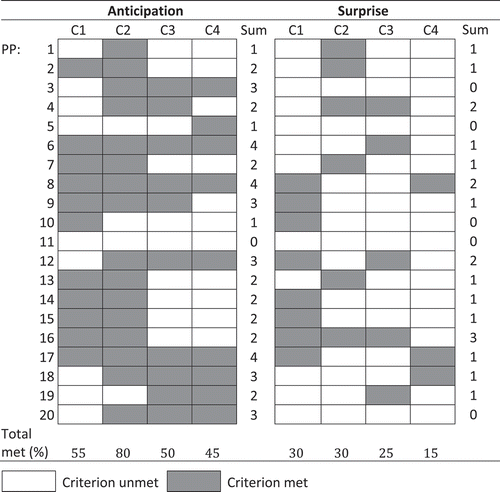
provides an overview of the GEE analyses, testing for differences between conditions for each of the performance criteria that were measured. All differences are statistically significant, with effect sizes (d) varying from medium to large, in or above the range of .5 to .8. In sum, the surprise manipulation caused a significant decrease in adherence to the criteria that were based on the recovery template.
Table 2. Criteria met in the two conditions.
Flight Parameters
summarizes the statistics of the flight parameters in both conditions. None of the participating pilots approached or exceeded critical safety limits. A number of the parameters suggested an increase in difficulty with recovering in the surprise condition. However, these were likely influenced by the distraction manipulation and thus do not necessarily suggest impaired control responses.
Table 3. The means and standard deviations of the flight parameters in the two conditions.
Subjective Ratings
An overview of the results of the subjective and physiological measures is shown in . In the surprise condition, all pilots reported that they did not expect an upset to occur at the landmark. In the anticipation condition, one pilot reported that he did not expect an upset to occur at the landmark, but instead suspected something to occur before reaching the landmark. The ratings of surprise were significantly higher in the surprise condition compared to the anticipation condition, with a large effect size (d > .8). These results indicate that the surprise manipulation was indeed successful.
Table 4. The means and standard deviations of the subjective and physiological measures in the two conditions.
In addition to surprise, ratings of startle and workload were also significantly higher in the surprise condition as compared to the anticipation condition. The difference in perceived startle constituted a large effect size (d > .80), whereas that of perceived workload was small to medium in strength (.2 < d < .5). Although perceived confusion was higher in the surprise condition, this difference did not meet significance after the Holm–Bonferroni correction. Similarly, there was no significant difference in perceived anxiety during the recovery, which suggests that surprise did not cause an increase in the participants’ level of stress.
Physiological Measures
In line with our expectations, there was a significantly larger GSR increase in the surprise condition than in the anticipation condition, with a medium effect size. In contrast, Δ mean HR did not differ significantly between the conditions. In both conditions, the mean HR increased with around 14 beats per minute at the onset of the recovery.
Discussion
In line with our conceptualization of surprise (Landman et al., Citation2017), the results of this simulator experiment show that pilots were effectively surprised when an aerodynamic stall mismatched with their expectations, and that this negatively affected their adherence to the FAA stall-recovery template. In line with previous studies (e.g., Casner et al., Citation2013; Schroeder et al., Citation2014), the outcomes show that surprise can be used in simulated environments to cause meaningful challenges to recovery performance. Although our scenarios were somewhat unrealistic so that we could achieve highly controlled experimental settings, more realistic scenarios could be created for training purposes. The proportion of pilots meeting each single criterion decreased from the anticipation trials to the surprise trials by 25 to 50 percent. A number of pilots also had difficulty meeting the performance criteria in the anticipation condition, suggesting that the instructions and the short practice session were insufficient to create recovery proficiency. Because we were limited in means and qualifications to train pilots to full proficiency, it cannot be ruled out that full proficiency would make performance resistant to surprise. Still, all pilots were able to recover without dramatic altitude loss or overspeed, indicating that their overall performance was adequate.
The subjective and physiological measures of the pilots’ state showed that our manipulation of surprise was effective. They also suggest that the surprising upset event was more startling and the recovery was mentally more demanding than the anticipated upset event. The absence of a difference in perceived anxiety between conditions suggests that the unexpectedness of the upset event was perhaps not sufficiently threatening, or that the anticipated task caused similar levels of anxiety. In each case, our results do not rule out that excessive levels of stress, which are likely present during an unexpected upset in operational practice, could severely affect recovery performance, especially if pilots are also surprised and need to reframe the situation (Landman et al., Citation2017).
One pilot noted that he “had to think for a moment and regain control” in the surprise condition. Another indicated that he felt “completely unprepared,” that he had a different “mental image” of the upcoming task and “had to switch.” Pilots also remarked that the distraction method (i.e., being asked a question and turning away from the display) was very realistic and representative of distractions in practice. Finally, it was noted that in particular the conviction that a new phase of the experiment had started took them out of “performance mode,” which made them feel unprepared and taken off guard by the stall in the surprise condition.
Our outcomes substantiate recommendations of using an element of surprise in the training of upset recovery (EASA, Citation2015; FAA, Citation2015), and indicate the importance of focusing such training on reframing and sensemaking abilities (Rankin, Woltjer, Field, & Woods, Citation2013), so that recovery skills can be made resilient against the effects of surprise. In this respect, the recommendation of using “variations in the types of scenario, times of occurrences and types of occurrence” (International Civil Aviation Organization, Citation2013, Section II-1-5), as an alternative to the use of predictable training scenarios, seems to make sense. This approach already has been shown to be beneficial to transfer of training to similar or new situations in the domain of sports (van Merriënboer, Citation1997). Future research would be necessary to confirm whether the use of unpredictability and variation in training, as well as potential other interventions, are effective in making pilot performance robust in surprising circumstances.
Notes
1 t tests and generalized estimating equations (GEE; see the “Statistical Analysis” subsection) showed that there were no significant differences between the two groups.
2 The landmark was an airfield in the surprise condition and a river in the anticipated condition.
3 The difference between surprise and startle is unambiguous in the language in which the questions were administered (Dutch).
References
- Anthony, C. R., & Biers, D. W. (1997). Unidimensional versus multidimensional workload scales and the effect of number of rating scale categories. Proceedings of the Human Factors and Ergonomics Society Annual Meeting, 41, 1084–1088. Thousand Oaks, CA: Sage. doi:10.1177/107118139704100279
- Belcastro, C. M., & Foster, J. V. (2010, August). Aircraft loss-of-control accident analysis. Paper presented at the AIAA Guidance, Navigation and Control Conference, Toronto, ON, Canada.
- Boeing Commercial Airplanes. (2016). Statistical summary of commercial jet airplane accidents, worldwide operations, 1959–2015. Retrieved from www.boeing.com/news/techissues/pdf/statsum.pdf
- Boucsein, W. (2012). Electrodermal activity. New York, NY: Plenum.
- Casner, S. M., Geven, R. W., & Williams, K. T. (2013). The effectiveness of airline pilot training for abnormal events. Human Factors: The Journal of the Human Factors and Ergonomics Society, 55, 477–485. doi:10.1177/0018720812466893
- Chinn, S. (2000). A simple method for converting an odds ratio to effect size for use in meta-analysis. Statistics in Medicine, 19, 3127–3131. doi:10.1002/(ISSN)1097-0258
- Cohen, J. (1992). A power primer. Psychological Bulletin, 112, 155–159. doi:10.1037/0033-2909.112.1.155
- de Boer, R. J. & Hurts, K. (2017). Automation surprise: Results of a field survey of Dutch pilots. Aviation Psychology and Applied Human Factors, 7(1), 28–41.
- European Aviation Safety Authority. (2015). Loss of control prevention and recovery training (Notice of proposed amendment 2015-13). Retrieved from https://easa.europa.eu/system/files/dfu/NPA%202015-13.pdf
- Eysenck, M. W., Derakshan, N., Santos, R., & Calvo, M. G. (2007). Anxiety and cognitive performance: Attentional control theory. Emotion, 7, 336–353. doi:10.1037/1528-3542.7.2.336
- Federal Aviation Administration. (2015). Stall prevention and recovery training (Advisory Circular No. 120-109A). Retrieved from https://www.faa.gov/documentLibrary/media/Advisory_Circular/AC_120-109A.pdf
- Goman, M., & Khrabrov, A. (1994). State-space representation of aerodynamic characteristics of an aircraft at high angles of attack. Journal of Aircraft, 31, 1109–1115. doi:10.2514/3.46618
- Groen, E., Ledegang, W., Field, J., Smaili, H., Roza, M., Fucke, L., … Grigoryev, M. (2012). SUPRA-enhanced upset recovery simulation. Paper presented at the AIAA Modeling and Simulation Technologies Conference, Toronto, ON, Canada.
- Holm, S. (1979). A simple sequential rejective multiple test procedure. Scandinavian Journal of Statistics, 6, 65–70.
- Houtman, I. L. D., & Bakker, F. C. (1989). The anxiety thermometer: A validation study. Journal of Personality Assessment, 53, 575–582. doi:10.1207/s15327752jpa5303_14
- International Civil Aviation Organization. (2013). Manual of evidence-based training (Doc 9995). Retrieved from http://www2010.icao.int/SAM/Documents/2014-AQP/EBT%20ICAO%20Manual%20Doc%209995.en.pdf
- Klein, G., Phillips, J. K., Rall, E. L., & Peluso, D. A. (2007). A data-frame theory of sensemaking. In R. R. Hoffman (Ed.), Expertise out of context: Proceedings of the sixth international conference on naturalistic decision making (pp. 113–155). Mahwah, NJ: Lawrence Erlbaum.
- Kochan, J. A., Breiter, E. G., & Jentsch, F. (2004). Surprise and unexpectedness in flying: Database reviews and analyses. Proceedings of the Human Factors and Ergonomics Society Annual Meeting, 48, 335–339.
- Landman, A., Groen, E. L., van Paassen, M. M., Bronkhorst, A., & Mulder, M. (2017). Dealing with unexpected events on the flight deck: A conceptual model of startle and surprise. The Journal of Human Factors and Ergonomics Society. Advance online publication. doi:10.1177/0018720817723428
- Ledegang, W. D., & Groen, E. L. (2015). Stall recovery in a centrifuge-based flight simulator with an extended aerodynamic model. The International Journal of Aviation Psychology, 25, 122–140. doi:10.1080/10508414.2015.1131085
- Martin, W. L., Murray, P. S., Bates, P. R., & Lee, P. S. (2015). Fear-potentiated startle: A review from an aviation perspective. The International Journal of Aviation Psychology, 25, 97–107. doi:10.1080/10508414.2015.1128293
- Martin, W. L., Murray, P. S., Bates, P. R., & Lee, P. S. (2016). A flight simulator study of the impairment effects of startle on pilots during unexpected critical events. Aviation Psychology and Applied Human Factors, 6, 24–32. doi:10.1027/2192-0923/a000092
- Mulder, M., Pleijsant, J. M., van der Vaart, H., & van Wieringen, P. (2000). The effects of pictorial detail on the timing of the landing flare: Results of a visual simulation experiment. The International Journal of Aviation Psychology, 10, 291–315. doi:10.1207/S15327108IJAP1003_05
- National Transportation Safety Board. (2010). Aviation accident report: Loss of control on approach Colgan Air, Inc. operating as Continental Connection Flight 3407 Bombardier DHC-8-400, N200WQ (Tech. Rep. No. NTSB/AAR-10/01 PB2010-910401). Washington, DC: Author.
- Pan, J., & Tompkins, W. J. (1985). A real-time QRS detection algorithm. IEEE Transactions on Biomedical Engineering, 3, 230–236. doi:10.1109/TBME.1985.325532
- Rankin, A., Woltjer, R., & Field, J. (2016). Sensemaking following surprise in the cockpit—A re-framing problem. Cognition, Technology & Work, 18, 623–642. doi:10.1007/s10111-016-0390-2
- Rankin, A., Woltjer, R., Field, J., & Woods, D. D. (2013, June). “Staying ahead of the aircraft” and managing surprise in modern airliners. Paper presented at the 5th Resilience Engineering Symposium: Managing trade-offs, Soesterberg, The Netherlands.
- Rivera, J., Talone, A. B., Boesser, C. T., Jentsch, F., & Yeh, M. (2014). Startle and surprise on the flight deck: Similarities, differences, and prevalence. Proceedings of the Human Factors and Ergonomics Society Annual Meeting, 58, 1047–1051. doi:10.1177/1541931214581219
- Sarter, N. B., Woods, D. D., & Billings, C. E. (1997). Automation surprises. Handbook of Human Factors and Ergonomics, 2, 1926–1943.
- Schroeder, J. A., Bürki-Cohen, J., Shikany, D. A., Gingras, D. R., & Desrochers, P. (2014, January). An evaluation of several stall models for commercial transport training. Paper presented at the AIAA Modeling and Simulation Technologies Conference, Washington, DC.
- Sedghamiz, H. (2014). Complete Pan Tompkins Implementation ECG QRS detector. Retrieved from http://nl.mathworks.com/matlabcentral/fileexchange/45840-complete-pan-tompkins-implementation-ecg-qrs-detector
- Spielberger, C. D., Gorsuch, R. L., & Lushene, R. E. (1970). Manual for the State–Trait Anxiety Inventory. Palo Alto, CA: Consulting Psychologists Press.
- Upset Recovery Industry Team (2008). Airplane Upset Recovery Training Aid, Revision 2. Washington, DC: Federal Aviation Administration & Airline Industry. Retrieved from https://flightsafety.org/wp-content/uploads/2016/09/AP_UpsetRecovery_Book.pdf
- van Merriënboer, J. J. G. (1997). Training complex cognitive skills: A four-component instructional design model for technical training. Englewood Cliffs, NJ: Educational Technology Publications.
- Young, M. S., & Stanton, N. A. (2002). Malleable attentional resources theory: A new explanation for the effects of mental underload on performance. Human Factors: The Journal of the Human Factors and Ergonomics Society, 44, 365–375. doi:10.1518/0018720024497709