
ABSTRACT
Grasses and fire pose a major challenge for forest restoration. Here we evaluate a case study of reforestation in an area invaded by the tall invasive grass Saccharum spontaneum in the Panama Canal Watershed. The project objectives were to (1) replace Saccharum with a forest, (2) restore a stratified mixed species forest and (3) sequester carbon. We aimed to compare the practice of forest restoration with a treatment grounded in theory. Therefore, the first species selection method followed business-as-usual: contractors planted any combination of 130 prescribed species. The second method followed the framework species approach, a mixture of 22 species was planted to ensure early shade, create a stratified forest over time, attract seed dispersers, and for their potential to fix N2. Both treatments showed successful restoration trajectories 8.5 years after planting, they did not differ in structural characteristics (stem density, basal area, aboveground biomass, height, and amount of Saccharum). However, based on the species present, the framework approach shows more potential to become a stratified forest. As the framework approach also withstood fires much better than the business-as-usual approach, we conclude that it improves restoration success in this human-dominated landscape.
Introduction
Reforestation can be aimed at restoring a variety of forest ecosystem services, going beyond carbon sequestration to include water flow and quality (Farley et al., Citation2005; Ogden et al., Citation2013), biodiversity (Harrison et al., Citation2003) and livelihoods to address rural poverty (Groom & Palmer, Citation2012; Holmes et al., Citation2017; Weston et al., Citation2015). In central Panama, the Panama Canal Watershed (PCW) is of vital importance as the watershed provides potable water for half of the citizens in Panama (Stallard et al., Citation2010). The canal is also a crucial economic driver for the country, accounting for 30% of the country’s gross domestic product and providing 290,000 jobs (Cortizo, Citation2019). For every transit, 200,000 cubic meters of fresh water are released into the oceans, which equals the daily domestic consumption of approximately 500,000 Panamanians (Carse, Citation2012; Stallard et al., Citation2010). Roughly 50% of the area is deforested however and urban expansion along the two major highways is fragmenting the forest remaining between Chagres and Soberania National Parks in the eastern watershed (Hall et al., Citation2015; Rompré et al., Citation2008).
The invasive non-native grass species Saccharum spontaneum L. (hereafter Saccharum) poses a particular challenge to forest restoration in the PCW and already covers approximately 3% of the watershed by itself (ACP-ANAM, Citation2006). Saccharum grows 3–4 m tall and quickly forms impenetrable monocultures on abandoned agricultural areas and along human transportation corridors (Bonnett et al., Citation2014; Kim et al., Citation2008; Hooper et al., Citation2005, Citation2004). Like many other invasive grasses (e.g., Holl et al., Citation2001; Lambert et al., Citation2010; MacDonald, Citation2004; Thaxton et al., Citation2012), it functions as a strong barrier to further forest succession and keeps the system in a grass-dominated state (Suding et al., Citation2004; Vitousek et al., Citation1997) that provides limited ecosystem services compared to forests (Hall et al., Citation2015; MacDonald, Citation2004) and very little useful habitat for wildlife (Bonnett et al., Citation2014). Saccharum prevents the establishment of forest tree species through competition and by facilitating recurring anthropogenic dry season fires (Hooper et al., Citation2005; E. R. Jones et al., Citation2004; Saltonstall & Bonnett, Citation2012). Fire spreads quickly through Saccharum stands, killing most tree seedlings and saplings. Saccharum itself grows back to pre-fire live aboveground biomass levels within 6 months after a major fire, outcompeting all other surviving or newly colonized tree seedlings species (Saltonstall & Bonnett, Citation2012). Forest restoration under these conditions, therefore, requires active tree planting in combination with fire prevention measures. When the planted trees grow tall enough, they can eliminate the grasses through shading (Craven et al., Citation2009; Hooper et al., Citation2005) and thus reduce the probability and intensity of fires. In addition, the planted trees may help overcoming dispersal limitations by attracting seed dispersers and thus promoting further succession (Hooper et al., Citation2002, Citation2005; Jones et al., Citation2004).
The Panama Canal Authority (ACP) manages water resources in the PCW and it is implementing reforestation projects to increase forest cover and improve degraded areas (Cerezo, Citation2011; Hall et al., Citation2015). They are a leader in reforestation within Panama, and their program has been seen as a potential model for other countries within the region (e.g., Hall, Citation2017; Hall & Román, Citation2017). Additionally, a public-private agreement was set up in Panama in 2014 to restore one million hectares of forest in 20 years (Alianza Por El Millon, http://www.alianzaporelmillon.org/). The main goals of this government-led initiative are to combat climate change through reforestation by contributing to carbon sequestration on a national scale (MiAmbiente, Citation2019). For these initiatives to be successful, knowledge of the best restoration practices is essential. Yet over the years, not all ACP projects have been successful. Therefore, the aim of this study was to gain insights into improving forest restoration in the region.
In 2009, the Smithsonian Tropical Research Institute (STRI), the ACP and what is now the Ministry of the Environment of Panama (MiAmbiente) undertook a project to reforest an area invaded by Saccharum within the boundaries of Soberanía National Park, a forested park adjacent to the Panama Canal. The three main objectives of the reforestation project were (1) to eliminate the Saccharum and replace it with forest, (2) to restore a stratified, mixed species forest with a structure and conservation value similar to and consistent with the management objectives of Soberania National Park, and (3) to sequester carbon. It was further hoped that the elimination of the Saccharum stands would reduce the fire risk for the older forests adjacent to the reforestation site. The performance of two alternative species selection methods in relation to these objectives is tested in this study to compare the status quo for reforestation in Panama (business-as-usual) with a methodology designed by restoration scientists.
Successful large-scale restoration must be based on proven, scalable approaches (Menz et al., Citation2013). Therefore, we aimed to gain more insight into the best restoration practices in the region. Tree planting combined with cleaning of all vegetation around the focal species and fire prevention has been shown to eliminate Saccharum in a small-scale research project (2.8 ha) with monocultures of two species (Craven et al., Citation2009). In this case study, this method is scaled up, outsourced to experienced local contractors, and includes a more diverse set of species to achieve the three above stated objectives and to compare reforestation theory to reforestation practice. The first approach, therefore, followed “business-as-usual,” contractors could plant any combination of species from a list that is used in ACP funded reforestation projects in the region and where the list has been established through years of experience (included in Table S1). The alternative approach used the framework species method (Elliott et al., Citation2003; Goosem & Tucker, Citation1995), with species selection based on growth and mortality data from a species selection trial in the same area (van Breugel, Hall et al., Citation2011; Wishnie et al., Citation2007). The framework species method is based on the idea that a functionally diverse set of species is important for ecosystem functioning (Tilman et al., Citation1997) and that this diversity may increase the chances of success in reforestation efforts (Aerts & Honnay, Citation2011; Laughlin, Citation2014; Suding et al., Citation2008). Both treatments are compared to a mature forest nearby, to show what they should develop into in the future. They are also compared to another area in the PCW where no Saccharum is present and forest was allowed to grow back through natural regeneration, studied in a separate study (van Breugel et al., Citation2013).
Materials and Methods
Reforestation area
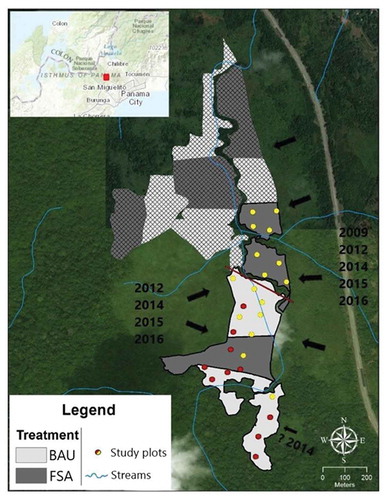
The reforestation area originally spanned 61 ha within the Soberania National Park in the Panama Canal Watershed, Republic of Panama (9°05ʹ N, 79°36ʹW) (see ). Soberania National Park is approximately 22,000 ha and consists mostly of old (>80 years) secondary tropical seasonal moist forest (Wishnie et al., Citation2007). The study area had been cleared for agricultural practices in the 1960s, has not been farmed since the 1990s and was dominated by Saccharum in 2009 (Wishnie et al., Citation2007). The study area is also located directly adjacent to the PRORENA species selection trial in Soberania National Park (east of the highway in ), an area of relatively fertile soils that are predominantly clay or silty clays (Hall & Ashton, Citation2016; van Breugel, Hall et al., Citation2011; Wishnie et al., Citation2007). It receives a mean annual rainfall of 2239 ± 146 mm and has 3.8 ± 0.4 dry months (months with <100 mm rainfall) (van Breugel, Hall et al., Citation2011).
Figure 1. The reforestation area. Species selection followed the framework species approach (FSA) or the business-as-usual approach (BAU), depicted in different gray shades. The top, cross-barred part of the map was planted too late into the wet season in 2009 and too little survived for further research. Study plots, represented by the dots, were established in the surviving area in 2011. Arrows show the directions from which the fires came in, including the years they happened. Yellow dots represent the plots that still existed in 2018, red squares were destroyed by fires between 2011 and 2018. The plots south of the red line were taken into account in the fire resistance analysis
Study design and establishment
In 2009, all 61 ha were cleared of Saccharum and planted with seedlings of 15– 60 cm tall, in a 3 by 3 m spacing. The seedling sites were fertilized by placing a mixture of soil with organic matter and fertilizer in the bottom of each hole. Half of the area was planted with the “business-as-usual” approach, where experienced contractors selected the mix of species. The list they could choose from includes 70 common names of species, which translate to 130 scientific names (Tree Atlas of Panama, n.d.) (see Table S1 for the full species list). It is dominated by fast growing, short-lived species such as Miconia argentea and Guazuma ulmifolia, but also includes large, long-lived tree species such as Terminalia amazonia and Swietenia macrophylla. Early successional, small-seeded species are often preferred in reforestation projects as the seeds are abundant, seedlings are easy to produce and trees can establish canopy cover quickly (Brancalion et al., Citation2018; Chazdon, Citation2008), but there were no prescriptions on which species to use.
Species selection for the other half of the reforestation area was based on the framework species approach (Elliott et al., Citation2003; Goosem & Tucker, Citation1995), with emphasis on tree species that were expected to provide early shade, create a stratified forest over time, and attract seed dispersers. Species choice was based on growth in adjacent PRORENA species selection trials (Hall & Ashton, Citation2016). N2 fixers (e.g., Glirisidia sepium, Erythryna fusca, and Inga punctate) were included as well as large seeded bird and mammal dispersed species (e.g., Dipteryx panamensis). Inga punctata and Muntingia calabura were also planted, as they were shown to be particularly important for attracting seed dispersing birds by Jones et al. (Citation2004). The final species selection included three different pre-mixed combinations of 22 species at specific densities (see Table S1). Species were pre-mixed in nursery trays prior to sending to the field for planting to avoid all individuals of one species being taken to the same area resulting in uneven coverage of planting (the mixtures are included in Table S2). The seedlings for the framework species approach came from the STRI nursery in order to ensure availability while the seedlings for the business-as-usual approach were bought from local nurseries following ACP policy for reforestation projects. Thus, the two methods differed in that the framework approach prescription ensured planting of an exact number of individuals of each species per hectare (included in Tables S1 and S2) and the seedlings may have differed in quality. The reforestation area, as well as the layout of the treatments, is shown in , with three blocks of each treatment surviving after 1 year (see below).
The area was selectively cleaned in the first 2 years after planting to promote seedling growth, at 2 to 4 months intervals. All weeds and grass (mainly Saccharum) were cut but all newly recruited woody individuals were left. Fire prevention activities were undertaken during the first 2 years after planting with fire breaks also cut in years three and four. Planting, weeding, and fire maintenance were all implemented by contractors, as is commonly the case in ACP supported reforestation efforts. Initial planting was done very poorly with many blocks planted late in the wet season. First year seedling mortality was very high as a result, leaving only half of the area suitable for research (Weber & De Liones, Citation2010) ().
Measurements
In January 2011, roughly 1.5 years after planting, 26 plots of 10 × 10 m were established in the surviving area (15 for the business-as-usual approach, 11 for the framework species approach). All woody stems with a height of more than 20 cm were tagged, identified, and measured in the plots. Measurements taken were: basal diameter at 10 cm, dbh (diameter at 1.30 m) and height. In January and February of 2014 and 2018, plots were remeasured (they were then 4.5 and 8.5 years old). Eleven of the initial 26 study plots were destroyed by fires between 2014 and 2018 and were thus not remeasured in 2018 (red cirlces in ). In addition, in 2014 and 2018, the number of dead and live Saccharum stems were counted in five 0.5 × 0.5 m quadrants within each 100 m2 plot to track changes in grass over time. Four of these quadrants were established at 0.5 m from every corner and one in the middle of the plot, following Bonnett et al. (Citation2014). Palms and lianas were only included in the 2018 census and therefore excluded from further analyses.
To assess whether the area is on a trajectory to achieve the reforestation goals, four 1-ha mature secondary forest plots in the adjacent Soberania National Park were used as reference mature ecosystem. The plots were measured as part of the Agua Salud Project (Stallard et al., Citation2010), following census methods as described in Condit (Citation1998). All individuals with a dbh ≥ 10 cm were measured in the whole plot and all individuals with a dbh ≥ 1 cm in 4 core plots of 20 × 20 m.
Additionally, the treatments were compared to a naturally regrowing young secondary forest at the same ages (1.5; 4.5 and 8.5 years old) from a nearby study for some of the structural characteristics (van Breugel et al., Citation2013 and unpublished data, part of the Agua Salud Project). The two areas are very similar in terms of rainfall, slope, and proximity to mature forest, but Saccharum was not present in the Agua Salud Project plots. This made it possible to compare these two reforestation treatments to a similar forest without the competition with the grass. No active planting was performed in the Agua Salud secondary forest research plots, natural regeneration took place after taking away previous disturbances from agricultural/pastoral use. See van Breugel et al. (Citation2013) for measurement methods.
Data analysis
Treatment performance
Several structural characteristics were compared between the treatments and the mature forest to measure progress toward the goal of reestablishing a mixed species, stratified forest. Maximum height per plot was calculated by taking the average of the five tallest individuals. Aboveground biomass (AGB) was calculated per plot per year in the reforestation plots using a locally derived model (model 2 by van Breugel, Ransijn et al., Citation2011), including all individual trees with a dbh ≥ 1 cm. In the mature system, AGB of trees was calculated using two allometric equations: one for trees with a dbh ≥ 1 cm and < 5 cm (van Breugel, Ransijn et al., Citation2011) and another for AGB and tree height, for trees with a dbh ≥ 5 cm (Chave et al., Citation2014) as trees are larger than those covered by the equation by van Breugel, Ransijn et al. (Citation2011), but Chave et al. (Citation2014) only include trees >5 cm dbh. Sapling data (1 cm > dbh ≤ 10 cm) from the core part of the mature plots were converted to a per hectare basis and then added to the individuals ≥10 cm from the one-hectare plots, to reconcile methods with the reforestation plots and include all trees of >1 cm dbh in AGB calculations. Wood density (g/cm3) was derived locally when available (van Breugel, Ransijn et al., Citation2011), if not regionally (Wright et al., Citation2010) or from the information on South and/or Central America in the Global Wood Density Database (Zanne et al., Citation2009). When no information was found for a given species, the average of the genus (or when the genus was not found either, the average of the family) was used based on the entries on Central and/or South America in the Global Wood Density Database.
Recruitment and survival of all individuals in the plots were calculated per plot and subsequently compared per treatment per time-interval (2011–2014 or 2014–2018). Recruitment was calculated as fraction of the total number of trees per plot that was not yet present in the plot in the previous census. Survival was calculated as the fraction of the total number of trees per plot that was still alive in the next census.
Additionally, plots were compared in terms of tree species composition similarity in an NMDS ordination and the positions of all sites along the ordination axes were calculated. NMDS ordinations were based on similarity matrices generated from the Jaccard abundance-based index.
Future stratification
To assess what the forest stratification might look like in the future, species were classified into three categories based on their maximum possible height as reported in the literature (Condit et al., Citation2010; Pérez, Citation2008; Perez & Condit, Citationn.d.). “Small” included all species that will never grow any taller than 15 m, “medium” included all species with a maximum height >15 m and <30 m and “large” included all species of ≥30 m. Only individuals with a dbh of at least 2.5 cm in the 2014 census were included, as the individuals that had not yet reached that size by then will probably not make it to the canopy. The number of individuals in each of the height classes was calculated per treatment per year. The same height classes were assigned to all adult trees (dbh ≥ 10 cm) in the mature forest based on their estimated height and relative abundance of the height classes was calculated.
Comparing to an area of natural regeneration without Saccharum
To study the performance of the active restoration treatments, the reforestation plots were compared to an area of natural regeneration without Saccharum. Methods by van Breugel et al. (Citation2013) differ slightly from the current study as only individual stems with a dbh ≥ 1 cm were measured. Therefore, only stems of ≥1 cm dbh from our study plots were included in this comparison. Plots were compared for stem density, basal area, and diversity. Hill numbers were used to measure different aspects of diversity, as they give the effective number of species of a community (see van Breugel et al., Citation2013). 0D was calculated per ha for all the plots, which is the number of species per unit sample area (species density), as well as 1D which is the exponential of Shannon entropy and weights species proportionally to their abundances.
Fire resistance
Fire was a known risk at planting (Saltonstall & Bonnett, Citation2012) such that fire vigilance was meant to be an integral part of the reforestation plan. Unfortunately, post-planting fires still burned a large part of the area. Taking advantage of this setback, plots that survived the fires were compared to those that were destroyed for basal area, biomass, and number of Saccharum stems in 2014 (the last measurements before many plots were affected). Both planting treatments were grouped together due to low survival in the business-as-usual treatment ().
Statistical analyses
All structural attributes were compared between treatments over the years using one-way ANOVAs. When the effect was significant, Tukey-Kramer’s post hoc test was carried out for mean separation. Recruitment and survival were compared between treatments per year using two-way t-tests. Future forest stratification was compared with Pearson chi-squared tests, using the adjusted residuals to test for individual cell contributions. Fire resistance was compared using two-way t-tests. All data were tested for normality and homogeneity of variance of the residuals before testing and the response variables were transformed when appropriate using a box-cox transformation (Box & Cox, Citation1964). Statistical analyses were conducted using R version 3.5.2 (R Core Team, Citation2018).
Results
Progress toward restoration of a forest
In both treatments a significant increase in basal area was found between 1.5 and 8.5 years after planting (one-way ANOVA, F6,64 = 28.83, p < .001), as well as aboveground biomass (one-way ANOVA, F6,64 = 74.22, p < .001) and maximum plot height (one-way ANOVA, F6,64 = 123.57, p < .001) (). Although, as expected, all three were markedly lower than the mature forest (). There were no differences in these parameters between the treatments across all ages (Tukey-Kramer post hoc, p > .05). The number of Saccharum stems decreased between 4.5 and 8.5 years after planting (one-way ANOVA, F3,37 = 6.02, p < .01), although not significantly in the framework species approach (Tukey-Kramer post hoc, p = .07).
Table 1. Mean ± SE per treatment per year of stem density, basal area, aboveground biomass (AGB), maximum plot height, number of alive and dead stems of Saccharum, recruitment, and survival. Different letters indicate significant differences (Tukey-Kramer post hoc p < .05 after significant one-way ANOVA, t-test p < .05 for recruitment and survival)
Stem density greatly exceeded the original planting density (1100 stems per ha) for both reforestation treatments. The framework species approach had a significantly higher stem density than the business-as-usual approach at 1.5 years after planting. In both treatments the stem density did not change significantly over time. Stem density of the mature forest was only significantly lower than the reforestation plots in the framework species approach at 1.5 years after planting (one-way ANOVA, F6,64 = 5.40, p < .001).
Recruitment did not differ between the two treatments after 4.5 years (t-test, t = 0.95, df = 24, p = .35) or 8.5 years (t-test, t = 0.91, df = 13, p = .38), nor did survival (4.5 yrs: t-test, t = −0.44, df = 24, p = .66 and 8.5 yrs: t-test, t = −0.96, df = 13, p = .35).
When comparing diversity in terms of species density and Shannon entropy, the business-as-usual treatment has a lower value across all years ( note the difference with as here only stems with ≥1 cm dbh were included for comparison with the Agua Salud plots). The NMDS ordination graphs show that both treatments are very similar in terms of their tree species composition (Figure S1): both treatments occupy the same space along the first two ordination axes, even though plots within the treatments do differ along those axes. The plots that still survived in 2018 are even more similar to each other in terms of tree species composition, especially so for the surviving business-as-usual-plots which are located in the center of the ordination axes 1 and 2.
The treatments did differ significantly in their potential development over time based on the possible maximum height of the species present in 2014. The business-as-usual approach had more class small trees and less medium trees compared to the framework species approach (χ2 = 20.20, df = 2, p < .001). In the business-as-usual approach, the relative abundance of small trees that would never grow more than 15 m in all plots was 58.8%. The abundance of medium-sized trees (≥15–29 m) was only 27.7% and potential large trees (≥30 m) made up 13.5% of all trees. The framework species approach, on the other hand, had fewer small trees (34.4%) and the medium-sized trees were the largest size class with 48.1%. In this approach, 17.5% of all trees had the potential to grow over 30 m. Both the business-as-usual and the framework species approach had similar relative abundances to the mature system (small – 59.5%; medium – 39.0%; large – 1.5%), although the framework species approach had less small than medium-sized trees and both had a higher relative abundance of large trees than the mature forest.
Performance compared to natural regeneration
When the reforestation treatments are compared to natural regeneration in the absence of Saccharum, it is shown that both treatments have a much lower basal area and stem density after 4.5 years of succession already (). They also have a lower species density and Shannon entropy (). Additionally, when only stems ≥1 cm dbh are included (compared to where all stems of >20 cm tall are included), the business-as-usual treatment has a lower stem density and basal area, as well as a lower species density and Shannon entropy (mentioned above) across all years, except for basal area at 1.5 years.
Figure 2. Mean ± CI per treatment per year of basal area, stem density, and species number and Shannon entropy based on Hill’s numbers (0D and 1D) for business-as-usual (black dots; n = 15-15-6 at age 1.5–4.5-8.5 yrs, respectively), the framework species approach (gray dots; n = 11-11-9 at age 1.5–4.5-8.5 yrs, respectively) and for comparison the data from a nearby area (Agua Salud) without active planting and without any Saccharum present (white dots; n = 20-41-72 at age 1.5–4.5-8.5 yrs, respectively)
Figure 3. Mean ± SE basal area, aboveground biomass (AGB) and number of alive plus dead Saccharum stems in 2014 in plots that would be destroyed by fires (n = 11) or not (n = 7) before the next census in 2018. Unlike letters indicate significant differences (t-test, p < .05)
Fire resistance
In 2018, 11 of the initial 26 study plots were severely affected or completely destroyed by fires (red squares in ). We used this setback to study fire resistance of both treatments. While fires repeatedly threatened all areas, only 40% of the business-as-usual plots survived the fires, whereas 82% of the framework species plots survived. The plots that survived had a significantly higher basal area (t-test, t = 2.72, df = 16, p < .05) and aboveground biomass (t-test, t = 3.80, df = 16, p < .01) in 2014 than the plots that had not survived (). Additionally, the surviving plots had a significantly lower number of Saccharum stems (t-test, t = −2.25, df = 16, p < .05) ().
Discussion
Reforestation has gained significant recent attention as a mechanism to mitigate the effects of climate change and restore ecosystem services (e.g., Bastin et al., Citation2019; Griscom et al., Citation2017; H. P. Jones et al., Citation2018). Yet to meet the goals set by regional, national, and global initiatives for reforestation, it is important to undertake research to advance “best” practices as well as to evaluate the success of restoration projects (Menz et al., Citation2013; Reid et al., Citation2017). In this case study, the commercialization of reforestation was evaluated, to restore forest in a Saccharum-invaded area by planting trees, cleaning the grass, and preventing fires in the first years.
Two species selection methods were tested to compare theory to practice: the framework species approach (Elliott et al., Citation2003; Goosem & Tucker, Citation1995) and the “business-as-usual” approach, where species were selected like all ACP funded reforestation projects in the region. The research reported herein shows that these methods can successfully replace even an aggressive grass like Saccharum spontaneum with a forest, supporting other studies (e.g., Celis & Jose, Citation2011; Craven et al., Citation2009; Holl et al., Citation2001). However, on the long term, the business-as-usual approach might lack the trees necessary to form a stratified forest and is more prone to be destroyed by fires in the first years after planting.
As a case study, the individual species that were planted for successful restoration are not the most important conclusion of this study as the species that can achieve the desired framework-role will be very different across areas (de Almeida & Viani, Citation2019). It is the way of approaching the selection of species for similar reforestation projects that was shown to work: even though the business-as-usual approach seems to perform well, including important framework species can markedly improve restoration success. The performance of both treatments in meeting the three goals of the reforestation project is discussed below.
Replace Saccharum with a forest
While species selection for the framework species approach was based on more data, the business-as-usual approach was also based on previous experience. Both treatments showed steady growth over time in terms of basal area, aboveground biomass, and maximum height as well as progress in eliminating Saccharum (). Both treatments had an extremely high establishment of new seedlings: 1,100 stems were planted per hectare, but 1.5 years after planting 4,420 ± 698 and 9,827 ± 1,150 (mean ± SE) stems per hectare were measured in the business-as-usual approach and the framework species approach, respectively. As expected, neither treatment was anywhere close to the mature reference forest however, emphasizing the long time span of reforestation (e.g., Poorter et al., Citation2016; Rozendaal et al., Citation2019). Perhaps more informative is that the mean values for stem density and basal area of the reforestation treatments after 8.5 years were both approximately half those found in young secondary forest of the same age in a nearby secondary forest study site where Saccharum is not present (). The markedly lower values for structural characteristics as compared to those of the nearby secondary forest study are likely due to intense competition with the aggressive grass (Craven et al., Citation2009).
Restore a stratified mixed species forest
The treatments did differ in their future forest stratification: the business-as-usual approach had relatively more small individuals and fewer medium-sized individuals. Small pioneers in high densities such as Vismia, Cecropia, and Guazuma have been shown to halt or arrest succession to a mature forest (Arroyo-Rodríguez et al., Citation2017; Jakovac et al., Citation2014; Martínez-Garza & Howe, Citation2003; Mesquita et al., Citation2001) and this is potentially a risk in the business-as-usual treatment. Community development will have to be monitored in the coming years to make sure this is prevented. The framework species approach, on the other hand, had relatively fewer small individuals and more medium-sized individuals and may develop into a more stratified forest over the years. Nevertheless, both treatments showed a stratification pattern similar to the mature forest and both had a relative abundance of large trees far above the mature forest (13.5% for business-as-usual and 17.5% for the framework species approach, compared to 1.5% in the mature forest). The relative abundances of the height classes were calculated differently in the reforestation plots and the mature forest, however, as explained in the methods. The abundances in the restoration plots reflect potential maximum heights, whereas the abundances in the mature forest reflect actual heights (estimated from their dbh). This difference in classification will always lead to lower amounts of trees classified as “Large” in the mature forest, because there might be many trees that could in theory grow more than 30 m but did not yet grow to their maximum height.
In terms of restoring a mixed species forest, the recovery of diversity of both treatments is lagging behind on natural regeneration in a similar area of young secondary forest, in terms of species density as well as Shannon entropy (). The plots from the Agua Salud area were chosen such that they lie within similar distance to the mature forest as the reforestation study site (in terms of distance to a seed source). However, in Agua Salud, there are more strips of forest fragments along the streams and also more trees dispersed within the pastures than there are in our reforestation study site. This might (partly) account for the higher number of species. Even so, when looking at just the two reforestation treatments in , neither treatment increases much over the years or even decreases between 4.5 and 8.5 years after planting so neither are showing much recovery of diversity over the years.
The treatments were also compared in terms of tree species composition using an NMDS ordination (Figure S1). The treatments show much overlap along both axes, showing a high similarity in species composition between the two reforestation treatments. This can be explained by the high number of trees that seeded in after planting. The plots of the business-as-usual-treatment that survived up to 2018 do cluster together strongly in the middle of the ordination axes and thus do not show a diverse species composition. This is an indication that some mixtures of species planted in the business-as-usual approach could withstand the fires, whereas other mixtures of tree species could not.
Sequester carbon
The aboveground biomass increased since planting of the seedlings, sequestering increasing amounts of carbon. There was no significant difference between treatments, in 2018 the business-as-usual approach held on average 24 t/ha and the framework species approach held 29 t/ha of biomass. To put this into perspective, the mature forest had a mean estimated AGB of 257 t/ha. The naturally recovering secondary forest on abandoned pastureland in the Agua Salud Project sequestered an estimated 42 t/ha in 7 years (Hall et al. unpublished data) and within just 6 months a monoculture of Saccharum can grow approximately 20 t/ha of live biomass, returning to its pre-fire state (Saltonstall & Bonnett, Citation2012). As discussed above for stem density and basal area, the relatively slow increase in biomass compared to other tropical forest systems (see, e.g., Poorter et al., Citation2016) is probably due to the competition with Saccharum. Even though mechanical cleanings were performed in the study area, this by no means eliminated the Saccharum completely. Increasing the amount of mechanical cleaning of Saccharum combined with herbicide application can speed up tree growth (Craven et al., Citation2009), which could increase carbon sequestration in similar reforestation projects.
Using the setbacks for an analysis of fire resistance
Forest fires impact millions of hectares of rainforest, increasing deforestation rates and seriously affecting human health, economy, and the environment (Cochrane, Citation2002, Citation2003; Nepstad et al., Citation1996). In grass-dominated areas like this, their high susceptibility to fires threatens restoration success (MacDonald, Citation2004; Saltonstall & Bonnett, Citation2012). Indeed, post-planting a fire burned the area directly adjacent and east of the plantation and fires burned from both sides (east and west) in the dry season of 2012, the last year of protection afforded by the original contract. While further fire control contracts were issued, they were poorly implemented, and fires burned through areas east and west in the dry season of 2014, 2015, and again in 2016, the latter two being El Niño years. The contractors were severely sanctioned for poor performance (payments cut in 2016 and loss of ability to participate in future ACP bidding post-2017 performance) but sanctions were too late to avoid loss with fires destroying or severely affecting many study plots south of the red line in .
The fires did allow for an analysis of fire resistance. Plots that survived the fires had a significantly higher basal area and AGB than the plots that were destroyed (). The higher tree cover coincided with a lower abundance of Saccharum stems in the plots that survived ().
Most of the plots lost by fires were from the business-as-usual approach (9 out of the 11 plots lost). In the framework species approach, the mixture of species was the same throughout the whole area. Many individuals seeded in, resulting in diverse species compositions already in 2011 (Figure S1a), but the key species were present to prevent fires from raging through the plots. Even though the contractors had to plant a mixture of species in the business-as-usual treatment as well, there were no prescriptions on evenness of species planted across the area, resulting in different species compositions in different parts of the reforestation area. The parts of the business-as-usual approach where forest cover established rapidly withstood the fires, but other parts with a different species composition did not, as shown in Figure S1c. Being smart by choosing the right mixture of species (especially including species that provide early shade in fire prone systems) and planting this evenly across the reforestation area is thus critical to reforestation success, as shown by this case study. This is particularly important given the predicted increase in severe droughts (and thus increase risk of fire) predicted for the region (Intergovernmental Panel on Climate Change, Citation2014). The species that can achieve this will be different across different sites, however, as acknowledged by De Almeida and Viani (Citation2019).
Problems in the commercialization of reforestation
The scaling up and commercializing reforestation to 61 ha, a relatively small scale in and of itself compared to other reforestation projects (like Freitas et al., Citation2019), posed problems. Half of the area was lost after the first year because the seedlings were planted too late in the wet season to establish and survive the dry season. This represents a significant waste of money and resources that should have been prevented. However, straightforward and obvious it might be, it is worth stressing that good implementation is an essential first step that is all too often overlooked, even by experienced reforestation contractors. Post establishment almost another half of the study plots was lost due to fires, mostly in the business-as-usual approach. Both problems could be overcome by more extensive monitoring of the contractors performing the reforestation, perhaps including randomized sampling that includes data collection and checklists accompanied by performance-based quality indicators that must be achieved in order to receive payment. This can improve implementation and ensure an even mixture of species is planted throughout the area in a timely manner.
Supplemental Material
Download MS Word (231.1 KB)Acknowledgments
This work is a contribution of Smart Reforestation® and the Agua Salud Project of the Smithsonian Tropical Research Institute (STRI). Agua Salud is part of ForestGEO and is a collaboration with the Panama Canal Authority (ACP), the Ministry of the Environment (MiAmbiente) of Panama, and other partners. We thank Anabel Rivas, Julia Gonzales, Guillermo Fernandez, and Pedro Gonzalez for data collection and processing. The ACP funded the reforestation as part of a program aimed at eliminating Saccharum spontaneum in the PCW. Field work was supported by the Hoch Family, Stanley Motta, and the Silicon Valley Foundation with additional support from the Lloyds Tercentenary Research Foundation and the Working Land and Seascapes Program of the Smithsonian Institution Conservation Commons. LEB received financial support from the U/Select fund and the Alberta Mennega Foundation. Authors have no conflicts of interest to disclosure.
Disclosure statement
Authors have no conflicts of interest.
Supplementary material
Supplemental data for this article can be accessed on the publisher’s website.
Additional information
Funding
References
- ACP-ANAM. (2006). Componente de Cobertura Vegetal, Región Oriental de la Cuenca del Canal. Panama Canal Authority. http://www.pancanal.com/esp/cuenca/cobertura-vegetal.pdf
- Aerts, R., & Honnay, O. (2011). Forest restoration, biodiversity and ecosystem functioning. BMC Ecology, 11(1), 29. https://doi.org/10.1186/1472-6785-11-29
- Arroyo-Rodríguez, V., Melo, F. P. L., Martínez-Ramos, M., Bongers, F., Chazdon, R. L., Meave, J. A., Norden, N., Santos, B. A., Leal, I. R., & Tabarelli, M. (2017). Multiple successional pathways in human-modified tropical landscapes: New insights from forest succession, forest fragmentation and landscape ecology research. Biological Reviews, 92(1), 326–340. https://doi.org/10.1111/brv.12231
- Bastin, J. F., Finegold, Y., Garcia, C., Mollicone, D., Rezende, M., Routh, D., Zohner, C. M., & Crowther, T. W. (2019). The global tree restoration potential. Science, 364(6448), 76–79. https://doi.org/10.1126/science.aax0848
- Bonnett, G. D., Kushner, J. N. S., & Saltonstall, K. (2014). The reproductive biology of Saccharum spontaneum L.: Implications for management of this invasive weed in Panama. NeoBiota, 20, 61–79. https://doi.org/10.3897/neobiota.20.6163
- Box, G. E. P., & Cox, D. R. (1964). An analysis of transformations. Journal of the Royal Statistical Society. Series B (Methodological), 26(2), 211–252. https://doi.org/10.1111/j.2517-6161.1964.tb00553.x
- Brancalion, P. H. S., Bello, C., Chazdon, R. L., Galetti, M., Jordano, P., Lima, R. A. F., Medina, A., Pizo, M. A., & Reid, J. L. (2018). Maximizing biodiversity conservation and carbon stocking in restored tropical forests. Conservation Letters, 11(4), e12454. https://doi.org/10.1111/conl.12454
- Carse, A. (2012). Nature as infrastructure: Making and managing the Panama Canal watershed. Social Studies of Science, 42(4), 539–563. https://doi.org/10.1177/0306312712440166
- Celis, G., & Jose, S. (2011). Restoring abandoned pasture land with native tree species in Costa Rica: Effects of exotic grass competition and light. Forest Ecology and Management, 261(10), 1598–1604. https://doi.org/10.1016/j.foreco.2010.10.005
- Cerezo, A. (2011, November 21–24). Uso de especies nativas para la reforestación de tierras en la Cuenca del Canal de Panamá. Symposium proceedings. Simposio Internacional Construyendo Caminos de Conocimiento Para Un Futuro Con Sostenibilidad Hídrica, Panamá, República de Panamá: Autoridad Del Canal de Panamá and UNESCO, Panama.
- Chave, J., Réjou-Méchain, M., Búrquez, A., Chidumayo, E., Colgan, M. S., Delitti, W. B. C., Duque, A., Eid, T., Fearnside, P. M., Goodman, R. C., Henry, M., Martínez-Yrízar, A., Mugasha, W. A., Muller-Landau, H. C., Mencuccini, M., Nelson, B. W., Ngomanda, A., Nogueira, E. M., Ortiz-Malavassi, E., Ploton, P., … Vieilledent, G. (2014). Improved allometric models to estimate the aboveground biomass of tropical trees. Global Change Biology, 20(10), 3177–3190. https://doi.org/10.1111/gcb.12629
- Chazdon, R. L. (2008). Beyond deforestation: Restoring forests and ecosystem services on degraded lands. Science, 320(5882), 1458–1460. https://doi.org/10.1126/science.1155365
- Cochrane, M. A. (2002). Spreading like wildfire: Tropical forest fires in Latin America and the Caribbean: Prevention, assessment and early warming. United Nations Environmental Programme (UNEP).
- Cochrane, M. A. (2003). Fire science for rainforests. Nature, 421(6926), 913–919. https://doi.org/10.1038/nature01437
- Condit, R. (1998). Tropical forest census plots: Methods and results from Barro Colorado Island, Panama and a comparison with other plots. Springer Science & Business Media.
- Condit, R., Pérez, R., & Daguerre, N. (2010). Trees of Panama and Costa Rica. Princeton University Press.
- Cortizo, N. (2019). Plan de accion Uniendo Fuerzas: Tareas principales y acciones prioritarias para transformar Panama. Nito Cortizo.
- Craven, D., Hall, J. S., & Verjans, J. M. (2009). Impacts of herbicide application and mechanical cleanings on growth and mortality of two timber species in Saccharum spontaneum grasslands of the Panama Canal Watershed. Restoration Ecology, 17(6), 751–761. https://doi.org/10.1111/j.1526-100X.2008.00408.x
- de Almeida, C., & Viani, R. A. G. (2019). Selection of shade trees in forest restoration plantings should not be based on crown tree architecture alone. Restoration Ecology, 27(4)1–8. https://doi.org/10.1111/rec.12930
- Elliott, S., Navakitbumrung, P., Kuarak, C., Zangkum, S., Anusarnsunthorn, V., & Blakesley, D. (2003). Selecting framework tree species for restoring seasonally dry tropical forests in northern Thailand based on field performance. Forest Ecology and Management, 184(1–3), 177–191. https://doi.org/10.1016/S0378-1127(03)00211-1
- Farley, K. A., Jobbágy, E. G., & Jackson, R. B. (2005). Effects of afforestation on water yield: A global synthesis with implications for policy. Global Change Biology, 11(10), 1565–1576. https://doi.org/10.1111/j.1365-2486.2005.01011.x
- Freitas, M. G., Rodrigues, S. B., Campos-Filho, E. M., Do Carmo, G. H. P., da Veiga, J. M., Junqueira, R. G. P., & Vieira, D. L. M. (2019). Evaluating the success of direct seeding for tropical forest restoration over ten years. Forest Ecology and Management, 438(February), 224–232. https://doi.org/10.1016/j.foreco.2019.02.024
- Goosem, S. P., & Tucker, N. I. J. (1995). Repairing the rainforest— Theory and practice of rainforest re-establishment in North Queensland’s Wet Tropics. Wet Tropics Management Authority.
- Griscom, B. W., Adams, J., Ellis, P. W., Houghton, R. A., Lomax, G., Miteva, D. A., Schlesinger, W. H., Shoch, D., Siikamäki, J. V., Smith, P., Woodbury, P., Zganjar, C., Blackman, A., Campari, J., Conant, R. T., Delgado, C., Elias, P., Gopalakrishna, T., Hamsik, M. R., Kiesecker, J., … Fargione, J. (2017). Natural climate solutions. Proceedings of the National Academy of Sciences of the United States of America, 114(44), 11645–11650. https://doi.org/10.1073/pnas.1710465114
- Groom, B., & Palmer, C. (2012). REDD+ and rural livelihoods. Biological Conservation, 154, 42–52. https://doi.org/10.1016/j.biocon.2012.03.002
- Hall, J. S. (2017). Challenges of working with contractors in reforestation project implementation in the Panama Canal Watershed. Typescript memo produced for the Inter-American Development Bank.
- Hall, J. S., & Ashton, M. (2016). Guide to survival and early growth in plantations of 64 native tree species to Panama and the Neotropics. Smithsonian Tropical Research Institute.
- Hall, J. S., Cerezo, A., & Entem, A. (2015). Chapter 7: Case studies. In Managing watersheds for ecosystem services in the steepland neotropics, Jefferson S. Hall, Vanessa Kirn, Estrella Yanguas Fernández, editors (pp. 91–106).
- Hall, J. S., & Román, F. (2017). TERCER INFORME (Propuesta de Mejoras): Propuesta del Instituto Smithsonian de Investigaciones Tropicales para la definición de una estrategia de reforestación y restauración forestal; Programa de desarrollo agroforestal (DR-L1120), Republica Dominicana; I. Smithsonian Tropical Research Institute.
- Harrison, R., Wardell-Johnson, G., & McAlpine, C. (2003). Rainforest reforestation and biodiversity benefits: A case study from the Australian Wet Tropics. Annals of Tropical Research, 25(2), 65–76. http://espace.library.uq.edu.au/view/UQ:8166
- Holl, K. D., Loik, M. E., Lin, E. H. V., & Samuels, I. A. (2001). Tropical montane forest restoration in Costa Rica: Overcoming barriers to dispersal and establishment. Restoration Ecology, 8(4), 339–349. https://doi.org/10.1046/j.1526-100x.2000.80049.x
- Holmes, I., Kirby, K. R., & Potvin, C. (2017). Agroforestry within REDD+: Experiences of an indigenous Emberá community in Panama. Agroforestry Systems, 91(6), 1181–1197. https://doi.org/10.1007/s10457-016-0003-3
- Hooper, E. R., Condit, R., & Legendre, P. (2002). Responses of 20 native tree species to reforestation strategies for Abandoned Farmland in Panama. Ecological Applications, 12(6), 1626–1641. https://doi.org/10.1890/1051-0761(2002)012[1626:RONTST]2.0.CO;2
- Hooper, E. R., Legendre, P., & Condit, R. (2005). Barriers to forest regeneration of deforested and abandoned land in Panama. Journal of Applied Ecology, 42(6), 1165–1174. https://doi.org/10.1111/j.1365-2664.2005.01106.x
- Hooper, E. R., Legendre, P., Condit, R. S., Ooper, E. L. R. H., & Egendre, P. I. L. (2004). Factors affecting community composition of forest regeneration in deforested, abandoned land in Panama. Ecology, 85(12), 3313–3326. https://doi.org/10.1890/03-0655
- Intergovernmental Panel on Climate Change, Ed. 2014. In Climate phenomena and their relevance for future regional climate change. Climate change 2013 – The physical science basis: Working group I contribution to the fifth assessment report of the intergovernmental panel on climate change (pp. 1217–1308). Cambridge University Press.
- Jakovac, A. C. C., Bentos, T. V., Mesquita, R. C. G., & Williamson, G. B. (2014). Age and light effects on seedling growth in two alternative secondary successions in central Amazonia. Plant Ecology and Diversity, 7(1–2), 349–358. https://doi.org/10.1080/17550874.2012.716088
- Jones, E. R., Wishnie, M. H., Deago, J., Sautu, A., & Cerezo, A. (2004). Facilitating natural regeneration in Saccharum spontaneum (L.) grasslands within the Panama Canal Watershed: Effects of tree species and tree structure on vegetation recruitment patterns. Forest Ecology and Management, 191(1–3), 171–183. https://doi.org/10.1016/j.foreco.2003.12.002
- Jones, H. P., Jones, P. C., Barbier, E. B., Blackburn, R. C., Rey Benayas, J. M., Holl, K. D., McCrackin, M., Meli, P., Montoya, D., & Mateos, D. M. (2018). Restoration and repair of Earth’s damaged ecosystems. Proceedings of the Royal Society B: Biological Sciences, 285(1873), 20172577. https://doi.org/10.1098/rspb.2017.2577
- Kim, T. J., Montagnini, F., & Dent, D. (2008). Rehabilitating abandoned pastures in Panama: Control of the invasive exotic grass, saccharum Spontaneum L., using artificial shade treatments. Journal of Sustainable Forestry, 26(3), 192–203. https://doi.org/10.1080/10549810701879719
- Lambert, A. M., Dudley, T. L., & Saltonstall, K. (2010). Ecology and impacts of the large-statured invasive grasses arundo donax and phragmites australis in North America. Invasive Plant Science and Management, 3(4), 489–494. https://doi.org/10.1614/IPSM-D-10-00031.1
- Laughlin, D. C. (2014). Applying trait-based models to achieve functional targets for theory-driven ecological restoration. Ecology Letters, 17(7), 771–784. https://doi.org/10.1111/ele.12288
- MacDonald, G. E. (2004). Cogongrass (Imperata cylindrical) - Biology, ecology, and management. Critical Reviews in Plant Sciences, 23(5), 367–380. https://doi.org/10.1080/07352680490505114
- Martínez-Garza, C., & Howe, H. F. (2003). Restoring tropical diversity: Beating the time tax on species loss. Journal of Applied Ecology, 40(3), 423–429. https://doi.org/10.1046/j.1365-2664.2003.00819.x
- Menz, M. H. M., Dixon, K. W., & Hobbs, R. J. (2013). Hurdles and opportunities for landscape-scale restoration. Science, 339(6119), 526–527. https://doi.org/10.1126/science.1228334
- Mesquita, R. C. G., Ickes, K., Ganade, G., & Williamson, G. B. (2001). Alternative successional pathways in the amazon basin. Journal of Ecology, 89(4), 528–537. https://doi.org/10.1046/j.1365-2745.2001.00583.x
- MiAmbiente. (2019). Estrategia Nacional Forestal, 2050. Ministerio del Ambiente Panama. https://miambiente.gob.pa/biblioteca-virtual-de-miambiente/
- Nepstad, D. C., Uhl, C., Pereira, C. A., da Silva, J. M. C., & da Silva, J. M. C. (1996). A comparative study of tree establishment in abandoned pasture and mature forest of Eastern Amazonia. Oikos, 76(1), 25. https://doi.org/10.2307/3545745
- Ogden, F. L., Crouch, T. D., Stallard, R. F., & Hall, J. S. (2013). Effect of land cover and use on dry season river runoff, runoff efficiency, and peak storm runoff in the seasonal tropics of Central Panama. Water Resources Research, 49(12), 8443–8462. https://doi.org/10.1002/2013WR013956
- Pérez, R. (2008). Árboles de los Bosques del Canal de Panamá. Smithsonian Tropical Research Institute.
- Perez, R., & Condit, R. (n.d.). Tree Atlas of Panama, Smithsonian Tropical Research Institute. http://ctfs.si.edu/webatlas/maintreeatlas.php
- Poorter, L., Bongers, F., Aide, T. M., Almeyda Zambrano, A. M., Balvanera, P., Becknell, J. M., Boukili, V., Brancalion, P. H. S., Broadbent, E. N., Chazdon, R. L., Craven, D., de Almeida-cortez, J. S., Cabral, G. A. L., de Jong, B. H. J., Denslow, J. S., Dent, D. H., DeWalt, S. J., Dupuy, J. M., Durán, S. M., Fandino, M. C., … Rozendaal, D. M. A. (2016). Biomass resilience of Neotropical secondary forests. Nature, 530(7589), 211–214. https://doi.org/10.1038/nature16512
- R Core Team. (2018). R: A Language and Environment for Statistical Computing. R Foundation for Statistical Computing.
- Reid, J. L., Wilson, S. J., Bloomfield, G. S., Cattau, M. E., Fagan, M. E., Holl, K. D., & Zahawi, R. A. (2017). How long do restored ecosystems persist? Annals of the Missouri Botanical Garden, 102(2), 258–265. https://doi.org/10.3417/2017002
- Rompré, G., Robinson, W. D., & Desrochers, A. (2008). Causes of habitat loss in a Neotropical landscape: The Panama Canal corridor. Landscape and Urban Planning, 87(2), 129–139. https://doi.org/10.1016/j.landurbplan.2008.05.006
- Rozendaal, D. M. A., Bongers, F., Aide, T. M., Alvarez-Dávila, E., Ascarrunz, N., Balvanera, P., Becknell, J. M., Bentos, T. V., Brancalion, P. H. S., Cabral, G. A. L., Calvo-Rodriguez, S., Chave, J., César, R. G., Chazdon, R. L., Condit, R., Dallinga, J. S., de Almeida-cortez, J. S., de Jong, B., de Oliveira, A., Dent, D. H., … Poorter, L. (2019). Biodiversity recovery of Neotropical secondary forests. Science Advances, 5(3), eaau3114. https://doi.org/10.1126/sciadv.aau3114
- Saltonstall, K., & Bonnett, G. D. (2012). Fire promotes growth and reproduction of Saccharum spontaneum (L.) in Panama. Biological Invasions, 14(12), 2479–2488. https://doi.org/10.1007/s10530-012-0245-6
- Stallard, R. F., Ogden, F. L., Elsenbeer, H., & Hall, J. S. (2010). Panama Canal Watershed Experiment: Agua salud project. Water Resources IMPACT, 12(4), 17–20. http://ctfs.si.edu/Public/pdfs/ToDelete/2010_3Q_Stallard_et_al_Water_Rec_IMPACT.pdf
- Suding, K. N., Gross, K. L., & Houseman, G. R. (2004). Alternative states and positive feedbacks in restoration ecology. Trends in Ecology and Evolution, 19(1), 46–53. https://doi.org/10.1016/j.tree.2003.10.005
- Suding, K. N., Lavorel, S., Chapin, F. S., Cornelissen, J. H. C., Díaz, S., Garnier, E., GOLDBERG, D., HOOPER, D. U., JACKSON, S. T., & Navas, M. L. (2008). Scaling environmental change through the community-level: A trait-based response-and-effect framework for plants. Global Change Biology, 14(5), 1125–1140. https://doi.org/10.1111/j.1365-2486.2008.01557.x
- Thaxton, J. M., Cordell, S., Cabin, R. J., & Sandquist, D. R. (2012). Non-native grass removal and shade increase soil moisture and seedling performance during hawaiian dry forest restoration. Restoration Ecology, 20(4), 475–482. https://doi.org/10.1111/j.1526-100X.2011.00793.x
- Tilman, D., Knops, J., Wedin, D., Reich, P. B., Ritchie, M., & Sieman, E. (1997). The influence of functional diversity and composition on ecosystem processes. Science, 277(5330), 1300–1302. https://doi.org/10.1126/science.277.5330.1300
- van Breugel, M., Hall, J. S., Craven, D. J., Bailon, M., Hernandez, A., Abbene, M., & van Breugel, P. (2013). Succession of ephemeral secondary forests and their limited role for the conservation of floristic diversity in a human-modified tropical landscape. PloS One, 8(12), e82433. https://doi.org/10.1371/journal.pone.0082433
- van Breugel, M., Hall, J. S., Craven, D. J., Gregoire, T. G., Park, A., Dent, D. H., Wishnie, M. H., Mariscal, E., Deago, J., Ibarra, D., Cedeño, N., & Ashton, M. S. (2011). Early growth and survival of 49 tropical tree species across sites differing in soil fertility and rainfall in Panama. Forest Ecology and Management, 261(10), 1580–1589. https://doi.org/10.1016/j.foreco.2010.08.019
- van Breugel, M., Ransijn, J., Craven, D. J., Bongers, F., & Hall, J. S. (2011). Estimating carbon stock in secondary forests: Decisions and uncertainties associated with allometric biomass models. Forest Ecology and Management, 262(8), 1648–1657. https://doi.org/10.1016/j.foreco.2011.07.018
- Vitousek, P. M., D’Antonio, C. M., Loope, L. L., Rejmánek, M., & Westbrooks, R. (1997). Introduced species: A significant component of human-caused global change. New Zealand Journal of Ecology, 21(1), 1–16. https://newzealandecology.org/nzje/2008.pdf
- Weber, D., & De Liones, R. (2010). Reporte del estado de la plantación de 61 hectáreas en P. Soberanía (typescript report). Smithsonian Tropical Research Institute.
- Weston, P., Hong, R., Kaboré, C., & Kull, C. A. (2015). Farmer-managed natural regeneration enhances rural livelihoods in Dryland West Africa. Environmental Management, 55(6), 1402–1417. https://doi.org/10.1007/s00267-015-0469-1
- Wishnie, M. H., Dent, D. H., Mariscal, E., Deago, J., Cedeño, N., Ibarra, D., Condit, R., & Ashton, P. M. S. (2007). Initial performance and reforestation potential of 24 tropical tree species planted across a precipitation gradient in the Republic of Panama. Forest Ecology and Management, 243(1), 39–49. https://doi.org/10.1016/j.foreco.2007.02.001
- Wright, S. J., Kitajima, K., Kraft, N. J. B., Reich, P. B., Wright, I. J., Bunker, D. E., Condit, R., Dalling, J. W., Davies, S. J., Díaz, S., Engelbrecht, B. M. J., Harms, K. E., Hubbell, S. P., Marks, C. O., Ruiz-Jaen, M. C., Salvador, C. M., & Zanne, A. E. (2010). Functional traits and the growth–mortality trade-off in tropical trees. Ecology, 91(12), 3664–3674. https://doi.org/10.1890/09-2335.1
- Zanne, A. E., Lopez-Gonzalez, G., Coomes, D. A., Ilic, J., Jansen, S., Lewis, S. L., … Chave, J. (2009). Global wood density database., Dryad. https://doi.org/10.5061/dryad.234http://hdl.handle.net/10255/dryad.235.