
 ?Mathematical formulae have been encoded as MathML and are displayed in this HTML version using MathJax in order to improve their display. Uncheck the box to turn MathJax off. This feature requires Javascript. Click on a formula to zoom.
ABSTRACT
The sustainability of the seriously threatened African miombo woodlands depends on their capability to maintain sufficient natural regeneration. This study focused on the regeneration dynamics and the impacts of silvicultural treatments of fencing, site preparation, and thinning in the Kitulangalo forest reserve in Tanzania. Mixed models were applied to analyze the change in number of stems during the nine-years observation period on a set of permanent experimental plots. There was a significant decrease in the total number of stems (from 29 800 ha−1 to 19 100 ha−1) but a significant increase in the number of main stems (from 9 300 ha−1 to 11 100 ha−1) during observation period. The proportion of empty regeneration plots (zero seedlings and saplings on a regeneration plot of 4 m2) was initially very low (7.3%) and decreased further during the study period to 5.3%. Greater stand density was associated with lower density of regeneration. Fencing implied a greater increase in the number of main stems but a sharper drop in the total number of stems by reducing animal disturbances. The findings indicate that the forests at Kitulangalo are recovering from past abuse and likely developing toward more sustainable stand structures and sustainability.
Introduction
Miombo woodlands constitute the largest savanna area in the world, and dominating the Southern African land mass (Ryan & Williams, Citation2011) covering approximately 2.4 to 2.7 million km2 (Chirwa et al., Citation2008; Jew et al., Citation2017). Miombo stretches from the northernmost tip of South Africa up to Tanzania, and from Mozambique in the east to Angola in the west (Lowore, Citation1999). The related tree species of the genera Brachystegia, Julbernardia, and Isobelinia (Caesalpinioideae) dominate in miombo (Malmer, Citation2007), characterized also by continuous herbaceous cover and the abundance of sedges that show clear seasonality related to water stress. Climatical semi-aridity is the main edaphic determinant (Chidumayo, Citation2001). The range of annual rainfall is large and the length of the dry season also varies between areas. Miombo woodlands play an important role in the provision of a wide range of ecosystem services from biodiversity conservation to rural livelihoods (Syampungani et al., Citation2016). Miombo woodlands are increasingly threatened by anthropogenic activity, especially shifting cultivation and charcoal production (Campbell et al., Citation1996) leading to diminishing ecological, environmental, and social potential. The ability of the miombo woodlands to continue to provide these ecological, environmental, and social services is premised on the need for responsible forest management and restoration, which underpins the concept of sustainable forest management (SFM) (Kangas et al., Citation2006; Von Gadow et al., Citation2012). The core strategy of sustainable management for miombo requires a detailed understanding of the implications of land use practices such as charcoal production, slash and burn agriculture and timber harvesting on dynamics and functioning of the miombo ecosystems. Forest management practices are not identical to natural dynamics, but forestry professionals are able to mimic natural disturbances in many ways with silvicultural practices (Zulu et al., Citation2018).
Tree regeneration is one of the key components of sustainability in all forest management regimes, and knowledge on regeneration is essential for understanding the structural and compositional changes which can account for ecological stability and resilience in miombo woodlands (Mapaure & Moe, Citation2009). The sustainability of any miombo stand depends on the regeneration potential, stand structure and species composition, but knowledge on the regeneration dynamics of miombo forests is quite insufficient in most cases. Silvicultural research is hereby needed to quantify the effects of various land use practices in the context of regeneration and establishment of preferable species (Geldenhuys, Citation2014). Recent studies have shown that natural regeneration may be a better alternative (Fredericksen, Citation2011; Ryan & Williams, Citation2011) to planting in the tropics for certain ecological purposes. Piiroinen et al. (Citation2008) argued that miombo regeneration is currently not fast and abundant enough to cover the losses in miombo woodlands, especially where intensive animal grazing and frequent annual fires are present.
Continuous-Cover Forestry (CCF) is likely to become an essential part of the sustainable management of miombo woodlands. Management regimes based on selection and gap harvesting are probably able to combine the provision of wood and other materials and revenue with continuous regeneration including the promotion of seedling establishment, vigor, and growth, and the establishment of sprouts with the tree species that regenerate mainly by stump coppicing (Fredericksen & Mostacedo, Citation2000). The additional resources and growing space released in a stand after partial harvesting are important for tree regeneration to take off, especially regarding light-demanding species (Chirwa et al., Citation2008).
Our study on tree regeneration was based on an experimental set of silvicultural treatments that were designed to emulate some of the key natural and human-induced disturbances in miombo woodlands in terms of CCF. Partial harvesting is the defining characteristic of management regimes in CCF. Furthermore, the presence or absence of cattle and large mammals may influence regeneration directly (browsing) and indirectly (reduced competition by vegetation cover), with potentially large differences between complete animal protection in many State reserved and unreserved miombo woodlands. This influence can be targeted with fencing and unfencing in experimental setups. Soil preparation is one of the basic traditional silvicultural practices for promoting tree regeneration. Light soil preparation also emulates the unintentional effects of human and mammal activities in the miombo environment.
The aim of this study was to evaluate the role of silvicultural treatments on regeneration dynamics in miombo woodlands using empirical results and models based on a set of permanent sample plots at the Kitulangalo Forest Reserve in Tanzania. The study quantified the dynamics of the number of regeneration stems across different treatments and the resulting changes in the composition of regeneration during an eight-year observation period. The specific study objectives were:
i. To analyze empirical changes in regeneration density and species composition in the experimental stands.
ii. To develop and apply regeneration models for evaluating the impact of the silvicultural treatments applied on the plots
Material and methods
Site, stands, main plots and treatments
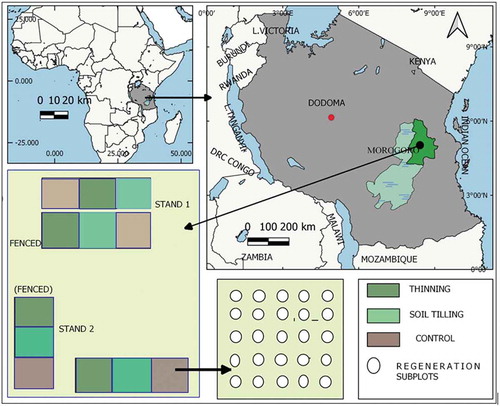
The study area, Kitulangalo Forest Reserve, is located at −6° 52’S and 37° 38ʹN, some 50 km Northeast of Morogoro City, and about 150 km from Dar-es-Salaam in Tanzania (see ). Seven villages surround the reserve, and small farming and animal herding, especially on the Western side, is a common practice interacting with this forest. The Kitulangalo forest can be characterized as semi-natural dry Miombo woodland (precipitation <1000 mm a–1) with some transitional characteristics of the coastal woodland mosaic (Mbwambo et al., Citation2008). The reserve has survived relatively well for over 20 years with enforced restrictions on tree harvesting. Prior to that, extensive selective cutting was practiced, resulting in substantial forest degradation. However, the proximity of the Kitulangalo forest to the major cities of Dar es Salaam and Morogoro is a threat to the sustainability of the forest resources due to the charcoal trade. In addition, its proximity to pastoralist communities and poor subsistence farmers is another threat because of uncontrolled animal grazing, illegal cutting, and encroachment. We, therefore, intended to emulate the actual situation of the miombo woodlands in Kitulangalo and around Tanzania by applying silvicultural treatments (light thinning, soil tilling, and control) that could reflect human activities like selective cutting and soil disturbance from grazing which results into soil erosion. Fencing and unfencing reflect zones of total protection from grazing versus free access. Fires are an integral part of miombo dynamics, influencing both stand structure, composition and carbon cycling (Vieira & Scariot, Citation2006). Fire was completely excluded in the experimental blocks as it was not possible to practice controlled fire inclusion and exclusion as part of the design, and because the plots were being used for another ongoing research as well.
Figure 1. Study area map and plot layout at Kitulangalo Forest Reserve
Sampling and plot layout
Two sites were initially designated for the study in order to provide a reliable representation of the site and stand conditions in the reserve in terms of stand density, spatial and vertical structure, species composition, topography, soil properties. In order to closely engage the two landowner associates to the project, one study stand was to lie in the state-owned part of the forest managed by Tanzania Forestry Services (TFS) and another in the Sokoine University of Agriculture training forest (SUATF), some 500 m apart from each other. A split plot experimental design was applied (). Each stand has two blocks, one fenced to keep cattle and other large mammals out, and one unfenced. Each block has three silvicultural treatment plots that were randomly placed within the blocks. Thus, each stand has a total of six adjoining plots within two blocks. Each plot measures 30 m × 30 m. A stand had thus 6 × 0.09 ha = 0.54 ha of area within plots, totaling 1.08 ha for the two stands.
We applied fencing to exclude the effect of grazing animals as the block treatment, with no fencing as the control. In addition, we applied three silvicultural treatments, namely, control (where nothing was done), thinning (removal of 10–20% of basal area) and soil tilling (hoe tilling of soils). For the thinning treatment, the criteria for tree removal based on species which are less economically valuable with a stem diameter of <30 cm as described Mbwambo et al. (Citation2008). For the promotion of regeneration, soil preparation was conducted in terms of a manual soil workup underneath the crown shade of large trees. Soil was prepared to a depth of 15–20 cm in order to improve soil porosity and hence facilitate regeneration growth. All existing young seedlings and sprouts of all woody species were carefully spared. Fires were kept out of the plots by maintaining effective fire lines throughout the observation period.
Measurements
All live seedlings and saplings with height (h) ≥20 cm and breast height diameter (d) ≤5 cm were identified for species (vernacular and botanical name) and measured for total height (cm) and diameter at breast height at 130 cm(d) when applicable. All stems were counted and assigned to individual stems standing alone or belonging to a group of stems within a cluster. Clusters consisted of coppices sprouting from a living stump/base, or root suckers emerging directly from the soil surface. In the case of clustered stems (of the same species); the highest stem was measured for h and d, and the rest just counted. The trees were assessed for pest/herbivore damage severity, its cause and vigor, and stem quality. The criteria and grading scale are shown in Supplementary Table 1 (Appendix 2). Visual assessment was also made to grade the grass and herbaceous coverage on the regeneration plot. The percentage (%) score for the completely covered regeneration plot was assigned to be 100% while a completely bare ground regeneration plot was 0%.
Data treatment
The presence of regeneration on each regeneration plot was monitored both at the start (2007) and at the end of the study period (2016). The colonization process on previously empty regeneration plots and the disappearance of existing trees were subsequently recorded and analyzed. The number of stems was addressed in terms of two alternate variables: the total number of stems () and the number of main stems (
).
was the count of all stems on the regeneration plot. For
in a cluster of several similar stems was counted as one, in addition to individually standing stems which were also counted as one each. A cluster usually consisted of coppices sprouting from the base of a living stump, or root suckers emerging directly from the soil surface. However, tight groups of individual stems from seed also occurred and were treated similarly as groups. To reliably differentiate between stems from seed and stems from suckers would have required lots of digging them up at the field work stage, which we had not carried out in order to minimize disturbance on the permanent plots. Thus, a cluster of several stems, e.g., 4, was counted as 1 in the number of main stems but 4 in the total number of stems (see Appendix 3, Supplementary Figure 1). The actual plot-level stem counts made in the field were later converted into per hectare values in some cases.
The Shannon Diversity Index and Evenness were used to describe species diversity and its change between the beginning and the end of study period.
Where:
= Shannon Diversity Index (SDI)
= Proportion of the ith species of the total number of species
= total number of species on the site
The distribution pattern (Evenness, E´) was computed as
The primary data analysis aimed at the formulation of models describing the number of on a regeneration plot as dependent on stand conditions at the plot (30 m * 30 m) level density (number of stems and basal area in terms of main canopy trees with d > 5 cm). Additionally, a more spatially explicit influence of the local stand density around a regeneration plot was applied. The hierarchical data structure with four random levels (stand, block, plot, and regeneration plot) and three fixed effects (measuring time, fencing, and treatments) agreed with the application of a linear mixed model (Mugasha et al., Citation2017). The main feature of the mixed models is that they incorporate fixed and random effects (Pinheiro et al., Citation2018). Parameters for the influence of bigger trees such as plot density and basal area were included in the fixed effects. The dependent variable, the seedling count on a regeneration plot, was assumed to follow a Poisson distribution (McCullagh & Nelder, Citation1989) due to the strongly skewed distribution of the data (large number of zeros and small counts of the seedlings).
For the stand condition models (Linear mixed models), we applied the cohort models approach (Monserud & Ek, Citation1974) to analyze the number of stems on a regeneration plot and the change in the number of stems between 2007 and 2016. Various candidate models were compiled and tested but only four models were finally retained. Candidate models describing change in the number of stems used some potential variables such as fencing, grass coverage (%), plot basal area (m2 ha−1), plot density (stems ha−1), and initial number of stems. For candidate models describing number of stems per unit area, we applied plot basal area (m2 ha−1), plot density (stems ha−1). Local density (sub N, stems ha−1) within a radius of 5.5 m around each regeneration plot was applied to fine-tune the effect of density compared to the plot-wise density. Parameter estimates in linear mixed-effect models were gained by restricted maximum likelihood (REML) using the lmer function in the lme4 package for (Pinheiro et al., Citation2018). Model fit was judged using the coefficient of determination (R2), Root Mean Square Error (RMSE) and Akaike Information Criteria (AIC). Residual plots were used for checking their normality and bias.
The secondary analysis focused on the effects of the silvicultural treatments and their interactions with the application of generalized linear mixed models (Genlinmixed procedure in SPSS 20) with restricted maximum likelihood (REML) estimation method and logarithmic link function. The effects were fencing and silvicultural treatments (thinning, soil tilling, and control) and their respective interactions (measurement time x fence, measurement time x treatments and fence x treatments) as explanatory variables for the change in number of stems (both and
on a regeneration plot. In this case, the change between the measurements was involved as a time effect (beginning and end of study period) so that it could be examined as a part of different model compositions together with other fixed as well as with random effects. Compound symmetry (split-plot structure) covariance structure was assumed in block-plot and plot-regeneration plot interaction terms. The same multi-level correlation structure was assumed in the model, where time was included as a fixed effect since two annual observations were made on the same regeneration plot, and those responses were correlated.
To test model fit, pseudo-R2 values based on the sum of squared error (SSE) and the sum of squares total (SST):
where SSE = Sum of Square Error which measures how far the data are from the model’s predicted values
SST = Sum of square total which measures how far the data are from the mean.
The root means square error (RMSE) was, however, computed by the following formula:
Where:
= Root Means Square Error for
= Observed mean total number of stems, stem count
= Observed mean in number of main stems, stem count
= Predicted mean for total number of stems, stem counts
= Predicted mean for the number of main stems, stem counts
n = the number of observations.
Results
Empirical results
Our results indicated a significant drop in the total number of stems () (r = 0.40, p = .00001) and a significant increase in the number of main stems (
) (r = 0.58, p = .00001) during the 9 years of observation. The average total number of stems (
) was 29761 stems ha−1 at the beginning of the study decreased to 19059 stems ha–1 at the end of the study period, while the average number of main stems (
) increased from 9270 stems ha−1 at the beginning to 11054 stems ha−1 at the end of the study (Appendix 2 and 3). Stand 1 had a slightly higher average density of total number of stems than stand 2 (31188 vs 28334 stems ha−1) at the beginning of the study, but slightly lower than stand 2 at the end of the study (17533 vs 20586 stem ha−1) respectively. The aggressive competition from the grass cover is believed to have caused a sharp drop in the total number of stems in fenced plots compared to unfenced for both stands. The percentage of grass cover had a significant negative correlation with the total number of stems (
) (r = −0.14, p = .00002). In addition, plot stem wood volume was also significantly negatively correlated with the total number of stems (r = −0.22, p = .0004) and the number of main stems (r = −0.11, p = .0882), respectively. Thinning, soil tilling, and control treatment did not have any consistently significant correlations with the change in the number of stems in this analysis.
The proportion of empty regeneration plots (zero seedlings) decreased from 7.3% to 5.3% on the unfenced plots and from 13% to 8% on the fenced plots (Supplementary ). The change in the population of individual stems varied with species. For instance, the proportion of plots containing at least one Julbernardia globiflora stem dropped from 35.9% to 30.2%, while Dichrostachys cinerea and Dalbergia nitidula dropped from 9.1% to 5.8% and 8.7% to 2.2%, respectively. Other species such as Combretum molle, Pteleopsis myrtifolia, Lonchocarpus bussei, and Bridelia cathatica however, also contributed to colonizing empty regeneration plots between the measurements despite their low average presence. The Shannon Diversity Index for the species did not change much from 2007(SDI = 2.4) to 2016(SDI = 2.6). A negligible change in species distribution was observed (E’ = 0.64 in 2007 vs 0.65 in 2013).
Saplings with at least one identified damage were 52% on fenced plots and 43% on unfenced ones. At the beginning of the study period, animal damage accounted for 3% and 2% of all cases for fenced and unfenced areas, respectively. Other causes such as rodents and fire were not observed at this stage. Relatively similar pattern was found at the end of the study period, where 53% and 31% of all regeneration was found damaged by insects for unfenced and fenced plots, respectively. Other damage sources and their proportions (Supplementary Figure 3a in Appendix 3). In addition, damage severity on seedlings was considered to be minor in the first measurement (right after fencing), with relatively similar percentages shown for the fenced and unfenced plots. At the end of the observation period (2016) however, damage percentage had decreased more on fenced plots than on unfenced ones (Supplementary Figure 3b in Appendix 3). Comparing sapling vigor, 41% and 50% of all stems in unfenced and fenced plots were somewhat weakened at the beginning of the study. At the end of the study period (2016) however, sapling vigor was better whereby the majority of stems that were initially somewhat weakened had become normal stems (Supplementary Figure 3c in Appendix 3).
Higher mean height values were found on fenced plots at both the start and the end of the observation period (Supplementary Figure 4a,b). Generally, the mean height distribution formed a non-normal distribution with skewness toward the left (smaller height classes). We found a higher mean height in stand 1 in both the beginning and the end of the study. Grass and herb cover percent were positively correlated with mean height (r = 0.11, p = .0005).
The overall stand mean grass and herbaceous cover percent (henceforth grass cover) were 22.1% at the beginning and 41.8% at the end of the study period, respectively. The cover was found to range from 0% to 100% forming a left-skewed, non-normal distribution with more values less than overall mean coverage. Fenced areas had a higher percentage of high grass cover classes 56–75% and >75% at the end of the study period as compared to unfenced areas. Grass cover was weakly correlated with stand basal area (r = 0.034, p = .00001). In addition, grass cover showed a weak negative correlation with the total number of stems r = −0.14, p = .015236 but positive correlation with sapling height (r = 0.11, p = .0000). At the treatment level however, relatively similar averages of grass cover were found for control (48%), thinning (46%) and soil tilling (46%), respectively.
Models
Data exploration pointed to a strong negative correlation between change in the total number of stems against the initial total number of stems (stems ha−1)(r = −0.75, p = .00001) and a moderately weak negative correlation between the change in the number of main stems against the initial number of main stems and (r = −0.24, p = .00001). Plot basal area was also negatively correlated to both total number of stems () (r = −0.23, p = .001014) and number of main stems (
) (r = −0.07, p = .278082). In addition, we found a positive relationship between grass cover with both the change in the total number of stems and number of stems.
With the exception of the fencing factor (fenced and unfenced), all other parameters for models 1 and 2 for ( and
) were all significant from zero (p <.05) (). Basal area and initial total number of stems were negatively correlated with the change in total number of stems on a regeneration plot. Increase in the initial number of stems resulted in a drop in the predicted total number of stems (
) for model 1 (). Model 2 predicted a relative increase in the number of main stems
). The relative change in the number of main stems decreased with the increase in the initial number of main stems whereby fewer number of main stems resulted into high percentage change in
(). Silvicultural treatments (thinning, soil tilling, and control) did not yield any significant effects in candidate models (models 1 and 2) regarding the change in number of stems. Parameters used in the model were able to explain the sources of variation by 70% and 15% in terms of R2 for models 1 and 2, respectively. The presence of constant variance indicated the model assumptions on homoscedasticity and normality were achieved.
Table 1. Statistical summary for model 1: R2 = 0.70, RMSE = 4.6429
Table 2. Statistical summary for model 2: R2 = 0.11, RMSE = 2.333
Figure 2. Change in the number of stems by the initial number of stems as predicted by (a) model 1 for the total number of stems and (b) model 2 for the number of main stems. Values of other independent variables were set at averages in the data
Total number of stems () and number of main stems (
) on a regeneration plot were found to increase with greater density (N) of bigger trees (). Plot basal area had a negative relationship with both the total number of stems and the number of main stems. However, using the local density (i.e. tree density at a radius of 5.5 m radius around a regeneration plot) as an independent variable resulted in a positive relationship with the number of regenerations for
(). The higher RMSE at plot level over the plot level (EquationEquation (3)
(3)
(3) vs EquationEquation (4))
(4)
(4) showed higher variation at plot than at stand level.
Table 3. Statistical summary for model 3 (Ntot): R2 = 0.14, RMSE = 7.7868
Figure 3. Number of stems on a subplot as predicted by (a) model 3 for the total number of stems and (b) model 4 for the main stems. Values of other independent variables were set at averages in the data
Model equations:
Where
= the change in total number of stems on regeneration plot k plot j in stand i, stems per plot
= the change in number of main stems on regeneration plot k plot j in stand i, stems per plot
= the total number of stems in a stand per unit area, stems ha −1
= the total number of main stems in a stand per unit area, stems ha −1
= the initial number of main stems at regeneration plot k on plot j in stand i, stem per plot
= the initial number of main stems at regeneration plot k on plot j in stand i, stems per plot
= the grass cover at regeneration plot k on plot j in stand i, (%)
= the plot basal area, m2 ha−1 (for the bigger trees)
…,
= the parameters for the fixed effects
= the factor of fencing with two levels (fenced and unfenced)
= the factor of stand
= the density for plot j in stand i, (for large trees), stems ha −1
= the local density at plot j, in stand i, stems ha −1 (for large trees within r = 5.5 m around regeneration plot j)
= the random effect at plot j and stand i.
= the residual at regeneration plot k, in plot j and stand i.
The generalized linear models (EquationEquation (5))(5)
(5) were also applied to predict the change in the total number of stems (
) and change in the number of main stems
subject to the treatments, accounting for interactions, and the hierarchy in the data.
Model equation
g (
where g is a logarithmic link function. ) is the estimate for seedling number per regeneration plot in treatment plot i, block j, stand k.
is a constant and
is the fixed part of the model which contains independent variables
(fencing, silvicultural treatments, time, and interactions) with parameter β.
is the random part that includes random effects and
is normally distributed error.
The main effect of measurement time – was significant for the total number of stems () (). The overall (marginal) average of stem number in 2016 was significantly smaller compared to that of 2007. The average overall stem number decreased from 8.9 to 5.3 stems per regeneration plot (equivalent to 23350 to 13905 stems ha−1) (Supplementary Figure 5a in Appendix 3). The decrease in the number of stems was greatest on the fenced plots, showing a significant time-fence -interaction (Supplementary Figure 5b in Appendix 3). In addition, the Measurement time x Fence interaction depended on the treatment effect, showing a significant 3-way measure x fence x treatment interaction (Supplementary Figure 5c-e in Appendix 3). The number of stems in already differed before the fencing and silvicultural treatments in 2007. At that time there was a significantly higher initial number of stems on the plots with tilling and fencing compared to control and thinning. On fenced plots, however, the number of stems in tilled plots dropped to the level of the control during the study period.
Table 4. Statistical summary for model 4 (Nmain): R2 = 0.24, RMSE = 2.516
Table 5. Statistical summary for silvicultural treatments (model 5) with total number of stems () and number of main stems (
)
The number of main stems () slightly increased between 2007 and 2016 (Supplementary Figure 5f in Appendix 3). The model in this case had only one significant explanatory variable, which was the time (of measurement) main effect. The 3-way measure x fence x treatment interaction was not significant (), indicating that the increase in the number of main stems from 2007 to 2016 was equal irrespective of silvicultural treatments and fencing.
Discussion
A substantial drop was observed in the total number of seedling and sapling stems during the nine-year monitoring period. This involved the death of individual stems within clusters of stems or among single stems standing alone. Additionally, some up growth from saplings into trees at the threshold of 5 cm in diameter was also involved but with a minimal effect only. This is a typical miombo characteristic where a high density of coppice, root suckers, and seedlings are produced annually; but very few manage to grow to maturity (Chamshama et al., Citation2004; Mugasha et al., Citation2016).
A sharper drop in the total number of stems was observed in the fenced areas compared to the unfenced areas. These empirical observations agree with the drop in total number of stems predicted by our models. Fencing promoted the proliferation of vegetation and greater grass cover through the elimination of animal disturbances. The presence of a thick grass cover is believed to induce an aggressive competition for soil nutrients and water against saplings (Lowore, Citation1999), a phenomenon which results in a higher mortality of saplings.
In contrast to the total number of stems, the number of main stems (the highest vigorous stem in a cluster of individuals of a species) increased, especially in the fenced areas compared to unfenced during the study period. The proportion of empty regeneration plots similarly decreased. The decrease in the total number of stems involved a selective disappearance of excess stems in the clusters, but the highest and most vigorous individuals survived more often. In another study in the same experimental set, it was found that the ingrowth from saplings into trees (d > 5 cm) was greater in the fenced areas (Njoghomi et al., Citation2020). This is an indication of progressive regeneration in the stands. It seems that without animal grazing and browsing, trees tend to develop more single main stems and less clusters and sprouts. A large decrease in the total number of stems but a simultaneous increase in the number of main stems and a decrease in the proportion of empty spots points toward the existence of regeneration “hot spots,” areas where the saplings develop rapidly from multi-stems shrub-like trees into single-stem individuals, which may be possible to utilize in management. More research is required to identify potentially favorable areas and spots within stands.
A negative relationship between plot basal area and the density of seedlings and saplings indicated the existence of a competition effect within the relatively low range of stand densities on the plots (basal area of 6–14 m2 ha−1. Previous works have indicated that density controls regeneration through mortality (Abbot & Lowore, Citation1999; Kitajima & Fenner, Citation2000). Luoga et al. (Citation2004) concluded that closed-canopy and intact forest reserves suffer more self-thinning dynamics as compared to more open lands in miombo woodlands. Previous studies have attributed such an effect to light (Oyama, Citation1996; Sapkota et al., Citation2009). However, a positive relationship between the number of larger trees and regeneration was found. Based on observations in the field, it seems that the higher number of saplings was connected to the higher number of smaller stems in areas that have been scarcer in the past and have been in the process of regenerating for a longer period, resulting in the greater presence of both small trees and saplings at the same time.
The number of tree and shrub species (88) encountered in the stands was fewer than some other studies in miombo ecosystems have been reported Giliba et al. (Citation2011) and Mugasha et al. (Citation2016), yet it was within the range of observed elsewhere in the miombo ecosystem (Isango et al., Citation2007; Kamangadazi, Citation2019; Mwakalukwa et al., Citation2014). The species composition did not change much during the study period, but some species seemed to contribute more than others in the process of recolonization of empty spaces. Species like J. globiflora and C. molle were more prominent than other species with a high number of regeneration. Luoga et al. (Citation2002) argued that the highly adapted species tend to develop extensive root systems, a process which may last over a decade as a strategy for nutrient and water extraction and a means of escaping the impacts of fire, browsing, and droughts. This process and potential outcome at species level could constitute a major focus in further studies with a longer time frame and detailed spatial analyzes.
Our data were acquired from a set of 12 permanent sample plots in two closely located sites representing a single ecological zone of lowland miombo woodlands in Tanzania. Modeling was applied as the primary analysis tool in this study. However, the models are limited in application because of their narrow coverage of site and stand conditions, and have limited use in prediction outside the experimental setting. Further research on regeneration involving a wider range of miombo ecosystems with larger sample sizes and longer monitoring periods are vital for the development of practical management regimes for miombo woodlands. The possibilities to vary the amount of wood to be removed during thinning and the selection of species to be removed or retained were limited in this experiment. Furthering studies should pay more attention on individual species in order to promote their sustainability in different management situations.
Conclusions
Although the total number of stems decreased, empty spaces were colonized with new stems, and the highest and most vigorous stems survived within clusters. This gives a strong signal that the forests at Kitulangalo are recovering from past abuse and probably developing toward more sustainable stand structures and sustainability. Protecting the existing seedlings and saplings from animal grazing, in this case emulated by experimental fencing, gives them better chances to survive and grow. On the other hand, the proliferation of grass in the absence of grazing and fire may tend to discourage the emergence of new seedlings in the long run. The present study has identified new pathways for improving regeneration with management practices both in disturbed and protected areas. For improved miombo regeneration and its sustainability, we recommend selective logging in order to reduce competition by the main canopy, and periodical complete protection from grazing, which ensures the increased number of main stems. Further research and regeneration modeling including more silvicultural and stand condition variables are imperative to improve our knowledge on regeneration dynamics and management in miombo woodlands.
Supplemental Material
Download Zip (392.2 KB)Acknowledgments
This work is part of the INFORES-Tanzania project, financed by Ministry of Foreign Affairs of Finland. The Author is grateful for the opportunity and financial support to pursue this study. The Author wishes to thank all the INFOREST project team who in one way or another have contributed to the completion of this work.
Supplementary material
Supplemental data for this article can be accessed on the publisher’s website.
Correction Statement
This article has been republished with minor changes. These changes do not impact the academic content of the article.
Additional information
Funding
References
- Abbot, P. G., & Lowore, J. D. (1999). Characteristics and management potential of some indigenous firewood species in Malawi. Forest Ecology and Management, 119(1–3), 111–121. https://doi.org/10.1016/S0378-1127(98)00516-7
- Campbell, B., Frost, P., & Byron, N. (1996). Miombo woodlands and their use: Overview and key issues. Bogor, Indonesia: Center for International Forestry Research. https://doi.org/10.17528/cifor/000465
- Chamshama, S., Mugasha, A., & Zahabu, E. (2004). Stand biomass and volume estimation for Miombo. Woodlands at Kitulangalo, Morogoro, Tanzania. The Southern African Forestry Journal, 200(1), 59–70. https://doi.org/10.1080/20702620.2004.10431761
- Chidumayo, E. (2001). Climate and phenology of savanna vegetation in southern Africa. Journal of Vegetation Science, 12(3), 347–354. https://doi.org/10.2307/3236848
- Chirwa, P. W., Syampungani, S., & Geldenhuys, C. J. (2008). The ecology and management of the Miombo woodlands for sustainable livelihoods in southern Africa: The case for non-timber forest products. Southern Forests: A Journal of Forest Science, 70(3), 237–245. https://doi.org/10.2989/sf.2008.70.3.7.668
- Fredericksen, T. S. (2011). Review silviculture in seasonally dry tropical forests. In Silviculture in the tropics (pp. 239–260). Berlin Heideberg: Springer. https://doi.org/10.1007/978-3-642-19986-8_16
- Fredericksen, T. S., & Mostacedo, B. (2000). Regeneration of timber species following selection logging in a Bolivian tropical dry forest. Forest Ecology and Management, 131(1–3), 47–55. https://doi.org/10.1016/s0378-1127(99)00199-1
- Geldenhuys, C. (2014). Sustainable use of Miombo woodlands: Simple silvicultural practices, the key to sustainable use of Miombo fuel wood and poles. SA Forestry, 2014(April), 20–21.
- Giliba, R. A., Boon, E. K., Kayombo, C. J., Musamba, E. B., Kashindye, A. M., & Shayo, P. F. (2011). Species composition, richness and diversity in Miombo woodland of Bereku Forest Reserve, Tanzania. Journal of Biodiversity, 2(1), 1–7. https://doi.org/10.1080/09766901.2011.11884724
- Isango, J., Varmola, M., Valkonen, S., & Tapaninen, S. (2007). Stand structure and tree species composition of Tanzania Miombo woodlands: A case study from Miombo woodlands of community based forest management in Iringa district [Paper presented]. Proceedings of the 1st MITIMIOMBO Project Workshop. Morogoro, Tanzania. https://doi.org/10.1.1.628.5030
- Jew, E. K., Dougill, A. J., & Sallu, S. M. (2017). Tobacco cultivation as a driver of land use change and degradation in the miombo woodlands of south‐west Tanzania. Land Degradation & Development, 28(8), 2636–2645. https://doi.org/10.1002/ldr.2827
- Kamangadazi, F. (2019). Analysis of tree community composition, diversity and natural regeneration in Miombo Woodlands of Malawi. Michigan State University.
- Kangas, A., Laukkanen, S., & Kangas, J. (2006). Social choice theory and its applications in sustainable forest management—a review. Forest Policy and Economics, 9(1), 77–92. https://doi.org/10.1016/j.forpol.2005.02.004
- Kitajima, K., & Fenner, M. (2000). Ecology of seedling regeneration. Seeds: The Ecology of Regeneration in Plant Communities, 2, 331–359.
- Lowore, J. D. (1999). Coppice regeneration in some miombo woodlands of Malawi (FMM Report No.: 99001 ODC: 231.4:187). Forestry Research Institute of Malawi.
- Luoga, E. J., Witkowski, E., & Balkwill, K. (2004). Regeneration by coppicing (resprouting) of miombo (African savanna) trees in relation to land use. Forest Ecology and Management, 189(1–3), 23–35. https://doi.org/10.1016/j.foreco.2003.02.001
- Luoga, E.J., Witkowski, E., & Balkwill, K. (2002). Harvested and standing wood stocks in protected and communal miombo woodlands of eastern Tanzania. Forest Ecology and Management, 164(1–3), 15-30. https://doi.org/10.1016/S0378-1127(01)00604-1
- Malmer, A. (2007). General ecological features of miombo woodlands and considerations for utilization and management [Paper presented]. MITMIOMBO–Management of Indigenous Tree Species for Ecosystem Restoration and Wood Production in Semi-Arid Miombo Woodlands in Eastern Africa. Proceedings of the First MITMIOMBO Project Workshop held in Morogoro, Tanzania. https://doi.org/10.1.1.501.7103
- Mapaure, I., & Moe, S. R. (2009). Changes in the structure and composition of miombo woodlands mediated by elephants (Loxodonta africana) and fire over a 26‐year period in north‐western Zimbabwe. African Journal of Ecology, 47(2), 175–183. https://doi.org/10.1111/j.1365-2028.2008.00952.x
- Mbwambo, L., Valkonen, S., & Kuutti, V. (2008). Structure and dynamics of miombo woodland stands at Kitulangalo Forest Reserve, Tanzania. Forest Research, 98(03), 10–19. http:/www.metla.fi/julkaisut/workingpapers/2008/mwp098.htm
- McCullagh, P., & Nelder, J. (1989). Generalized Linear Models. 2nd Edition Chapman and Hall. London, UK. https://doi.org/10.1007/978-1-4899-3242-6
- Monserud, R. A., & Ek, A. R. (1974). Plot edge bias in forest stand growth simulation models. Canadian Journal of Forest Research, 4(4), 419–423. https://doi.org/10.1139/x74-062
- Mugasha, W., Bollandsås, O., Eid, T., Gobakken, T., Zahabu, E., & Katani, J. (2016). Decision-support tool for management of miombo woodlands: A matrix model approach. Southern Forests, 1(13). https://doi.org/10.2989/20702620.2016.1233776
- Mugasha, W. A., Eid, T., Bollandsås, O. M., & Mbwambo, L. (2017). Modelling diameter growth, mortality and recruitment of trees in miombo woodlands of Tanzania. Southern Forests: A Journal of Forest Science, 79(1), 51–64. https://doi.org/10.2989/20702620.2016.1233755
- Mwakalukwa, E. E., Meilby, H., & Treue, T. (2014). Floristic composition, structure, and species associations of dry Miombo Woodland in Tanzania. ISRN Biodiversity, 2014(153278), 1–15. https://doi.org/10.1155/2014/153278
- Njoghomi, E. E., Valkonen, S., & Karlsson, K. (2020). Analysing species site-specific tree growth, mortality and ingrowth for miombo woodlands in Tanzania. Southern Forests Journal of Forestry Sciences. Submitted.
- Oyama, S. (1996). Regeneration process of the miombo woodland at abandoned citemene fields of northern Zambia. African Study Monographs, 17(3), 101–116. https://doi.org/10.14989/68149
- Piiroinen, T., Roininen, H., & Valkonen, S. (2008). Regeneration of miombo woodlands: Effects of herbivory, management and competition. Finnish Forest Research Institute, 98(07), 46–51. http://www.metla.fi/julkaisut/workingpapers/2008/mwp098.htm
- Pinheiro, J., Bates, D., DebRoy, S., & Sarkar, D. (2018). R Core Team (2018). nlme: Linear and nonlinear mixed effects models. R package version 3.
- Pinheiro, J. Bates, D., DebRoy, S, & Sarkar, D.(2018). R Core Team 2018. nlme: Linear and nonlinear mixed effect models. R package version 3. 1–137. R Found. Stat. Comput. Retrieved from https://CRAN.Rproject.org/package=nlme (accessed 19 Jul.2018)
- Ryan, C. M., & Williams, M. (2011). How does fire intensity and frequency affect miombo woodland tree populations and biomass? Ecological Applications, 21(1), 48–60. https://doi.org/10.1890/09-1489.1
- Sapkota, I. P., Tigabu, M., & Odén, P. C. (2009). Spatial distribution, advanced regeneration and stand structure of Nepalese Sal (Shorea robusta) forests subject to disturbances of different intensities. Forest Ecology and Management, 257(9), 1966–1975. https://doi.org/10.1016/j.foreco.2009.02.008
- Syampungani, S., Geldenhuys, C. J., & Chirwa, P. W. (2016). Regeneration dynamics of miombo woodland in response to different anthropogenic disturbances: Forest characterisation for sustainable management. Agroforestry Systems, 90(4), 563–576. https://doi.org/10.1007/s10457-015-9841-7
- Vieira, D. L., & Scariot, A. (2006). Principles of natural regeneration of tropical dry forests for restoration. Restoration Ecology, 14(1), 11–20. https://doi.org/10.1111/j.1526-100x.2006.00100.x
- Von Gadow, K., Pukkala, T., & Tomé, M. (2012). Sustainable forest management. Springer Science & Business Media. https://doi.org/10.1007/978-94-010-9819-9
- Zulu, F., Syampungani, S., & Fushike, P. (2018). Recovery of Baikiaea forest of southwestern Zambia from shifting cultivation and its implications for sustainable management. Journal of Forestry Research, 30(2), 497–506. https://doi.org/10.1007/s11676-018-0656-z
Appendix A.
Regeneration species list enumerated in Kitulangalo Forest Reserve