
 ?Mathematical formulae have been encoded as MathML and are displayed in this HTML version using MathJax in order to improve their display. Uncheck the box to turn MathJax off. This feature requires Javascript. Click on a formula to zoom.
ABSTRACT
This study contributes to our knowledge about the detection and recognition of carbon fibre-reinforced plastic (CFRP) composites by using a modal analysis technique. Delamination was artificially induced during the manufacturing process of CFRP beams so that the dimension and location of the artificial delamination were known. The first three longitudinal bending modes were considered for detecting, locating, and evaluating the delamination. Contrary to what is commonly practised, the sensor placed on the CFRP structure had a large mass in order to contribute actively to restricting the delamination and hence modifying the structure’s natural frequencies, thus making it much easier to monitor its health condition. The technique was implemented on a beam with a delamination gap of 9% of the beam’s length, positioned within the span of the beam. The results demonstrate that the proposed technique can be effective not only to locate the delamination but also to measure its extent accurately.
Introduction
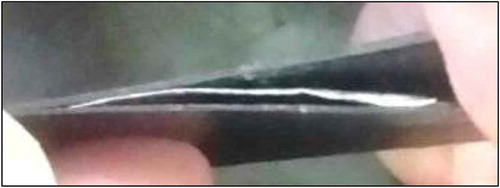
Carbon-fibre-reinforced polymers, also known as carbon-fibre-reinforced plastics (CFRPs) are commonly used wherever high strength-to-weight ratio and rigidity are required, such as in aeronautical, marine and automotive applications. Like all other composite materials, CFRPs may have manufacturing defects or become damaged in service or during handling and installation. These flaws can have a deleterious effect on the mechanical properties and fatigue life of the CFRP structural components. Among the problems that have a detrimental effect on CFRP composites, delamination, or the debonding of adjoining plies, which involves layers separating or peeling apart from each other inside the structure, is probably the most dangerous one. In laminates, delamination is a particularly dangerous failure mode because it takes place and grows beneath the structure’s surface without being seen from the exterior. It has significant consequences such as stiffness reduction in the whole structure, which can lead to disastrous results (see ).
Figure 1. Example of CFRP delamination [Citation1].
![Figure 1. Example of CFRP delamination [Citation1].](/cms/asset/24661d3c-964f-4618-83a2-e1c59389e8a1/gnte_a_1590828_f0001_oc.jpg)
Delaminated composites can lose up to 60% of their strength and stiffness yet appear to remain unchanged [Citation2]. Delamination occurs when cracks form between adjacent plies within a laminate composite. It can have several causes, such as laminate’s configuration, environmental conditions, processing issues (e.g. inadequate consolidation pressure, air becoming trapped between plies), or being struck by an external object. Delamination can also be observed in areas where the thickness changes (known as the ply drop-off), around drilled holes, and on the bare edges of laminates. Environmental conditions may initiate ply separation and cause cracks, mainly because of a mismatch in the mechanical and thermal coefficients between the adjacent plies (especially those with different fibre orientations), and the fibres and matrix.
Delamination in CFRP components can rapidly propagate into a wide damage zone, which is almost impossible to repair, thus compromising the overall structural integrity. Therefore, detecting the presence of delamination in composite structures at an early stage is extremely important. Unfortunately, the complexity of the microstructure of CFRP materials, alongside their high anisotropic mechanical properties, makes detecting defects very challenging. Consequently, detecting and identifying delamination in composite laminates is now a highly active research area. Researchers are continuously looking for a practical and cost-effective means of detecting and quantifying delamination. Zou et al. [Citation3] comprehensively reviewed the vibration-based techniques of structural monitoring that were developed for characterizing delaminated composite structures. Several inspection techniques such as ultrasound [Citation4], X-ray [Citation5], acoustic emission [Citation6], and optical fibre [Citation7] are common non-destructive testing procedures used to examine CFRPs. Methods using ultrasound or X-rays are able to detect tiny defects. However, their main weakness is the inability to handle big-sizes test objects, and the long duration and high costs of the examination. Monitoring damage occurring during the operation is another issue as well. Todoroki et al. [Citation8] used the variations in the electrical resistance of a laminated CFRP plate to detect delamination. The use of piezoelectric films or patches to detect delamination in CFRP materials has also been investigated extensively. Yin et al. [Citation9] used the voltage distribution of a piezoelectric film coated on the laminate surface as a sensor for delamination damage within an edge-delaminated CFRP beam.
In recent decades, the use of data from a vibration test has received particular attention. Because of the high maturity of vibration testing in several fields, vibration-based methods have been continually developed in academia and the industry over the past three decades. A comprehensive review of vibration-based health monitoring methods with emphasis on composite materials was made by Della et al. [Citation10] and Montalvao et al. [Citation11]. The main idea behind vibration-based investigation is that the presence of numerous structural damages, including delamination, reduce the local stiffness of structures and consequently induce alterations in their dynamic properties, such as modal damping, mode shape and mode natural frequency [Citation12]. Accordingly, by monitoring such changes, delamination can be not only detected but also quantified. A major advantage of modal analysis is the lessening in its cost and the easiness in its application. Usually, when it happens, the damage will slightly decrease the modal mass of the structure but considerably decrease its stiffness and increase its damping. For example, the investigation made by Roy et al. [Citation13] showed a good correlation between the presence of damage in a structure and the alteration of some of a structure’s modal properties. Based on their working principles, modal analysis methods are classified according to the following categories: changes in measured stiffness matrix methods [Citation14], modal shape curve methods [Citation15], modal shape changes methods [Citation16] and frequency response function method [Citation17]. In such investigations, both lower and higher modes of vibrations were considered. Depending on the damage location, the existence of localized and distributed defects have different influences on each one of the modes [Citation18]. That is why in previous reports, researchers mentioned that the number of treated modes ranged from 3 to 20, depending on the type of investigation and the accuracy targeted [Citation10,Citation19,Citation20]. However, Salawu [Citation21] suggested that higher modes of vibration provide a better indication for small damage. He also pointed out that tracing damage from changes in frequencies alone is unpractical.
Despite the effectiveness of this group of methods, they still suffer from numerous limitations. In particular, some of them can only detect damage when they are big enough and of particular forms. In certain cases, where the delamination is newborn, the modal frequencies could be insensitive [Citation22]. Moreover, besides the fact that monitoring of mode shapes usually requires taking measurements at numerous locations, it is also time-consuming. Sometimes, the results are difficult or even impossible to obtain because the excitation forces are not always available.
Moreover, the damping ratio variation acquired from delaminated structures was found to be very sensitive even for small damage sizes [Citation23]. However, because of numerous complications, such as the highly non-linear behaviour of CFRPs, or the dependence of damping measurement to environmental conditions (namely humidity and temperature), the use of damping measurement to quantify the delamination still has a way to go.
Because delamination has a softening effect on concerned structures by lowering their mechanical stiffness, any shift in frequency could be efficiently used to ascertain the existence of delamination [Citation23]. Since the frequency value is the only needed information, such techniques can be very cost effective. However, the variation of modal natural frequencies could not be enough for exact identification of the delamination location and extent. The solving of the inverse problem may be needed in that case.
Depending on its location and its stage of development, the structure debonding (crack or delamination) in practical engineering systems may be fully open, fully closed or may transit between the fully open and fully closed states. This is known as ‘breathing phenomenon’. The non-linear behaviour of breathing effect due to delamination had been analysed by several authors [Citation24,Citation25]. The phenomenon of opening and closing of the delamination (breathing) and contact/impact between the debonded layers during vibration was found to be very challenging both in experimental and numerical simulation [Citation26].
Signal processing methods have been widely incorporated with damage detection approaches to support structural health monitoring in composite structures. Nevertheless, traditional signal processing methods based on pure frequency domain have several limitations in their analysis. Indeed, a traditional Fourier operation, which is the essence of all spectrum analysis techniques, is applicable to structures with linear dynamic behaviour and thus cannot be applied blindly, and from any novice user to non-linear structures such as those made of composites. In addition, modern signal processing methods (e.g. wavelet transform, Hilbert–Huang transform) have potential advantages in structural health monitoring applications [Citation27]. Time-domain vibration-based methods represent a relatively new concept in the health condition monitoring of delaminated structures [Citation28]. These methods represent a very interesting substitute, especially for composite structures, because they assume no model beforehand or linearity of the structure being examined and require only the measured structural vibratory signals.
For the sake of simple and efficient methods, which are within reach of everyone and in order to avoid making false assumptions, following complicate experimental techniques or using tedious theoretical methods, some innovative ideas were proposed to simplify the delamination tracking process. In a recent study, Torabi et al. [Citation29] proposed a new practical procedure for detecting delamination in beam-like composite structures. This technique is based on having a movable simple support along the beam’s length which permits accurate identification of the axial location and length of the delamination based on the first natural frequency only.
Since CFRPs are popular in the transport industry, it is of great importance that delamination is detected and localized, and its severity known for the safety of millions of passengers. This paper focuses on a simplified modal analysis technique that aims to detect, localize and measure the severity of delamination in CFRP composites in a non-destructive manner. Contrary to what is commonly adopted in practice, where the mass of the accelerometer to be used should not exceed 10% of the structure’s mass, to avoid the alteration of its dynamic properties, in this work, we intend to deliberately interact or ‘interrogate’ the delamination by adding extra mass on top of the beam.
The rest of the paper is organized as follows: In Section 2, the manufacturing of the CFRP beam and the delamination inside it are explained. Section 3 provides background information on the dynamic behaviour of the composite structure. In Section 4, the measurement process and the experiment design are introduced and the results are presented. Section 5 concludes the paper.
Beam with delamination fabrication process
CFRP composite beams were manufactured via the vacuum assisted moulding method. Compared to other techniques such as manual construction, this method was implemented because of its ability to produce fewer bubbles inside the structure (which adversely affect the mechanical properties of the composite). To introduce delamination in the beam with multi-layers of carbon fibre, an Aluminium foil with 0.02 mm thickness was waxed on both sides and then placed in the middle of the stacking sequence as shown in . Based on that manufacturing process, delamination of different sizes ranging from 3 cm × 3 cm up to 3 cm × 6 cm was introduced in multiple carbon fibre composite beams.
Figure 2. Aluminium sheet (3 cm 3 cm) fitted within the carbon fibre layer.
Preliminary theoretical investigation
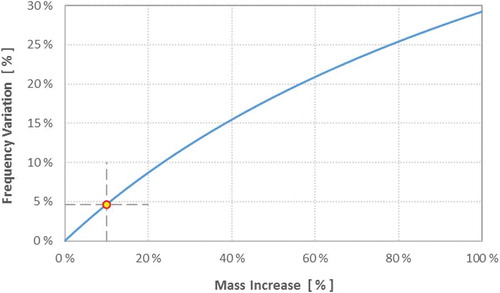
Delamination is essentially the separation of layers inside any composite structure. This separation causes a reduction in stiffness of the structure and may consequently reduce its modal frequencies. During a vibration-based application to measure the change in the natural frequency of composite laminates, the type, brand and location(s) of the sensors usually have a vital effect on the success of data acquisition. Many contact-based sensors (e.g., accelerometers, strain gauges) have disadvantages because they are surface-mounted and include wire connections for long-term monitoring. The unwanted effect of the sensor’s mass is another issue for monitoring lightweight composites. Indeed, for a system with a single degree of freedom, where the mass is and the stiffness is
, if the attached sensor has an extra mass
:
where α is the mass ratio of the sensor to the primary system, then the variation in the system natural frequency value will be given by the following equation:
As can be seen in generated from the previous equation, the heavier the sensor, the more noticeable is the frequency variation. For common applications, it is always recommended to keep the mass of the sensor less than 10% of the mass of the system to ensure the distortion of the frequency reading is below 5%.
Figure 3. Effect of the sensor’s extra mass on the natural frequency reading.
Moreover, when a vibration sensor is mounted on a fixed-fixed bar, such as the one being investigated in this research, and the mass of the sensor is negligible compared to the mass of the bar, the modal natural frequencies detected experimentally remain unchanged for all sensor’s positions. However, when the mass of the sensor is big enough, not to be neglected any more, its added value may induce a noticeable error in the readings. According to Rayleigh’s principle of energy conservation, an approximation of the first mode natural frequency, of the system displayed in , is given by the following formula:
Figure 4. Non-negligible mass installed on top of fixed-fixed bar.
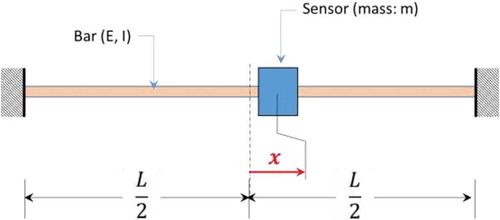
where E is the modulus of elasticity of the bar, I is the second moment of inertia, is the material density, A is the cross-section area,
is the added mass and
is the deflection at that point. The accuracy of this ratio depends on the convenient choice of the deflection function W(x). In particular, when
all the geometric boundary conditions (deflection and slope) are satisfied in the two end-points of the bar, and the final shape of the first natural frequency is:
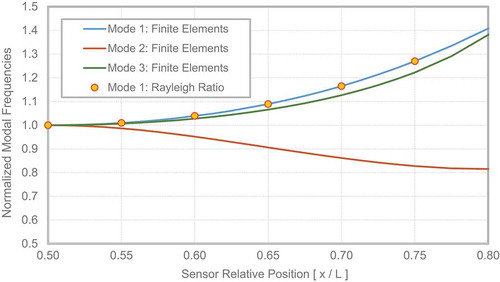
The results provided by this equation, and displayed in , prove that the sensor’s extra mass may have a significant effect on the accuracy of readings. In the particular case of light structure, where the sensor and the bar are having comparable masses, the frequency value of the first mode, normalized to the value obtained when the sensor is exactly in the middle position, may increase by up to 40% when the sensor’s location is around three-fourths of the length. The same result is confirmed by an FE simulation. Such a simulation shows that even the second and third modes are also affected by the non-negligible mass of the sensor.
Figure 5. Effect of the added mass on the three modal frequencies of a fixed-fixed bar.
However, contrary to common use, what we propose in this paper is to take advantage of the weight of a heavy sensor to localize the delamination inside a carbon fibre composite beam-like structure during vibration analysis. The main idea here is that, for vibration-based techniques, the presence of delamination (similarly for cracks) is usually recognized from the cyclic opening & closing of the imperfection (commonly called breathing). Therefore, if an extra non-negligible weight (due to the accelerometer, for example) is placed exactly on top of the delamination area, the breathing phenomenon will be made more difficult, the beam will be seen as gaining more stiffness locally and the vibration amplitude of the delaminated area will be significantly reduced by the accelerometer’s weight. In other words, the weight of the accelerometer will, to some extent, diminish the effects of the delamination and restrict its motion. When the sensor is moved across the delamination area, a sudden rise in the modal frequency is expected to be detected.
Experimental investigation
Modal analysis
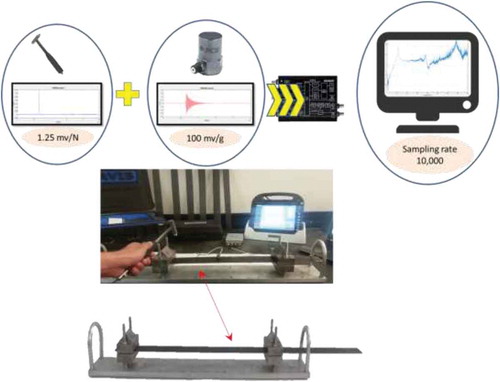
The characterization of the dynamical behaviour of healthy and delaminated composite beam-like structures was carried out using free decay vibration tests, commonly called impact tests. The free decay acceleration signals were mainly used to calculate the natural frequencies of the first three modes of vibration. Although the accuracy of modal frequency measurement is high, in many real-life situations, the presence of structural damage may generate measurement noise or disturbance that could result in a poor identification of the modal system’s characteristics, especially for high-order mode shapes. Therefore, some non-modal parametric methods, such as the autoregressive moving average (ARMA), represent a convenient, accurate and very efficient technique for modal parameter identification of mechanical systems, especially when the signal is noisy [Citation30,Citation31].
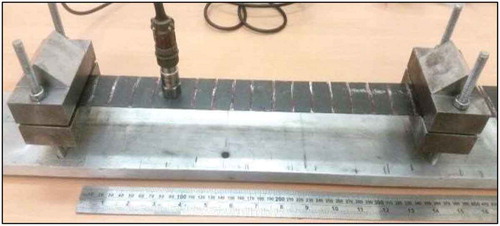
The current tests were undertaken with the set-up seen in . A special device was custom-manufactured to support the beam with different boundary conditions (fixed–fixed, pinned–pinned, or fixed–pinned). The case of a pinned support was eliminated because the support was sharp and quickly damaged the beams. Therefore, all the tests were carried with clamped ends. To excite all modes together, an external impulse was applied near the support with an impact hammer (Model PCB-086, 0–500 pounds, 10 mV/lb). The beams were 336 mm long, 43 mm wide and 1 mm thick. The mass of the accelerometer was 55 g, while the mass of the bar was only 34 g. A Data Translation portable analyser (Model DT98378) recorded the free decay acceleration signal of each specimen. During the vibration tests, the signals’ sampling rate was 10 kHz.
Figure 6. Modal analysis: experimental apparatus.
First set of experiments – effect of the position of the delamination on the modal frequencies
In this experiment, three CFRP beams were tested. These beams had areas of delamination measuring 30 mm × 60 mm, located at different positions from the right-hand support of the beam fixture: 50 cm, 71 cm and 105 cm. A healthy beam (12 layers, 285 mm in length) was also tested and taken as a reference. The summary of the results is displayed in .
Figure 7. Modal frequencies for delamination located at 50 mm, 71 mm and 105 mm.
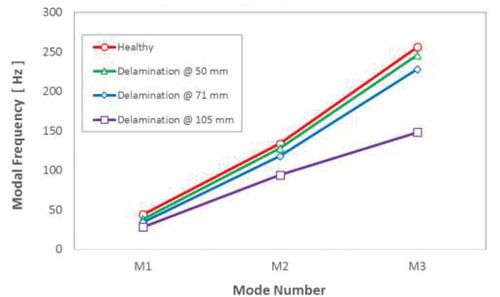
From this initial investigation, one can conclude that positioning the delamination away from the supports can enhance their detection, as the differences in frequencies between the delaminated and the healthy cases are greater.
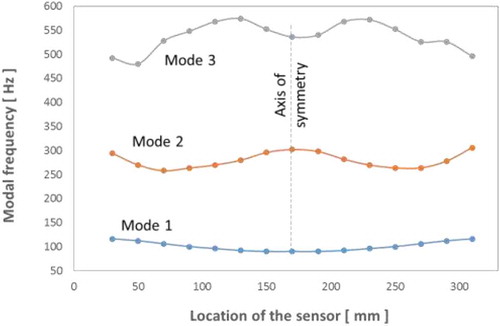
Second set of experiments: variation of the modal frequencies for a healthy beam
In an attempt to experiment with the technique of modal analysis of delaminated beams, two cases of geometrically identical healthy beams made from different materials (Brass and CRFP) were installed with a fixed–fixed configuration on the holding device and tested one after the other. The sensor was moved along the beam at regular steps of 2 cm each time to collect the vibration response, after hammering the beam with the force transducer. Contrary to what happened with the brass beam, for which no change in the frequencies was detected as the sensor’s position was changed, moving the same sensor over the thin CFRP beam was found to generate variable results for the three modes. This is probably because, in the case of the Brass beam, the accelerometer sensor’s mass is less than 10% of the beam’s mass. The relationship between modal frequencies and the sensor’s position are shown in . One can see the symmetrical behaviour of the readings with respect to the middle of the bar.
Figure 8. Sensor position versus the three modal frequencies.
Third set of experiments: symmetry-based approach
The main concept of this approach is based on tracking the symmetry of the mode shapes. If the symmetry with respect to the mid-point of the beam is not verified, this result would indicate the existence of delamination in the beam. To test this technique on a CFRP beam, a patch of delamination 3 cm in width was created at 60 cm from the left-hand support of the beam (see ).
Figure 9. Location of sensors relative to the supports and the axis of symmetry.
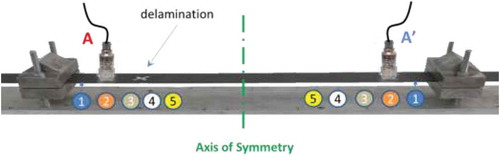
Different readings of modal frequencies were collected from both sides of the beam’s axis of symmetry, as displayed in and .
Table 1. Sensor location and frequency shift for the second mode.
Table 2. Sensor location and frequency shift for the third mode.
The results clearly show that the symmetrical shape of the curves does not hold any more. In both cases, the maximum frequency variation was located at around 50–70 cm, where the delamination was intentionally seeded. The difference in the frequencies between points A and A’ located on both sides of the axis of symmetry are computed by using Equation (5) and the results are displayed in and .
Figure 10. Frequency shift for the second modal frequency.
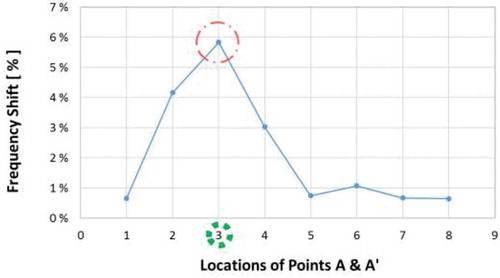
Figure 11. Frequency shift for the third modal frequency.
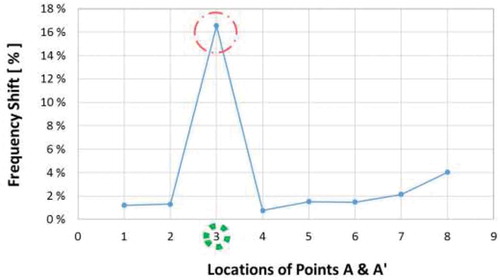
After we applied the symmetrical modal frequency concept to the delaminated CFRP beam, the obtained results clearly showed unsymmetrical behaviour around the beam’s mid-point. The percentage difference of the modal frequencies, normalized with respect to the highest value, and computed at the same distance from the mid-point of the beam, clearly indicates the existence of delamination. In the ideal case where no delamination exists, the modal frequency graph should be symmetrical, and the percentage difference would equal zero or close to it. However, in the case of a delaminated beam, the graphs of modal frequency versus the sensor’s position are obviously unsymmetrical, and the percentage difference curves have peak values in the vicinity of the delamination. and show a high percentage difference value between 50 and 70 mm from the beam’s support.
Based on these results, one can state that the symmetry approach can identify the existence of delamination in the CFRP beams. However, it is not very accurate for the location of the delamination area.
Fourth set of experiments: restricted motion-based approach
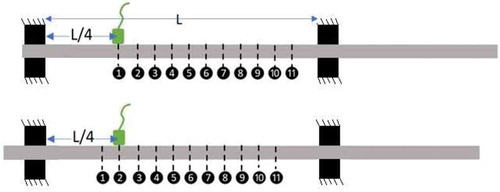
The procedure followed in this method involved placing the accelerometer at a fixed position with respect to the support while moving the beam along the axis of the beam’s length after recording the modal frequencies. A schematic drawing is shown in of the CFRB beam, which has fixed supports on both sides.
Figure 12. Schematic representation of the restricted motion-based method.
The following are the main steps to be followed in this method:
The beam must first be marked (with a permanent marker or chalk) so that the markings are all equally apart from each other across the whole beam (the schematic only shows 11 points but markings can be made along the whole beam). The distance between markings should not be larger than 2 cm as a small area of delamination can be missed if the distance between consecutive markings is large. The point number (1, 2, 3, etc.) must be noted, along with the distance between the point and one edge of the composite beam.
An accelerometer should be placed at an L/4 position from the left-hand support (shown in the drawing), which is the position of a peak in the second modal frequency and therefore will provide a clear frequency-response function (FRF) for the second mode.
Initially, the first point should be set underneath the accelerometer and the second modal frequency must be noted along with the point number.
The beam then must then be slid to the left and re-secured so that the accelerometer (still L/4 away from the left support) is on top of the second marking on the beam. As before, the second modal frequency must be noted along with the respective point number.
Step 4 must be repeated for all the markings made on the beam.
Finally, a graph should be plotted to show the variation of the modal frequency against the point location with respect to the edge of the beam. Any peaks in the graph can be an indication of delamination.
The same procedure is to be followed for tracking the first mode, except that the accelerometer must be placed at L/2 at all times.
The previously described procedure was implemented for a 20-layer cross-ply CFRP composite beam 336 mm in length with 2 cm marking intervals. The beam was given a delamination area measuring 30 mm × 30 mm, located at 85 mm from the left-hand edge (see ).
Figure 13. Placement of the accelerometer.
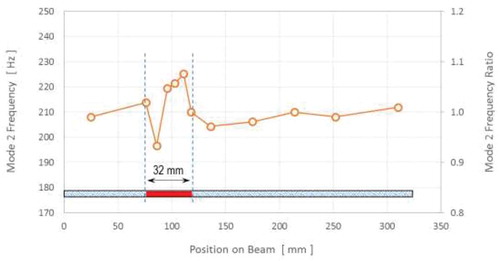
Application of this experimental procedure for the first and second modes of bending generated the graph displayed in and . When sliding the beam intermittently to the left, and therefore relatively moving the sensor to the right of the beam, the first modal frequency was expected to fluctuate as predicted by the previously developed Equations (5) and (6). In the absence of any delamination, such fluctuation would remain continuous and monotonous. However, between the limits of 86 and 118 mm, the modal frequency was observed to undergo a sudden variation (around of initial value). These are the limits of the seeded delamination under the surface. This was a practical indication that the accelerometer was placed on top of the delamination, giving consequently more local stiffness to the beam. After the point located at 136 mm, the sensor moves away from the delamination and the frequency variation lean towards stabilization. Similar behaviour is also observed for the second modal frequency. Both graphs show an increase in frequency between 86 mm and 118 mm from the left-hand end. The delamination length was measured as 32 mm, which represented around 9.5% of the beam length. In conclusion, one can state that this method can accurately detect not only the location of the delamination but also its length. The only disadvantage of this method is that the multiple tasks of tightening and loosening the structure, which is time-consuming.
Figure 14. Variation in the first modal frequency according to the restricted motion method.
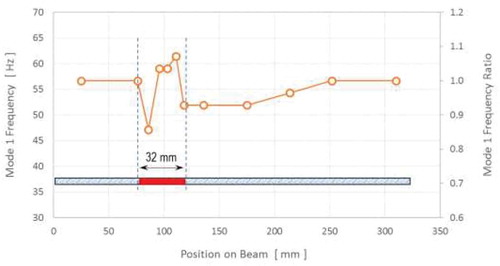
Figure 15. Variation in the second modal frequency according to the restricted motion method.
Conclusion
The research described in this paper aimed to present a new simplified way to detect delamination inside carbon fibre composite beams. The procedure involved placing the accelerometer in a fixed location, while moving the CFRP beam gradually from right to left, between its supporting devices. The main idea behind the method was that, if the accelerometer was placed directly above the delamination, its weight would restrict the breathing of the delamination, and the response would indicate a stiffer beam. The results showed a sudden amplification in the responses when the sensor is moved between the two positions located at 86 mm and 118 mm. This span of 32 mm is very close to the value of 30 mm, which was the real length of the seeded delamination. By avoiding complicate and excessive developments, this simplified method was able to localize and quantify a delamination of 9.5% of the beam’s length.
Disclosure statement
No potential conflict of interest was reported by the authors.
Additional information
Funding
Related Research Data
References
- Modeling Cracks and Delaminations in Carbon Fiber Composites, Center for Nondestructive Evaluation. Iowa state University. Carbon fiber composite laminates. Available from 2018 Dec 24: https://www.cnde.iastate.edu/research/ultrasonic/ultrasonic-and-composites/modeling-cracks-and-delaminations-in-carbon-fiber-composites/
- Trendafilova I, Palazzetti R, Zucchelli A. Delamination assessment in structures made of composites based on general signal correlation. Int J Str Stab Dyn. 2014;14(08):1440022.
- Zou Y, Tong LPSG, Steven GP. Vibration-based model-dependent damage (delamination) identification and health monitoring for composite structures—a review. J Sound Vib. 2000;230(2):357–378.
- Katunin A, Dragan K, Dziendzikowski M. Damage identification in aircraft composite structures: A case study using various non-destructive testing techniques. Compos Struct. 2015;127:1–9.
- Jasinien E, Raiutis R, Voleiis A, et al. NDT of wind turbine blades using adapted ultrasonic and radiographic techniques. Insight-Non-Destructive Test Condition Monit. 2009;51(9):477–483.
- Boominathan R, Arumugam V, Santulli C, et al. Acoustic emission characterization of the temperature effect on falling weight impact damage in carbon/epoxy laminates. Compos Part B Eng. 2014;56:591–598.
- Antunes P, Varum H, Andréa P. Optical FBG sensors for static structural health monitoring. Procedia Eng. 2011;14:1564–1571.
- Todoroki A, Tanaka M, Shimamura Y. Electrical resistance change method for monitoring delaminations of CFRP laminates: effect of spacing between electrodes. Compos Sci Technol. 2005;65(1):37–46.
- Yin L, Wang XM, Shen YP. Damage-monitoring in composite laminates by piezoelectric films. Comput Struct. 1996;59(4):623–630.
- Della CN, Shu D. Vibration of delaminated composite laminates: A review. Appl Mech Rev. 2007;60(1):1–20.
- Montalvao D, Maia NMM, Ribeiro AMR. A review of vibration-based structural health monitoring with special emphasis on composite materials. Shock Vib Dig. 2006;38:295–324.
- Cao M, Radzien´Ski M, Xu W, et al. Identification of multiple damage in beams based on robust curvature mode shapes. Mech Syst Sig Process. 2014;46(2):468–480.
- Roy K, Agrawal S, Bhattacharya B, et al. Fundamental mode shape to localize delamination in cantilever composite plates using laser doppler vibrometer. In: Advances in structural engineering. Indian Institute of Technology. New Delhi: Springer; 2015. p. 2621–2633.
- Salawu OS, Williams C. Structural damage detection using experimental modal analysis - a comparison of some methods. In: Proceedings of the 11th International Modal Analysis Conference. The International Society for Optical Engineering. 1993. p. 254–260.
- Salawu OS, Williams C. Damage location using vibration mode shapes. In: Proceedings of the 12th International Modal Analysis Conference, Honolulu, Hawaii, USA. 1994. p. 933–939.
- Lam HF, Ko JM, Wang CW. Detection of damage location based on sensitivity analysis. In: Proceedings of the 13th International Modal Analysis Conference, Nashville, Tennessee, USA. 1995. p. 1499–1505.
- Thyagarajanm SK, Schulz J, Pf P. Detecting structural damage using frequency response functions. J Sound Vib. 1998;210:162–170.
- Gomes AJMA, Silva JMME. On the use of modal analysis for crack identification. In: Proceedings of the 8th International Modal Analysis Conference. FL; 1991. p. 1108–1115.
- Okafor AC, Chandrashekhara K, Jiang YP. Delamination prediction in composite beams with built-in piezoelectric devices using modal analysis and neural network. Smart Mater Struct. 1996;5:338–347.
- Chakraborty D. Artificial neural network based delamination prediction in laminated composites. Mater Des. 2005;26:1–7.
- Salawu OS. Detection of structural damage through changes in frequency: a review. Eng Struct. 1997;19:718–723.
- Yang Z, Wang L, Wang H, et al. Damage detection in composite structures using vibration response under stochastic excitation. J Sound Vib. 2009;325:755–768.
- Modena C, Sonda D, Zonta D. Damage localization in reinforced concrete structures by using damping measurements. Key Eng Mater. 1999;167:132–141.
- Wenguang L, Mark EB. The effects of breathing behaviour on crack growth of a vibrating beam. Shock Vib. 2018;12:2018. Article ID 2579419.
- Ouahabi A, Thomas M, Lakis AA. Detection of damage in beams and composite plates by harmonic excitation and time-frequency analysis. In: Proceedings of the 3rd European Workshop on Structural Health Monitoring. Granada, Spain; 2006. p. 775–782.
- Actis R, Dimarogonas AD. Non-linear effects due to closing cracks in vibrating beams. Am Soc Mech Eng Des Eng Div. 1989;18:99–104.
- Hou Z, Noori M, Amand RS. Wavelet-based approach for structural damage detection. J Eng Mech. 2000;126(7):677–683.
- Nichols JM, Seaver M, Trickey ST. A method for detecting damage-induced nonlinearities in structures using information theory. J Sound Vib. 2009;322:438–453.
- Torabi K, Shariati-Nia M, Heidari-Rarani M. Moving support technique for delaminatoin detection in laminated composite beams using the first natural frequency. J Reinf Plast Compos. 2017;36(15):1116–1128.
- Xuan Z, Dongsheng L, Gangbing S. Structure damage identification based on regularized ARMA time series model under environmental excitation. Vibration. 2018;1:138.
- Gauthier PE, Gontier C, Smail M. Robustness of an ARMA identification method for modal analysis of mechanical systems in the presence of noise. J Sound Vib. 1995;179(2):227–242.