
ABSTRACT
The current research investigates the employment outcomes of Career Technical Education (CTE) from California community colleges. We used three years of data from the California Community Colleges Career Technical Education Outcomes Survey – a survey of former community college students. We documented overall positive employment outcomes. Students earned a higher hourly wage (Hypothesis 1), improved their work status (Hypothesis 2), and improved their work term (Hypothesis 3) after their schooling compared to before their schooling, whether or not the student earned a degree or certificate. We also documented that wage increases were positively related to the degree to which participants’ job is related to their field of study. These results are consistent with the intended industry-specific curriculum of CTE programs: California Community College students receive positive employment outcomes from the training they receive in their CTE program.
Research on the employment outcomes of a college education in the United States has primarily focused on four-year degrees, yet over 40% of college students attend a community college (reviewed in Belfield & Bailey, Citation2017a). In California, over two thirds of all college students attend community college (Stevens, Kurlaender, & Grosz, Citationin press). California possesses a large economy that is unique from the rest of the U.S., and its skilled labor force depends heavily on training from community colleges. The current research investigates the labor market returns of a California community college education.
Quantitative research on the labor market returns of California community colleges has relied exclusively on administrative data. The California Community Colleges Chancellor’s Office Management Information System (COMIS) collects information about California community college students’ demographics, course-taking behavior, and degree receipt by term. These data are matched to the state’s unemployment insurance (UI) system. UI wage data contains quarterly earnings that date back multiple years, thereby providing extensive longitudinal data. Such longitudinal data permit analyses (e.g., mincer earnings functions, fixed-effects specification models) that can control statistically for individual-level confounds (e.g., household income, assessment scores). Several studies using administrative data have documented positive wage earnings for students with a sub-baccalaureate education in California (Bahr, Citation2014; Friedlander, Citation1996; Sanchez & Laanan, Citation1997, Citation1998; Sanchez, Laanan, & Wiseley, Citation1999; Stevens et al., Citationin press).
There are limitations to using administrative data. First, UI wage data do not report the number of hours an employee works. Thus, an increase in earnings among non-salaried employees may be attributable to an increase in the number of work hours (rather than securing higher hourly wages). Second, UI wage data do not contain employee occupation. Many sub-baccalaureate programs prepare students for industry-specific careers. Thus, administrative data cannot determine whether students actually secured employment in the industry for which they were trained. Third, UI wage data do not cover some forms of employment, which represents 11% of the civilian labor force (Feldbaum & Harmon, Citation2012). Fourth, UI wage data do not track those who work outside California. Fifth, fixed-effects estimates (i.e., statistical analyses that profit from longitudinal data and can partial over unobservable, individual-level confounds) are sensitive to missing data and sample restrictions (Belfield & Bailey, Citation2017b). Despite these limitations, administrative data provide robust data that mitigate individual-level confounding effects.
An alternative methodology to administrative data is survey data – where former college students self-report their employment outcomes and wages. Survey data have been used to assess the economic outcomes of sub-baccalaureate education using national datasets, as well as state-level datasets outside California. Grubb (Citation1995) pioneered early work documenting positive earnings from sub-baccalaureate education using national surveys from the National Center of Education Statistics (e.g., National Longitudinal Study 72, Survey of Income and Program Participation). These findings are robust across other studies and other nationally representative surveys, such as the Beginning Postsecondary Students Longitudinal Study, the High School and Beyond Study, the National Longitudinal Survey of the Labor Market Experience of Youth, and the National Education Longitudinal Study (Bailey, Kienzl, Marcotte, & National Assessment of Vocational Education, Citation2004; Kane & Rouse, Citation1995; Marcotte, Bailey, Borkoski, & Kienzl, Citation2005).
Despite the replicability of findings across studies using national data, Grubb (1995) argued that local-level data – rather than national data – is more useful for prospective students and policymakers. California is so large and so sufficiently unique from other states that it merits its own investigation. In 2016, California had the sixth largest economy by GDP when ranked against other countries (Nichols, Citation2016). Furthermore, UI wage data do not cover some occupations that are strongly represented in California, in particular. For example, California has the largest agricultural industry in the United States (California Department of Food and Agriculture, Citation2017), and UI wage data do not capture many agricultural labor services and alien farm workers (Feldbaum & Harmon, Citation2012). Undocumented immigrants – who also are not captured by UI wage data – comprises 9.0% of California’s labor force, the second largest concentration of undocumented workers in the United States (Public Policy Institute of California, Citation2017). Given the limitations of administrative data, and given that national survey data cannot easily extend to California’s unique and large economy, the current research addresses these significant gaps in the literature by using novel survey data drawn from California community college students.
We focus on Career and Technical Education students (CTE; also known as vocational or occupational) – a subsample of sub-baccalaureate students who differ from academic students. These students are particularly relevant to the current research because CTE programs are specifically designed to improve employment outcomes by training students for industry-specific labor. Associate degrees yield better employment outcomes among CTE students than among academic students (Bahr, Citation2014; Grubb, Citation2002). The employment outcomes of CTE education are particularly greater among academically or economically disadvantaged students (Bailey et al., Citation2004). The current research focuses specifically on CTE students.
We use data from the California Community College Career Technical Education Employment Outcomes Survey (CTEOS) – an annual survey of former CTE students in California which began with a pilot study involving fifteen colleges in 2012. Each year since, more colleges have participated and by 2017 all 113 California Community Colleges participate. The California Community Colleges comprise the largest system of higher education in the United States, enrolling nearly three million students in 2016–2017. Thus this large scale survey is an important source of data and information on the employment outcomes of community college students who enroll in CTE programs.
There exists no published quantitative research using CTEOS data. Alder (Citation2013) used pilot data from the 2012 CTEOS and reported descriptive and qualitative results using guided narrative interviews on a subsample of eleven CTEOS respondents. Alder found overall positive employment outcomes for these interviewees: Seven were currently employed, six of whom were employed in their field of study. Eight interviewees indicated employment-related goals for their primary purpose of study.
The current research is the first to use CTEOS data to investigate the labor market returns of CTE students in California. We hypothesize that students will earn a higher hourly wage (Hypothesis 1), improve their work status (e.g., unemployed, part-time, full-time; Hypothesis 2), and improve their work term (e.g., unemployed, temporary/seasonal, permanent; Hypothesis 3) after their schooling compared to before their schooling.
In 2016, California passed legislation in which funding for CTE programs is based on an incentive funding model (Strong Workforce Program, Citation2017). Part of this performance-based funding depends on whether students obtain employment in a job closely related to their field of study. Therefore, we also investigated whether wage gains are influenced by the degree to which employment is related to the field of study.
Method
Participants
We use CTEOS data that was collected between 2014 and 2016. Each year, individual colleges volunteered to participate, and only students from those volunteering schools were recruited. We secured from COMIS a list of students who met at least one of three criteria: those who received a vocational/CTE award that is Chancellor’s Office approved, those who received a vocational/CTE award of at least six units that is not Chancellor’s Office approved, and those who completed nine units during the prior three years from at least one course that COMIS labels as apprenticeship, advanced occupational, or clearly occupational. Thus, both completers (earned a degree or certificate) and skills builders (those who in theory gained significant skills without earning an award). This participation requirement must have been fulfilled during the school year that occurred two years before the survey was administered (e.g., students who fulfilled the criteria during the 2012–2013 school year were recruited for only the 2015 CTEOS). Because students require time to improve their employment outcomes after they leave school (e.g., to job search: Grubb, Citation1999) we excluded participants who were enrolled in six or more units anywhere in the California community college system during the year before the survey was administered. This methodology also eliminates continuing students who may be pursuing more advanced CTE training that could impact their employment outcomes. These participation requirements generated three non-overlapping cohorts, hereto referred to as CTEOS 2014, CTEOS 2015, and CTEOS 2016 cohorts.
Procedures
COMIS provided the list of eligible students alongside administrative information about those students (e.g., age, ethnicity, gender, SSN or unique student ID, awards earned). Each participating college provided student contact information (first and last name, email address, mailing address, phone number) for the identified cohort of CTE students. The survey was distributed in three sequentially non-overlapping recruitment phases. All potential participants were first recruited for the first phase. Non-respondents from the first phase were recruited for the second phase, and non-respondents from the second phase were recruited for the third phase. Potential participants were contacted by email to complete the online survey (first phase), then by US-mail to complete the hard-copy survey (second phase; note that participants were provided with a self-addressed stamp envelope to return the survey), and finally by phone to complete a computer-assisted telephone interview that was conducted by a central call center (third phase). The survey items were identical among all three modalities and among all years the CTEOS was administered.
Online CTEOS surveys (first phase) were collected and prepared using Survey Monkey (2014) and Qualtrics (2015 and 2016). Hard-copy CTEOS surveys (second phase) were coded and prepared using Snap Surveys. Phone CTEOS surveys (third phase) were coded and prepared by the central call center using WinCATI and Ci3 Software. CTEOS data from all three modalities were then merged with COMIS data to generate the final datasets.
Materials
COMIS provided data on participant’s age, gender, ethnicity, type of award earned (e.g., Associate degree, certificate), and other administrative data. Participants reported on the CTEOS their current employment status by selecting from this list: self-employed, employed at one job, employed at more than one job, unpaid work and not seeking paid employment, unpaid work and seeking paid employment, unemployed and seeking employment, or unemployed and not seeking employment. Participants reported the main impact their courses had on their employment by selecting from this list: allowed me to stay in my current job, allowed me to get a promotion at my same organization, allowed me to get a job at a new organization, allowed me to start my own business, prepared me for a possible new job, no impact, or other (open-ended). Participants reported whether they were still seeking employment, whether their job search was successful, and the number of months they spent job searching before they found a job. Participants reported the primary reason they studied at their college, the reason why they are not taking as many classes as they have in the past, and whether they transferred.
Participants who currently held paid employment answered questions about their employment, including how closely related is their field of study to their job (very close, close, not close), employment status (full time: 40 weekly hours, part time: <20 hours weekly hours, part time: >20 weekly hours), employment term (permanent, temporary, seasonal), average hourly wage, the length of time they have been currently employed (in months/years), whether they are seeking a job in a different field, and their employer’s zip code. Participants who were employed before their training and coursework reported their average hourly wage, employment status (full time: 40 weekly hours, part time: <20 hours weekly hours, part time: >20 weekly hours), and employment term (permanent, temporary, seasonal).
Results
displays descriptive statistics on demographic information, response rates, and sample sizes. We conducted reliability analyses to assess whether our survey had internal consistency. We dichotomized the responses (“transferred”, “non-transferred”) from each of the following three questions: (1) the primary reason they studied at their college, (2) the reason why they are not taking as many classes as they have in the past, and (3) whether they transferred. Cronbach’s alphas were very high, indicating very high reliability (α = .87, .82, and .83 for CTEOS 2014, 2015, and 2016, respectively). Whether a participant indicates transferring as their primary goal may differ from whether that participant actually transferred. Thus, we repeated the reliability analyses and excluded the responses from the primary reason they studied at their college. Cronbach’s alphas remained very high (α = .90, .87, .88 for CTEOS 2014, 2015, and 2016, respectively).
Table 1. Descriptive statistics on COMIS population and CTEOS sample.
We investigated the percentage of participants who obtained work in another state – a group that is not covered in the UI wage data. We matched participants’ employer’s zip code against the United States Postal Service database of zip codes, which allowed us to determine which participants worked out-of-state (see ). Of the respondents who were currently employed, 6.3% (2014), 7.0% (2015), and 6.7% (2016) worked for an employer outside California (see ). also provides descriptive statistics on other subsamples that are not covered by administrative data (e.g., students without SSNs, self-employed).
In tests of all hypotheses, we excluded from the COMIS population those who did not respond to the survey because each of the three hypotheses relies on data from the survey: reported wages (Hypothesis 1), employment status (Hypothesis 2), and employment term (Hypothesis 3). Additionally, we excluded participants who report only taking classes for self-enrichment because these participants are explicitly stating that the purpose of their schooling was not to improve their employment outcomes. After these exclusion criteria, the number of participants who remained in tests of hypotheses were 9737 (2014), 11432 (2015), and 25473 (2016). We disaggregate analyses by transfer versus non-transfer students because transfer students voluntarily seek part-time employment or no employment to focus on schooling. All analyses are disaggregated by year (2014, 2015, and 2016).
Hypothesis 1:
Did participants obtain an hourly wage increase after schooling compared to before schooling?
displays the median wage before and after schooling, disaggregated by year. Because these are median wages, the wages appear rounded to the nearest dollar or half-dollar. We did not round any wages. Rather, the typical person receives wages that appear rounded. We excluded participants who reported wages below $8.00 – California’s minimum wage during the time we conducted this research (Department of Industrial Relations, Citation2016). Sub-minimum wage participants may include servers who did not report their tips, and those in the military who estimate their hourly wages based on 24-hour work days. Such wages are not easily interpretable and, therefore, were excluded from analyses. We conducted Wilcoxon signed-rank tests (a non-parametric analysis to compare the averages between two groups) to determine whether participants obtain an hourly wage increase after schooling compared to before schooling, disaggregated by year and by transfer versus non-transfer. We chose a non-parametric test because testing the differences of medians (rather than means) is more appropriate when analyzing wage data. In particular, wage data often contain non-random outliers that violate assumptions of parametric tests. See for Wilcoxon signed-rank results. Consistent with Hypothesis 1, participants obtained an hourly wage increase after schooling compared to before schooling.
Table 2. Median wage earnings before and after schooling.
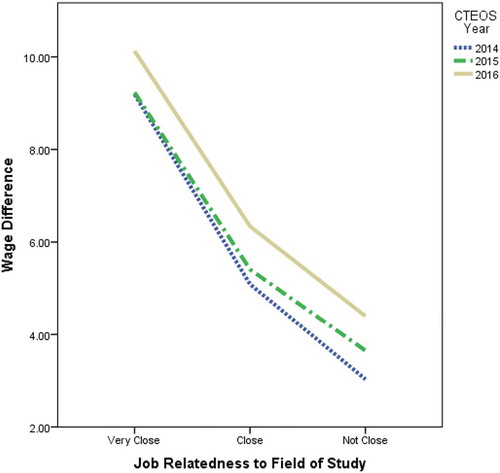
We investigated whether wage gains were influenced by the extent to which participants obtained a job that is related to their field of study (disaggregated by year). We first computed wage differentials by subtracting post-schooling wages from pre-schooling wages (see ). Using these difference scores, we conducted two tests (one-way ANOVA and Kruskal-Wallis) to compare the wage differentials among three groups: My work is (1) very close, (2) close, or (3) not close to my field of study. These tests (one-way ANOVA and Kruskal-Wallis) are appropriate for testing the difference of averages among multiple groups. The ANOVA and the Kruskal-Wallis tests were significant for each of the three CTEOS years (see ). We conducted post-hoc comparisons among the three groups (Bonferroni corrected) to determine which pairwise comparisons were statistically significant. We found significant differences between each possible pairwise comparison. Specifically, participants who found a job that is “very closely related” to their field of study obtained a significantly greater wage increase than the other two groups, and participants who found a job that is “closely related” to their field of study obtained a significantly greater wage increase than those who reported having a job “not closely related” to their field of study (see ).
Hypothesis 2:
Does schooling have a positive impact on employment status?
Table 3. Wage differences between post-schooling and pre-schooling, disaggregated by relatedness of job to feld of study.
Figure 1. Wage differences between post-schooling and pre-schooling, disaggregated by relatedness of job to field of study.
We ranked the three employment status levels from worst to best: Unemployed was ranked as the worst of the three, and full-time was the best of the three. We treated employment status as an ordinal ranking variable because the magnitude of the difference between the levels is not quantifiable (e.g., part-time is not measurably twice as positive as unemployed). We computed two ordinal ranking variables based on employment status – one for employment before schooling and another for employment after schooling: (1) unemployed, (2) part-time, and (3) full-time. Next, we classified participants into two groups based on their employment status after schooling compared to before schooling: Hits were participants who moved to a higher rank (indicating an improvement in employment status), or who remained at the highest rank (indicating a successful retention of full-time employment). The remaining participants were classified as misses (e.g., moved to a lower rank, remained part-time/unemployed). We conducted a binomial test (50% test proportion) to investigate whether schooling had a positive impact on employment status (i.e., more “hits” than “misses). We conducted separate analyses for transfer students versus non-transfer students. Consistent with Hypothesis 2, schooling had a significantly positive impact on employment status of non-transfer students: The percentage of hits were 63% (2014), 70% (2015), and 66% (2016; all ps < .001). We repeated the same analyses for transfer students. Schooling had a significantly negative impact on employment status of transfer students: 46% (2014) 47% (2015) 47% (2016; all ps < .001).
Hypothesis 3:
Does schooling have a positive impact on employment term?
We ranked the three employment term levels from worst to best: Unemployed was ranked as the worst of the three, and permanent was the best of the three. We treated employment term as an ordinal ranking variable because the magnitude of the difference between the levels is not quantifiable. We computed two ordinal ranking variables based on participant employment term – one for their employment before their schooling and another for their employment after their schooling: (1) unemployed, (2) seasonal/temporary, and (3) permanent. Similar to our classification system of employment status after schooling versus before schooling, participants were classified as hits if they moved to a higher rank or if they remained at the highest rank (i.e., permanent). The remaining participants were classified as misses (e.g., moved to a lower rank, remained seasonal/temporary/unemployed). We conducted a binomial test (50% proportion) to test whether schooling had a positive impact on employment term (i.e., more “hits” than “misses). We conducted separate analyses for transfer students versus non-transfer students. Consistent with Hypothesis 3, schooling had a significantly positive impact on employment term of non-transfer students: The percentage of hits were 72% (2014), 81% (2015), and 73% (2016; all ps < .001). Schooling also had a significantly positive impact on employment term among transfer students: 54% (2014), 64% (2015), and 59% (2016; all ps < .001).
Discussion
The results of the current research support all three hypotheses: Students earned a higher hourly wage (Hypothesis 1), improved their work status (Hypothesis 2), and improved their work term (Hypothesis 3) after their schooling compared to before their schooling, whether or not the student earned a degree or certificate. These results support the broader thesis that CTE programs in California community college provide students with positive employment outcomes. We also documented that wage increases were positively related to the degree to which participants’ job is related to their field of study. These results are consistent with the intended industry-specific curriculum of CTE programs.
The primary purpose of the current research is to demonstrate the value of CTEOS data (and survey data, in general) when investigating labor market returns. To concisely fulfill this purpose, we limited our investigation to broad, state-wide analyses across all programs. Previous research have found significant heterogeneity in employment outcomes across different programs of study. For example, programs in health-related fields (e.g., nursing) often produce greater market outcomes than other CTE programs (Stevens et al., Citationin press). Furthermore, labor market outcomes vary significantly when students are classified in more refined groups – beyond the two groups of completers and skills-builders (Bahr, Citation2013; Bahr, Bielby, & House, Citation2011). Future research using CTEOS data would profit from additional analyses involving more granular disaggregation (e.g., program type, ethnicity, student typology).
We documented that transfer students were more likely to experience negative outcomes in employment status, whereas non-transfer students experienced positive outcomes. These results are unsurprising because transfer students voluntarily pursue part-time employment (or no employment) to focus on their schooling. Because employment status are not provided from administrative data, these findings highlight the importance of survey data when understanding the complete picture surrounding employment outcomes.
A limitation of the current research is that we were unable to control for inflation. We did not collect data to precisely identify the month and year during which participants earned their pre-schooling wages. Although statistically controlling for inflation would reduce the wage gains that we documented, the wage gains would presumably remain significantly positive, given the large body of literature indicating similar post-schooling wage gains (reviewed in Belfield & Bailey, Citation2017). Nevertheless, future survey research would benefit from securing longitudinal survey data in which participants report their earnings across multiple quarters.
In conclusion, the current research highlights the utility of survey data, in general, and CTEOS data, in particular. We reported descriptive statistics on three subsamples that are not captured in UI wage data: 5.0% to 6.3% of California community college students did not report their SSN, 9.0% to 9.5% of currently employed CTEOS respondents were self-employed, and 6.3% to 7.0% reported being employed outside California. These are non-trivial percentages, especially for policymakers. Furthermore, survey data provides important psychological data that are not readily apparent from behavioral data. Specifically, we were able to exclude from analyses students who are not taking courses to improve employment outcomes (e.g., those not seeking employment, those taking classes for fun or self-enrichment). Additionally, CTEOS data allowed the investigation of whether the similarity between program of study and occupation moderate the relationship between the effects of schooling and employment outcomes. Finally, we found evidence that CTE programs in California are fulfilling their intended purpose of providing industry-specific positive employment outcomes. Although administrative data provide a rich source of longitudinal data capable of statistically controlling for individual-level confounds, the current research demonstrates that a complete investigation of the labor market returns of a sub-baccalaureate education require survey data.
References
- Alder, K. (2013). Invisible value of postsecondary career and technical education: A qualitative perspective (Doctoral dissertation). Retrieved from ProQuest. (3594443)
- Bahr, P. R. (2013). Classifying community colleges based on students’ patterns of use. Research in Higher Education, 54, 433–460. doi:10.1007/s11162-012-9272-5
- Bahr, P. R. (2014). The labor market return in earnings to community college credits and credentials in California. Ann Arbor: Center for the Study of Higher and Postsecondary Education, School of Education, University of Michigan. Retrieved from http://www.soe.umich.edu/people/profile/peter_riley_bahr/
- Bahr, P. R., Bielby, R., & House, E. (2011). The use of cluster analysis in typological research on community college students. New Directions for Institutional Research, S1, 67–81.
- Bailey, T., Kienzl, G. S., Marcotte, D. E., & National Assessment of Vocational Education (U.S.). (2004). The return to a sub-baccalaureate education: The effects of schooling, credentials and program of study on economic outcomes. Washington, DC: National Assessment of Vocational Education, U.S. Dept. of Education.
- Belfield, C. R., & Bailey, T. (2017a). The labor market returns to sub-baccalaureate college: A review (CAPSEE Working Paper). New York, NY: CAPSEE.
- Belfield, C. R., & Bailey, T. (2017b). Model specifications for estimating labor market returns to associate degrees: How robust are fixed effects estimates (CAPSEE Working Paper). New York, NY: CAPSEE.
- California Department of Food and Agriculture. 2017. Retrieved from https://www.nass.usda.gov/Statistics_by_State/California/Publications/Annual_Statistical_Reviews/2017/2016cas-all.pdf
- Department of Industrial Relations. (2006, January). History of California minimum wage. Retrieved from https://www.dir.ca.gov/iwc/MinimumWageHistory.htm
- Feldbaum, M., & Harmon, T. (2012). Using unemployment insurance wage data to improve program employment outcomes: A technical assistance guide for community and technical colleges. Retrieved from https://www.achievingthedream.org/sites/default/files/resources/Using%20UI%20Wage%20Data.pdf.
- Friedlander, J. (1996). Using wage record data to track the post-college employment rates and wages of California community college students. Retrieved fromhttps://archive.org/details/ERIC_ED390507.
- Grubb, W. N. 1999. Retrieved from https://eric.ed.gov/?id=ED431459
- Grubb, W. N. (2002). Learning and earning in the middle, part I: National studies of pre-baccalaureate education. Economics of Education Review, 21, 299–321.
- Grubb, W. N. 1995. Retrieved from https://eric.ed.gov/?id=ED382839
- Kane, T., & Rouse, C. (1995). Labor-market returns to two- and four-year colleges. American Economic Review, 85, 600–614.
- Marcotte, D. E., Bailey, T., Borkoski, C., & Kienzl, G. S. (2005). The returns of a community college education: Evidence from the national education longitudinal survey. Educational Evaluation and Policy Analysis, 27, 157–175. doi:10.3102/01623737027002157
- Nichols, C. (2016). Does California really have the ‘6th largest economy on planet Earth?’ Politifact. Retrieved from http://www.politifact.com/california/statements/2016/jul/26/kevin-de-leon/does-california-really-have-sixth-largest-economy-/
- Public Policy Institute of California. (2017). Undocumented immigrants in California. Public Policy Institute of California. Retrieved from http://www.ppic.org/main/publication_show.asp?i=818
- Sanchez, J. R., & Laanan, F. S. (1997). The economic returns of a community college education. Community College Review, 25, 78–87. doi:10.1177/009155219702500306
- Sanchez, J. R., & Laanan, F. S. (1998). Determining the economic benefits of attending community college. New Directions for Community Colleges, 104, 5–16. doi:10.1002/cc.10401
- Sanchez, J. R., Laanan, F. S., & Wiseley, W. C. (1999). Postcollege earnings of former students of California community colleges: Methods, analysis, and implications. Research in High Education, 40, 87–113. doi:10.1023/A:1018726428306
- Stevens, A. H., Kurlaender, M., & Grosz, M. (in press). Career technical education and labor market outcomes: Evidence from California community colleges. The Journal of Human Resources. doi:10.3368/jhr.54.4.1015.7449R2.
- Strong Workforce. (2017). Incentive funding: Strong workforce program. Retrieved from http://doingwhatmatters.cccco.edu/StrongWorkforce/SWPIncentiveFunding.aspx