Abstract
Real world examples of the reversal of the direction of an association when an additional explanatory variable is taken into account are unusual and hard to find. This article presents an example of Simpson's paradox from a South African longitudinal study of growth of children. The example demonstrates the importance race plays in every aspect of South African life.
Keywords:
1. Introduction
Simpson’s Paradox (CitationSimpson 1951) occurs when the direction of an association between two variables is reversed when a third variable is controlled. This topic is sometimes covered in introductory statistics courses. For example, the introductory texts by CitationMoore and McCabe (1998) and CitationWardrop (1995) include a section on this paradox. In addition, two recent papers provide examples of this reversal (Appleton, French, and CitationVanderpump 1996 and Westbrooke Citation1998). However, real world examples of the paradox are rare. This paper presents an example of Simpson’s Paradox that occurred in a South African longitudinal study of growth of children.
2. The Birth to Ten Study
The Birth to Ten study (BTT) (CitationYach et al. 1991, CitationLevitt et al. 1999) commenced in the greater Johannesburg/Soweto metropolitan area of South Africa during 1990. A birth cohort was formed from all singleton births during a seven-week period between April and June 1990 to women with permanent addresses within a defined area. Identification of children born during this seven-week period and living in the defined areas took place throughout the first year of the study, by the end of which 4029 births had been enrolled. The BTT study collected prenatal, birth, and early development information on these children. The aim of the study was to identify factors related to the emergence of cardiovascular disease risk factors in children living in an urban environment in South Africa. In 1995, when the children were five years old, the children and caregivers were invited to attend interviews. Detailed questionnaires were completed that included questions about living conditions within the child’s home, the child’s exposure to tobacco smoke, and additional health-related issues. The five-year sample consisted of 964 children. Unfortunately, there was a great deal of missing data in the baseline group, especially on the variables reported below.
If the five-year sample is to be used to draw conclusions about the entire birth cohort, the five-year group should have characteristics similar to those who were not traced from the initial group. Thus, the five-year group was compared to those who did not participate in the five-year interview on a number of factors. One of the factors was a variable that determined whether the mother had medical aid (which is similar to health insurance) at the time of the birth of the child.
3. The Paradox
shows that 11.1% of those in the five-year cohort had medical aid, whereas 16.6% of those who were not traced had medical aid. This difference is statistically significant (p-value = .007). The subjects in the BTT study are also classified by their racial group. In this article, we consider only white and black participants in the BTT study. shows the distribution of the medical aid variable broken down by the race of the participants. For white participants, 83.3% of those in the five-year follow-up cohort had medical aid, whereas 82.5% of those who did not participate in the five-year tests had medical aid. In the black group, the corresponding percentages are 8.9% and 8.7%. This shows that even though overall a smaller percentage of participants had medical aid in the five-year cohort, when the race of the subjects is taken into account, the association is reversed. However, there is no statistically significant difference between the percentages when race is taken into account (p-value = .945 and .891 for whites and blacks, respectively).
Table 1. Number (and Percentage) of Subjects Whose Mothers Had Medical Aid
Table 2. Number (and Percentage) of Subjects Whose Mothers Had Medical Aid by the Race of the Participants
4. Discussion
This reversal, or elimination, of association is easily explained. Whites tend to have much more access to
medical aid than do black South Africans. In addition, many more blacks were originally included in the Birth to Ten study than whites. Consequently, when the race groups are combined, a relatively small percentage of the subjects have access to medical aid. At the five-year follow-up, very few whites agreed to attend the screening exams (only 8.6% of those with data on the medical aid variable). Possibly the whites felt that they had little to gain from participating in the study, while a larger proportion of blacks (27.8% of those with data on the medical aid variable) continued into the five-year study. The blacks may have valued the medical checkup and screening provided to children in the study as a replacement for (or in addition to) a regular medical checkup.
5. Getting The Data
The file birthtotena.dat.txt contains the category labels and cell frequencies for the three-way table (). The file birthtotenb.dat.txt lists each case on a separate line with three variables that indicate whether or not the mother had medical aid, whether or not the mother was traced for the five-year interview, and race. The file birthtoten.txt is a documentation file containing a brief description of the datasets.
Acknowledgments
I thank the Birth to Ten Study and the Chronic Diseases of Lifestyle Programme at the Medical Research Council in Cape Town, South Africa, for the use of these data.
References
- Appleton, D. R., French, J. M., and Vanderpump, M. P. J. (1996), “Ignoring a Covariate: An Example of Simpson’s Paradox,” The American Statistician, 50, 340-341.
- Levitt, N. S., Steyn, K., De Wet, T., Morrell, C. H., Edwards, R., Ellison, G. T. H., and Cameron, N. (1999) “An Inverse Relationship Between Blood Pressure and Birth Weight Among 5 Year Old Children from Soweto, SouthAfrica,” Journal of Epidemiology and Community Health, 53, 264-268.
- Moore, D. S., and McCabe, G. P. (1998), Introduction to the Practice of Statistics (3rd ed.), New York: W. H. Freeman and Company.
- Simpson, E. H. (1951), “The Interpretation of Interaction in Contingency Tables,” Journal of the Royal Statistical Society, Ser. B, 13, 238-241.
- Wardrop, R. L. (1995), Statistics: Learning in the Presence of Variation, Dubuque, Iowa: Wm. C. Brown.
- Westbrooke, I. (1998), “Simpson’s Paradox: An Example in a New Zealand Survey of Jury Composition,” Chance, 11(2), 40-42.
- Yach, D., Cameron, N., Padayachee, N., Wagstaff, L., Richter, L., and Fonn, S. (1991), “Birth to Ten: Child Health in South Africa in the 1990s. Rationale and Methods of a Birth Cohort Study,” Paediatric and Perinatal Epidemiology, 5, 211-233.
Appendix
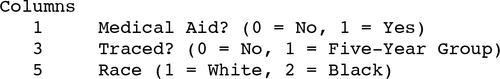
Key to Variables in birthtotena.dat.txt
Values are aligned and delimited by blanks. There are no missing values.
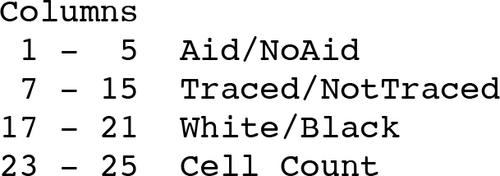
Key to Variables in birthtotenb.dat.txt
Values are aligned and delimited by blanks. There are no missing values.