
ABSTRACT
In this article we discuss our attempt to incorporate research-informed learning and teaching activities into a final year undergraduate Statistics course. We make use of the Shiny web-based application framework for R to develop “Shiny apps” designed to help facilitate student interaction with methods from recently published papers in the author's primary research field (extreme value theory and applications). We also replace some lectures with dedicated “reading group tutorials.” Here, students work in small groups to discuss and critique carefully selected papers from the field. They are also encouraged to use our Shiny apps to implement some of the methods discussed in the papers with their own data, for use in project work. We attempt to evaluate our innovation by comparing students' responses in open-ended data analysis work, and work requiring the interpretation of methods in a recently published paper, to those of students who took the same course two years earlier when our Shiny apps were not available and when research tutorials were not used. This comparison, along with results from a student questionnaire, gives us some confidence that our methods have benefited students, not only in terms of their ability to understand and implement advanced techniques from the recent literature but also in terms of their confidence and overall satisfaction with the course.
1. Introduction
In this article we discuss our efforts to implement research-informed learning and teaching in an undergraduate Statistics course on Environmental Extremes. We use innovative technology in the classroom to enable students to interact with cutting-edge statistical methodology. Specifically, we focus on the use of Shiny (Chang et al. Citation2015), a web-based application framework for R (R Core Team Citation2015), which makes it very easy to convert R scripts into user-friendly, interactive Shiny applications (“Shiny apps,” sometimes simply referred to as “apps” throughout this article). Our Shiny apps have been developed to promote students' interaction with advanced modeling techniques used for extreme value analyses. We make some attempt to evaluate the success of our Shiny apps and supporting classroom activities in enabling research-informed learning and teaching, and promoting students' appreciation of state-of-the-art statistical modeling techniques for extremes. For the remainder of this introduction, we discuss what is meant by research-informed learning and teaching and discuss recent innovative technologies that have been developed to enhance learning and teaching in Statistics. We then explain how we intend to enable research-informed learning and teaching in our course on extreme values through the development, and use, of such innovative technologies (specifically Shiny apps).
1.1. Research-Informed Learning and Teaching
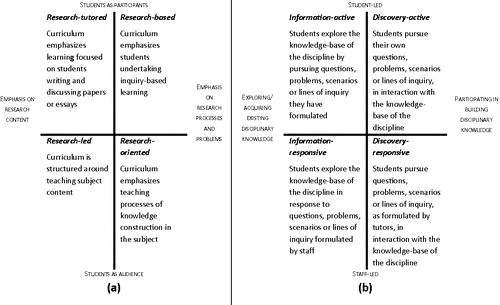
Across the disciplines, there exists an extensive pedagogic background to what is often termed “research-informed learning and teaching” (RILT), supporting numerous interpretations of the phrase. These interpretations range from the use of real-life examples in class to support theoretical developments to actively engaging students in the research process itself. The framework developed by Griffiths (Citation2004) and added to by Healey (Citation2005) categorizes research-informed teaching into teaching that is (1) research-led—in which students learn about research findings as a way of supporting the existing curriculum; (2) research-oriented—wherein students learn about the research process itself and the curriculum emphasizes as much the processes by which knowledge is produced as learning knowledge that has been achieved; (3) research-based—in which the curriculum is largely designed around inquiry-based activities and the division of roles between teacher and student is minimized; (4) research-tutored—in which students learn in small group discussions about research findings. Healey (Citation2005) expresses these differences diagrammatically () and Levy and Petrulis (Citation2007) present a variation on this matrix (), but both largely focus on axes pertaining to staff/student-led activities and information/discovery-led inquiry.
Figure 1. Interpretations of research-informed teaching: (a) Curriculum design/the research-teaching nexus, based on Healy (Citation2005) and (b) conceptions of student inquiry, based on Levy and Petrulis (Citation2007).
Several authors extol the virtues of case-based and inquiry-led activities as a way of improving student motivation and encouraging deep, rather than surface, learning; see, for example, Wassermann (Citation1994), Edwards et al. (Citation2001), Crosling and Web (Citation2002), and Herreid (Citation2007). Specific to undergraduate programs in Mathematics and Statistics, Daisley (Citation1979), Nolan and Speed (Citation1999), and Wild and Pfannkuch (Citation1999) argued the need for teaching statistical thinking rather than statistical recipes, again promoting the use of case-based, inquiry-led learning and teaching activities to support this. Indeed, the varied and often numerous collaborations between Statisticians and academics in other disciplines (and perhaps external organizations) can provide fertile picking-grounds for interesting, real-world problems that can be brought into the Statistics classroom. We believe it would be beneficial for more experienced students to interact with interesting problems that are genuinely research-based. This could bring students into contact with exciting, modern techniques and help promote the cutting-edge nature of the subject. In our experience, however, it is all too often the case that Statistics students—even toward the end of their degree—are confronted with textbook-style examples to work through in a standard lecture or tutorial setting. Usually, there is little exposure to real-life (possibly research-based) problems and suitable inquiry-led activities to support these problems. Although there have been some attempts reported in the literature to promote inquiry-based learning and teaching activities in Statistics (see above), as far as we are aware very little attention has been given to the use of genuine research-level material within these activities (and to the research-teaching nexus in Statistics generally).
1.2. Innovative Technology in the Statistics Classroom
1.2.1. Applets and Applet-Like Technology Tools
There are many examples of computer technology being used to enhance learning and teaching experiences related to fundamental concepts in Statistics, such as randomness, sampling, and variability; see, for example, delMas et al. (Citation1999), Chance and Rossman (Citation2006), Chance et al. (Citation2007), and Zieffler et al. (Citation2012). In particular, over the last 20 years or so there has been a rapid growth in the development of online applet or applet-type technology tools (software components that perform narrow functions, running within a web browser) to aid students' understanding of such concepts. These tools are usually highly interactive, visual, and dynamic. For example, the excellent collection of applets compiled by Allan Rossman and Beth Chance (www.rossmanchance.com/applets) cover the basics of data analysis, probability, sampling distributions, and statistical inference; in our experience, the “Reeses Pieces” applet (http://www.rossmanchance.com/applets/OneProp/OneProp.htm?candy = 1) has been extremely effective at demonstrating sampling variability of binomial proportions. In school outreach activities we have also discussed the famous Monty Hall dilemma, using the “Advanced Monty Hall” applet (http://www.shodor.org/interactivate/activities/AdvancedMontyHall/) to assist students' understanding of this apparent paradox. DePaolo (Citation2010) pulled together the applets described here, and more, into a single web-based interface called STAT-ATTIC (STATistics Applets for Teaching Topics in Introductory Courses; http://sapphire.indstate.edu/∼stat-attic/index.php); the applets available from this database have all been reviewed and are organized into 13 broad topics from which it is extremely easy to search for applets that perform particular functions. There are also many other freely downloadable software tools available to enable student exploration of particular concepts in Statistics, probably one of the most widely used and widely cited being SamplingSIM by Robert delMas (http://www.tc.umn.edu/∼delma001/stat_tools/software.htm). SamplingSIM focuses on students' understanding of sampling distributions of sample means and sample proportions. MERLOT/MERLOT II (www.merlot.org) and CAUSE (Consortium for the Advancement of Undergraduate Statistics Education; www.causeweb.org) also provide excellent technological resources for Statistics instructors, although both of these repositories contain lots of other instructional resources too.
1.2.2. More Immersive, Interactive Software
The work of Cliff Konold and Bill Finzer, and their resulting software packages FATHOM (Finzer Citation2006) and TinkerPlots (Konold and Miller Citation2015), have been used by many Statistics instructors to enhance traditional classroom teaching of basic Statistics (e.g., Everson and Garfield Citation2008; Watson and Donne Citation2009). FATHOM is marketed as “dynamic data software” that is designed to be fun, interactive and immersive. It is specifically designed for learning, and gives students the opportunity to change things (e.g., move points on a scatterplot) and see the effects of these changes (e.g., the estimated correlation coefficient and fitted regression line). Similarly, TinkerPlots is a data visualization and modeling tool developed to encourage users' interaction with their data. More recently, Konold and Finzer have developed online materials as part of their Data Games Project, resulting in a technology-based vehicle for integrating data science into the teaching of Mathematics using games; see Finzer (Citation2013) for full details, and Erickson (Citation2012) for a description of the challenges faced when teaching with such games. The data analysis software used in the Data Games Project is based on the FATHOM and TinkerPlots programs. The idea behind the Data Games Project is that students will play games repeatedly and generate data from these games; they will then look for patterns in these data, perhaps by producing graphical summaries, in order to improve their strategy and hopefully win the game!
Doi et al. (Citation2016) provided a review of the role of computer technology in Statistics education with a specific focus on the use of Shiny apps. They describe their collection of no fewer than 18 Shiny apps, developed mainly for the demonstration of basic ideas in Probability and Statistics and performing routine analyses. As with the software discussed above, a well-designed Shiny app can be extremely immersive. With its easy-to-use graphical user interface it can effectively “bring to life” existing R code, allowing users to interact with functions and control statements using sliders, radio buttons, and text entry boxes.
1.2.3. Benefits to Learning and Teaching Statistics
Various authors have reported on the improvements technology can bring to the Statistics classroom, including the applets and software discussed above. For example, Everson and Garfield (Citation2008) reported their use of technology in fostering collaborative learning among students, and in promoting an environment in which students learn from each other. Watson and Donne (Citation2009), with specific reference to TinkerPlots, commented on speed of analysis as a major advantage of using technology, with students being able to perform several different analyses with ease, observing (and learning from) the results. They also commented on the role of visual cues in an applet or software program in assisting students' understanding and hence decision-making. Chance et al. (Citation2007, p. 13) discussed that technology can promote students' “active construction of knowledge, by ‘doing' and ‘seeing' Statistics,” and that applets and software such as SamplingSIM provide many opportunities for students to reflect on observed phenomena. They also commented on the ability of students to probe deeply into large (and perhaps messy) datasets when using technology, the extra time required for such exploration coming from the elimination of hand calculations and other more algorithmic components of a course. This is supported by Rowell (Citation2004), who remarked that software tools can “…eliminate routine tasks, allowing more time for higher order thinking and learning.” Cobb and McClain (Citation2004) observed that students were more easily able to make and test conjectures when using such software tools and applets to analyze data. Wild and Pfannkuch (Citation1999) argued that the iterative exploration of data, as supported by the applets, software tools and games discussed above, mirrors statistical practice and helps develop a “habit of enquiry.” Studies such as those in Lane and Tang (Citation2000), Lunsford et al. (Citation2006), and Hagtvedt et al. (Citation2007) reveal that technological enhancement in Statistics courses can also improve student performance significantly. In terms of teaching Statistics, Doi et al. (Citation2016) commented on the benefit of Shiny apps in in-class demonstrations, as they can offer “… a much more fluid and dynamic presentation than one may typically experience by using the standard R console.”
1.3. Aims and Structure of This Article
The main aim of the project described here is to promote RILT in our final year undergraduate course in Environmental Extremes by allowing parts of this course to lean on Shiny apps (that have been developed precisely for this purpose). It is hoped that students will use these apps to implement techniques from recently published material in the Statistics literature in their own personal project work, without having to necessarily get embroiled in the complex mathematics underpinning the methods. We do hope, however, that students gain some appreciation for the underpinning theory via weekly reading group tutorial sessions set up specifically to support our objectives of RILT: in this particular course, we have replaced one of the weekly lectures with such a tutorial, in which students are required to participate in group discussions of certain chapters from the course texts and recently published papers. These texts and papers provide methodological details of the techniques available within the apps.
We attempt to evaluate the success of our efforts to implement RILT by comparing students' responses to project and examination questions in 2016, when our RILT activities (supported by the Shiny apps) took place, to those of students on 2014. For reference, the project question sheet can be found in the Appendix and consists of two parts: “Part A” requires an open-ended response to the student's own personal dataset, using appropriate techniques; “Part B” requires discussion, and critique, of a recently-published paper. Although we do comment on changes in the grades of students between 2014 and 2016, we do not read too much into these changes. These assessments are unique to our course on Environmental Extremes, at our University, and it would be difficult to generalize any findings or make the results applicable to others. Rather, we provide a more descriptive comparison between the two groups—for example, focusing on differences between the methods used by the two groups of students to analyze their personal datasets in Part A of the project, or differences in their reasoning in response to questions in Part B. We provide overall summaries of results obtained from a questionnaire given to both groups of students, as well as responses from students in the 2016 cohort to questions asking specifically about the Shiny apps and reading group tutorials.
The rest of this article is structured as follows. In Section 2 we describe the course in which we focus our RILT activities, explaining why we think such activities are particularly appropriate here. In Section 3 we describe in detail the development of our RILT activities and how these were woven into the overall delivery of the course. We also give details about the material covered in the Shiny apps and describe how the apps were used. In Section 4 we attempt to evaluate our methods. In Section 5 we provide some general conclusions and recommendations.
2. Research-Informed Learning and Teaching: Target Course
The course for which we have developed Shiny apps to assist our efforts to promote RILT is a 12-week module in Environmental Extremes—the author's main research area. The syllabus includes (i) practical motivation for studying extremes, (ii) classical models for extremes, (iii) dependent extremes, (iv) nonstationary extremes, (v) multivariate extremes, and (vi) recent developments. Part (vi) is intended to expose students to cutting-edge methods in parts (ii)–(v). For example, toward the end of part (iii), we consider developments in the recent literature, looking specifically at optimal estimation strategies for sea-surge and wind speed extremes in the presence of short-term serial correlation. In part (v) we consider recent advances in multivariate extremes and their applications to the spatial modeling of areal rainfall processes. Following a description of standard likelihood methods for making inferences, advances in Bayesian modeling of extremes are promoted throughout via references to the recent literature and the use of case studies showcasing the benefits of a Bayesian analysis of extremes.
The module is only available to students in the fourth and final year of their undergraduate integrated Masters program in Mathematics or Mathematics & Statistics (MMath or MMathStat, respectively) at Newcastle University (UK), although first year PhD students often “sit in” too. One of the aims of courses at this level at Newcastle is to introduce students to the research areas of members of staff. Thus, we believe RILT is apt for such courses, especially given that a number of these students usually go on to further study (including postgraduate research). An informal survey of other Statistics courses at this level at Newcastle, and similar courses at other universities, revealed that RILT activities were seldom used. Where we found attempts had been made to bring research into the classroom, with reference to it was largely staff-led in a lecture setting with passive student involvement. Here, we would like to move some way toward our activities being student-led.
To date, the module has been offered twice: February–June 2014 and February–June 2016. In 2016 there were 20 students (12 female and 8 male) registered on this course. In 2014, there were 23 students (12 female and 11 male). Both times, as is standard for such 12-week Mathematics/Statistics courses at Newcastle, students were allocated two hours of staff contact time per week. In most weeks in 2014, both hours were used for standard lectures; occasionally, a lecture would be replaced with “tutorial time” in which students could work on their assignments or project work and ask for help or general guidance with their studies. Although case studies demonstrating recent advances in the field were used in lectures in 2014, students were not actively encouraged to interact with this research, for example, as part of their assessment. Rather, after each case study, students were provided with references and the onus was entirely upon the student to follow these up and attempt to implement associated techniques in their project work. In 2016, however, one of the weekly lectures was routinely replaced with a structured “reading group tutorial” in which students took part in directed and supervised discussions related to the case studies used in lectures. Further, students were provided with hard copies of related papers and were encouraged to consider how the methods used in these papers have had a practical impact on the implementation of extreme value theory. To this end, support was provided through appropriate guidance being offered by the author and postgraduate assistants, but also through the Shiny apps (see Sections 3.1.2–3.1.3), which most students used on their own personal laptops, tablets, or mobile devices during the tutorials.
A final written examination accounts for 60% of the module's assessment. A mid-term class test accounts for 20% of the overall assessment, leaving a further 20% for the individual “research project.” Although both the formal examination and class tests are based mainly on the fundamentals of extreme value theory and modeling, students are told that some questions will require more descriptive solutions and an awareness of (and appreciation for) recent developments in the field. The individual project, however, is where students can put into practice their knowledge of recent research activity in extremes, with an open-ended report in response to a unique personal dataset (Part A) and a structured discussion/critique of a recently published paper in the field (Part B). In Part A of the project, students can obtain full marks for a thorough and convincing use of standard techniques from the lecture notes, although in both 2014 and 2016 students were told they should consider implementing some ideas from the recent literature. Part B of the project actually requires some interaction with the literature, with specific questions being set on a paper (all students answered questions on the same paper here, although methods in several papers were explored in the reading group tutorials).
3. Development and Implementation of RILT Activities
3.1. Development of Shiny Applications
In this section, we point to some online resources we have used to help develop our Shiny apps (Section 3.1.1). We give a brief overview of the topics we have covered in our apps (Sections 3.1.2–3.1.3). We then give details of how interested readers can experiment with our apps themselves (Section 3.1.4). Should the reader wish to focus solely on the implementation of these apps in our target course and an evaluation of their success, they can move directly to Section 3.2 and then to Section 4.
3.1.1. Resources
The Shiny webpage (http://shiny.rstudio.com/) has a gallery of examples demonstrating the various features available in a Shiny app, including interactive graphics and visualization, input/output widgets, and dynamic user interfaces. Also available is the “Shiny User Showcase,” showing examples of industry-specific Shiny apps. These include a “User-friendly portal to New Zealand tourism data,” a “Genome browser” and an “Ebola model.” The Shiny webpage also includes video tutorials and “lesson” written tutorials. There are many other online resources for building Shiny apps, including video tutorials on YouTube and the “Show Me Shiny” webpage (http://www.showmeshiny.com/). In short, it is not an arduous task to convert existing R scripts into Shiny apps, and we encourage readers to use the various online resources to build their own apps. We feel there is a place for such apps not only in Statistics learning and teaching, but also to create opportunities for practitioners to easily interact with cutting-edge Statistics research. Indeed, it is our intention to develop Shiny apps for hydrologists and engineers who could benefit from best practices linked to current research in extreme value theory.
3.1.2. Our Shiny Apps: Basic Features
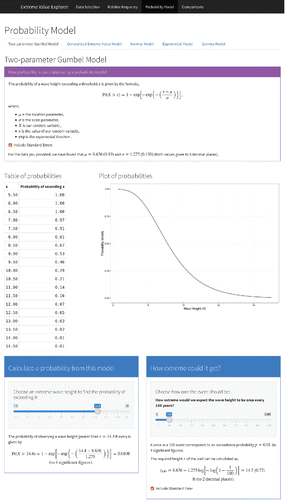
Currently, we have two apps for extreme value analyses that our students used in the target course. The first allows the user to perform classical analyses of block maxima data. Typically, practitioners would use such methods with annual maximum observations on variables such as rainfall, wind speed, or sea-surge. Such analyses are typically aimed at providing an estimate of the level we can expect to be exceeded, on average, once every r years. A practical use of such r-year return level estimates is in the design of buildings and structures. For example, in the United Kingdom, estimates of the 50-year return level for wind speeds are used to inform design codes for the strength of new structures, these structures being required to withstand such a wind speed. Similarly, analyses of annual maximum sea-surges are used to inform the design of flood defenses such as sea walls. In the Netherlands, coastal flood defenses are built high enough to withstand the anticipated 10,000-year sea-surge event. The Shiny app allows the user to upload their own datafile, in a variety of formats (e.g., plain text files, comma-separated values files, etc.). The uploaded file can consist of the annual maxima themselves, or the complete time series of observations—after the user has specified the number of observations per year, the start/end date and the size of their “block” (e.g., months, years, etc.), the app will extract the set of block maxima and then take this set forward into the analysis. By default, the app fits the generalized extreme value (GEV) distribution to the set of block maxima and displays the maximum likelihood estimates, with standard errors, of the model parameters. The user can, however, over-ride this default and choose from a list of other commonly-used models. The user can also then select their return period of interest, r, using a slider bar. The app will then invert the fitted GEV distribution function (or the distribution function for the selected model) to obtain the estimated r-year return level, using the associated fitted GEV quantile (with its standard error obtained via the delta method). Basic model goodness-of-fit can be checked via probability and quantile plots. The reader is referred to Chapter 3 of Coles (Citation2001) for a detailed coverage of these classical methods for analyzing extremes. and show screenshots from the block maxima app. Notice the option to analyze various “built-in” datasets (in we have selected a set of wave height annual maxima) allowing the user to explore the functionality of the app without needing to have their own data. After the data upload step, various graphical and numerical summaries are displayed before the main analysis. shows the main results page for the standard frequentist (maximum likelihood) analysis, illustrating the output for a fitted model and the slider bars to obtain model-based probabilities and estimated return levels.
Figure 2. Screenshot taken from the block maxima analysis app, showing the default exploratory analysis for the uploaded dataset.
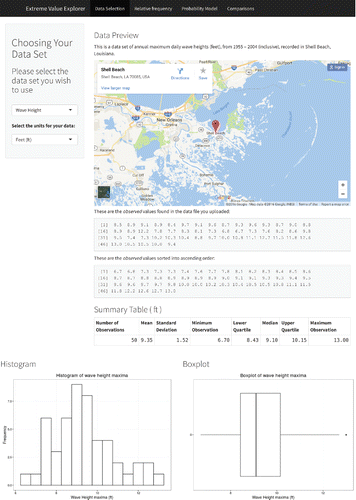
Figure 3. Screenshot taken from the block maxima app, showing inference for a fitted model (including return level inference).
The second Shiny app (not shown here) allows the user to perform a threshold-based analysis of their extremes. Again, the aim of such an analysis is usually the estimation of return levels. However, observations are now classified as extreme if they overtop some high threshold. Given the tendency for the extremes of environmental variables to cluster, within the app the user has the option to de-cluster, that is, use a filtering scheme to identify a subset of independent threshold exceedances. Analysis then proceeds by fitting the generalized Pareto distribution (GPD) to the set of filtered threshold excesses, with estimates of return levels being obtained in exactly the same way as before. Indeed, the app follows that of the block maxima app, displaying probability and quantile plots to allow the user to assess the goodness-of-fit of the GPD; like the block maxima app, a variety of different data file types can also be handled. The reader is referred to Chapters 4 and 5 of Coles (Citation2001) for a detailed background of threshold methods.
3.1.3. Our Shiny Apps: More Cutting-Edge Features
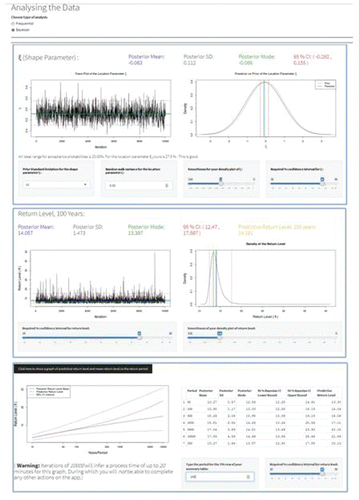
There are various other features of the apps described in Section 3.1.2 that enable the user to interact with more recent research developments. For example, Coles and Tawn (Citation1996), Coles et al. (Citation2003), Sisson et al. (Citation2006), Fawcett and Walshaw (Citation2006a, Citation2006b), Eugenia Castellanos and Cabras (Citation2007), Sang and Gelfand (Citation2009), Davison et al. (Citation2012), and Fawcett and Walshaw (Citation2016) advocate Bayesian methods for making inferences on extremes. In particular, the posterior predictive return level estimate has been cited as perhaps the best single number summary of a return level estimate for practitioners, incorporating uncertainty in parameter estimation and randomness in future observations. The ability to augment an extreme value analysis, in which data are often scarce, with external information via the prior distribution, also has obvious appeal. Thus, in both the block maxima and threshold apps for extreme value analyses the user can toggle between “Frequentist” and “Bayesian” inferential frameworks. Within the Bayesian setting, users have the ability to specify the hyperparameters from prior distributions for the GEV/GPD model parameters, which can be chosen from a drop-down menu. The user also has some control over the Markov chain Monte Carlo (MCMC) options, including the number of iterations and the size of the variance of the random walk innovations used (after running the MCMC, the app informs the user if the acceptance probabilities are too large or too small and makes suggestions about how to appropriately adjust the random walk innovation variances). Inference for return levels is displayed based on the chains for the GEV/GPD parameters and, in line with suggestions of best practice in Fawcett and Walshaw (Citation2016), posterior predictive return levels are reported. Thus, the app allows users to perform Bayesian analyses without having to worry unduly about the intricacies of MCMC and the mathematics required to obtain posterior predictive return levels. shows screenshots from our Shiny app deploying a Bayesian analysis of the wave height data illustrated in and , with MCMC output for the shape parameter in the GEV, the 100-year return level wave height and predictive inference for return levels.
Figure 4. Screenshots from the block maxima app showing some results of a Bayesian analysis, including predictive inference for return levels.
In the threshold app, should significant autocorrelation be detected in the extremes, the user is advised to either de-cluster, as discussed earlier, or adjust inferences based on using all extremes by using the extremal index. The details of this approach are omitted here. In short, as proposed in Fawcett and Walshaw (Citation2016), an inferential framework pressing all threshold excesses into use is deployed, properly acknowledging dependence through the extremal index and thus lending greater precision to the analysis owing to the inclusion of more data (as opposed to using just a filtered subset of independent threshold excesses). Fawcett and Walshaw (Citation2016) also argued that the de-clustering process, although in practice the most commonly used approach for dealing with dependence, can result in estimation bias and in particular under-estimation of return levels. The app allows users to conduct the “best practice” analyses as proposed in Fawcett and Walshaw (Citation2016) without having to worry about the difficulties surrounding (for example) extremal index estimation and the methods required to obtain standard errors and confidence intervals for return levels (here, a block-bootstrap resampling scheme is required within the frequentist framework; see Fawcett and Walshaw Citation2016). This is particularly useful for the course in which we are attempting to promote RILT in extreme value analyses, since such methods are beyond the scope of the course and are used here to simply facilitate best practice. The app also allows students to implement such analyses within the Bayesian setting, again giving the user different options for prior specification for the GPD parameters.
3.1.4. Accessing the Apps
Some of our apps can be accessed by anyone who wants to try them via a dedicated webpage: http://www.mas.ncl.ac.uk/∼nlf8/innovation2/. A University sever is used to host the apps, and students on the target course were provided with login credentials for this server to access all of the apps we have developed. At the start of the course in 2016 the apps were demonstrated to students in lectures and students were then encouraged to experiment with them in their own time and in the reading group tutorials. Currently, external organizations are interested in using our apps for extreme value analyses, including EDF Energy. Thus, we believe the apps will also help to foster productive collaborations with industry and convert methodological research into translational research, where state-of-the art methods are made accessible to practitioners. Interested readers are encouraged to experiment with the apps we have made freely available, and any comments/feedback are very welcome (at times the apps might experience “down time” while we update and refine). For access to the full suite of apps, readers should contact the author for login details for our Shiny server.
3.2. Implementation of the Shiny Applications
In dedicated “case study lectures” students were introduced to some recent research activity in extremes. They were given a supporting handout summarizing the aims, methods, and results of a recent paper. Such lectures were used in both 2014 and 2016. In 2016, however, some of the methods presented were then also implemented live within the Shiny apps. In particular, one case study lecture focused on the benefits of the extremal index approach (see Section 3.1.3) relative to a standard threshold-based approach using a filtered set of independent threshold exceedances, as described in the Fawcett and Walshaw (Citation2016) paper. Through such live demonstrations in class it was made clear to the students just how user-friendly the apps were, and how they might use them themselves to integrate recent research into their project work.
The apps were also used to demonstrate some of the more routine aspects of the course, including maximum likelihood estimation in a standard block maxima analysis. In a bid to make our RILT more student-led, in 2016 one of the two lectures, scheduled to take place every week, was replaced with a reading group tutorial session. These sessions gave students the opportunity to experiment with our Shiny apps under the supervision of a member of staff, should they need guidance. In the first three weeks of the course, data response-type examples that would have been covered in lectures were now reserved for the tutorials. Students were encouraged to work through these themselves, in small groups of around 4/5 students, using the Shiny apps to assist with the analysis where appropriate. Gradually, as students became more confident with the course material, they were advised to work through some of the lecture material privately, on their own time, and the tutorial sessions were then devoted to group discussions of recent papers. Roughly one week before the tutorial session, students were given hard copies of a paper referred to in a recent case study lecture, and they were advised to read through the paper before the tutorial. In the associated tutorial session, students were asked to discuss the main aims, methods, and results of the paper. The datasets from the paper were made available to the students who were encouraged to use the Shiny apps to implement the methods and reproduce the results in the paper. It was hoped that the apps would make the methods in the papers accessible to students, and would help their understanding of the advanced techniques being used. The author and postgraduate assistants would, at times, join the small group discussions. However, only vague guidance was offered and students were encouraged to learn from each other. The papers used in these (nonassessed) sessions were those whose methods could easily be demonstrated within our Shiny apps. In Part B of the project, all students worked on the same paper.
In some of the tutorial sessions toward the end of the course, students were encouraged to work on their projects. In particular, they were told to think about how the methods in the research papers they had studied recently could inform their own analyses. Again, students were strongly encouraged to use the Shiny apps to facilitate this process and, above all, to share their ideas with each other. Toward the end of term the author's collaborator from EDF Energy attended one of the tutorials and described how software applications, such as our Shiny apps, could go some way to help practitioners interact with cutting edge research in Statistics. Indeed, the representative from EDF Energy explained how such apps could enable practitioners to interact more quickly with new research, speeding up the potential impact of this research. This session provided students with a useful insight into the research process itself, and the mechanics behind the collaboration between Statisticians and industry. Some of the material in part (v) of the module (“Multivariate extremes”), covered in the final few weeks of the course in 2014, was removed in 2016 to allow time for these RILT activities in class.
4. Evaluation
We attempt to evaluate our efforts to incorporate RILT activities in the target course in various ways. In 2014 the Shiny apps were not available and we did not have designated reading group tutorials. Students were, however, still exposed to methods from the recent literature in the case study lectures and were encouraged to consider some of these methods in Part A (the open-ended data response part) of their personal projects (and were offered help/support to do so). Part B of this project required students to read through a recently-published paper and answer questions on the aims, methods, and results in that paper. Again, staff time was made available for students to seek help for this part of the project. In 2016, exactly the same project was used, the difference now being that students could use our Shiny apps to perform their analyses and engage with methods from recently-published work. Also, RILT activities were properly supported by our reading group tutorial sessions. Thus, between students in 2014 and 2016, we:
| • | Compare responses to questions in Part A of the personal projects. | ||||
| • | Compare responses to questions in Part B of the personal projects. | ||||
| • | Compare responses to examination questions; in particular, responses to questions requiring knowledge of the recent literature (a very similar examination paper was used with both cohorts, the 2014 examination paper not being made available to students taking the course in 2016). | ||||
Students in both the 2014 and 2016 cohorts completed a questionnaire asking them about their level of confidence with the advanced techniques covered in the course. Students were also asked to rate their enthusiasm for the course and overall level of satisfaction with the course and were given the opportunity to provide any other open-ended comments. In 2016, students were specifically asked to comment on the usefulness of the Shiny apps and the reading group tutorial sessions. Thus:
| • | Where appropriate, we compare student questionnaire responses in 2014 to those in 2016. | ||||
| • | We consider student feedback on the Shiny apps and reading group tutorials in 2016. | ||||
Although we could formally compare actual project/examination grades, and questionnaire feedback, between the two cohorts, these assessments are unique to our course on Environmental Extremes, at our University; as Zieffler et al. (Citation2008, p. 13) discussed, this makes generalizing any findings, or making these findings applicable to others, extremely difficult:
“Another consideration … is that studies typically use course-specific student outcomes, such as final exam grades or course evaluations, as a dependent measure. Because of the singular dependence of these outcomes to a particular course, many of the research results from these studies lack any desirable external validity”
We have included the project in the Appendix to this article so where we do make such comparisons the reader can at least get a feel for the intended learning outcomes of our course. However, we give more emphasis to descriptive, rather than inferential, findings from our comparisons between the two cohorts. We also occasionally make descriptive comparisons between male and female students. Although studies have shown that any gender differences in Mathematics ability at undergraduate level are likely to be perceived, rather than real (e.g., Feingold Citation1988; Cherian and Siweya Citation1996; Payne Citation2015), as Payne (Citation2015) discusses there may be noticeable differences when it comes to responses to failure and stereotypes.
4.1. Students' Responses to Project Questions
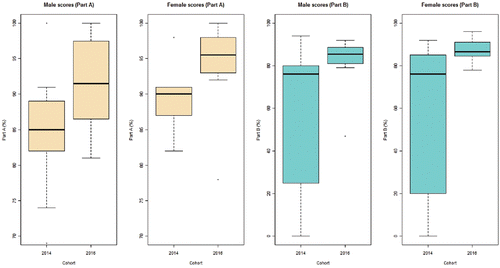
shows project grades (for Parts A and B separately) for students in 2014 and students in 2016. Regardless of gender, it appears from the plots that students' grades in 2016, in both parts of the project, are generally higher than those of students in 2014. The average grades for both males and females is higher in 2016 than 2014 for both parts of the project and, for Part B in particular, the overall spread of grades decreases in 2016. This reduction in variation from 2014 to 2016, especially for Part B of the project, could also be indicative of the success of our RILT activities, with a much tighter concentration of students around a higher average mark. The greater variation of marks observed in 2014 is not helped by the fact that several students did not attempt Part B at all, hence receiving zero marks here. The fact that all students in 2016 attempted Part B could be an indication of students' increased confidence owing to our RILT efforts (see Section 4.3). It became apparent that a handful of students in both 2014 and 2016 were enrolled on another module (taking place before our target module) in which some attempt had been made to implement RILT activities. Although results are not shown here, student grades for Part A of the project (but not Part B) were higher (on average) for those students who had had previous RILT exposure. These findings are consistent with the hypothesis of our RILT activities having had a positive impact on students' ability to interact with research in their studies (and perhaps their performance in assessments). These findings are also consistent with observed improvements in student grades, as a result of technological innovations, as reported in Lane and Tang (Citation2000), Lunsford et al. (Citation2006), and Hagtvedt et al. (Citation2007). However, as discussed earlier any attempts to generalize these findings should be approached with caution as this project work is both course- and institution-specific.
Figure 5. Boxplots showing student grades (out of 100) for Part A and Part B of the personal project, separated by gender. In 2014 there were 12 female students and 11 male students; in 2016 there were 12 female students and 8 male students.
Recall that, in Part A of the project, it was not essential for students to use new methods. Students could achieve full marks for a thorough analysis making use of the standard techniques from the lecture notes. Indeed, not all students in 2016 used methods from recent research papers in their analyses. However, it was apparent that even these students—who had had at least some exposure to our RILT activities—had a better understanding of the basic methods. Generally, they could produce more convincing project work. This observation supports those made in several other studies (e.g., delMas et al. Citation1999; Chance and Rossman Citation2006; Chance et al. Citation2007; Zieffler et al. Citation2012) in which technology in the Statistics classroom is seen as a vehicle for enhancing students' understanding of fundamental concepts. Indeed, the use of technology to reinforce essential concepts has been promoted in the Guidelines for Assessment and Instruction in Statistics Education (GAISE; Franklin and Garfield Citation2006). We also found that, in 2016, even those students who did not implement cutting-edge methods in Part A of their project seemed to have a better grasp of the aims, methods, and results of the paper being studied in Part B.
In 2014, only 27% of students made any attempt to use methods from the recent literature in Part A of their project. In contrast, 75% of students in 2016 attempted to use cutting-edge techniques in their data analyses. Given the Shiny apps available to students this might have been expected. Students who had access to our Shiny apps in 2016 could readily, and with speed, perform sophisticated analyses. Students in 2014 would have been required to download and install external packages in R or write code themselves, making recently published methods less accessible and much slower to implement. Indeed, Rowell (Citation2004) and Watson and Donne (Citation2009) comment on accessibility and speed of analysis as a major advantage of using innovative technology in the Statistics classroom (see Section 1.2.3 of this article). We were surprised, however, by how many students in 2016 could write about their analyses convincingly, seemingly having a good grasp of the methods being used and not just using the apps like a “black box.” We deliberately kept the design of the Shiny apps simple and without fancy features—as Chance et al. (Citation2007) remarked, the focus of any innovative technology within the Statistics classroom should be on the statistical concept rather than the technology itself—and so perhaps students were not too distracted from the underpinning methodology. Certainly, although we observed students trying out many different analyses using our Shiny apps, we noticed that no student submitted reams of output in their reports, with most reports being concisely written with supporting analyses. This is in contrast to comments made in Chance et al. (Citation2007) pertaining to students becoming too focused on numerical calculations and using technology to produce large amounts of output, and could indicate that students really were in tune with the methods behind our apps. Many students in 2014 who did make use of research-level methods in their analyses, used add-on R packages to do so, although we were impressed by a few students who were able to write their own R code to implement such methods. However, the written reports for these students were less convincing than those of students in the 2016 cohort. Perhaps this is to be expected, given the reading group tutorials used in 2016.
Pleasingly, three students in 2016 were clearly using our Shiny apps to make and test conjectures in their projects, as supported by discussions in Cobb and McClain (Citation2004) (see Section 1.2.3 of this article). For example, one student performed both frequentist and Bayesian analyses (with informative priors) to investigate the effects on posterior standard deviations relative to frequentist standard errors.
4.2. Students' Responses to Examination Questions
We were concerned that the replacement of one of the weekly lectures with a reading group tutorial, in which no formal/standard teaching took place, might have had a negative impact on students' ability with more standard parts of the course. For example, material demonstrating the use of maximum likelihood methods to make inferences on the extreme value models was not taught in lectures in 2016 as it had been in 2014, to help free up some time for the reading group tutorial sessions. Instead, students were told to cover this basic material in their own time through private reading of the lecture notes (and these students had, after all, used likelihood techniques in several other courses over the years). Students' grades in the end of year examination questions that mainly covered standard techniques from the lecture notes, were shown not to suffer, with grades in 2016 not being significantly different to those from 2014. This supports the case made in Chance et al. (Citation2007) for replacing class time for algorithmic, routine calculations with time for exploration of deeper concepts and using technology to probe large, real datasets, and that this can be to the benefit of more meaningful understanding by the students. Interestingly, in both the 2014 and 2016 examinations there were two sub-questions asking students to support their answers to previous questions by referring to the recent literature. There seemed to be no real differences between students' grades in 2014 and 2016 for these questions. It was noticeable, however, that students in 2016 could support their discussions here with more examples from the supporting literature (although no extra marks were awarded for doing so).
4.3. Questionnaire Comparisons
Toward the end of the course, students in both the 2014 and 2016 cohorts were asked to complete a questionnaire. Among other things, included in this questionnaire were the following questions:
On a scale of 1–10:
How difficult did you find the course (10 being most difficult)? | |||||
| • | Rate your level of confidence in understanding some techniques from the recent literature (10 being most confident). | ||||
| • | Rate your level of confidence in being able to use some techniques from the recent literature (10 being most confident). | ||||
| • | Rate your level of enthusiasm for the course (10 being most enthusiastic). | ||||
| • | How satisfied are you, overall, with this course (10 being most satisfied)? | ||||
In addition, in 2016 the following questions were included:
| bullet• | On a scale of 1–10, how useful did you find the reading group tutorials (10 being most useful)? | ||||||||||||||||||||||
| bullet• | Did you use the Shiny apps in your own work? (Yes/No) | ||||||||||||||||||||||
| bullet• | If you did use the Shiny apps:
| ||||||||||||||||||||||
In both cohorts, the majority of students completed the questionnaire (91% and 95% completion rates in 2014 and 2016, respectively). Some results and comparisons between 2014 and 2016, are shown in , with numerical summaries in . Interestingly, the results show that there is hardly any change in students' perception of how difficult the course is. Generally in 2016 all students found the reading group tutorials and the Shiny apps helpful, with no scores for usefulness and helpfulness below 7 out of 10. The most noticeable comparison between the 2014 and 2016 cohorts is perhaps to be expected: students in 2016 generally felt more confident in their understanding, and in their ability to implement, advanced techniques from the literature (“Confidence 1” and “Confidence 2” in , respectively). This is supported by many general open-ended text comments made by students (e.g., “Without Shiny I wouldn't have been confident enough to try non-lecture stuff in my project,” and “…being able to play about with stuff in the apps made me more confident with the more basic parts of the module”).
Figure 6. Top-left to bottom-right: Percentage of students giving different scores out of 10 for (i) difficulty of the course (10 most difficult); (ii) level of confidence in understanding advanced techniques (10 most confident); (iii) level of confidence in implementing advanced techniques (10 most confident); (iv) enthusiasm for the course (10 most enthusiastic); (v) overall satisfaction (10 most satisfied); (vi) usefulness of the reading group tutorials (10 most useful); (vii) helpfulness of the Shiny apps in assisting understanding of basic course material (10 most helpful); and (viii) helpfulness of Shiny apps in assisting understanding of advanced techniques (10 most helpful).
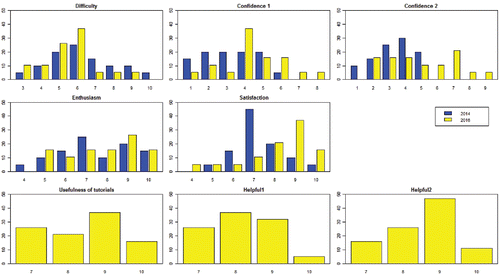
Table 1. Average student scores for perceived course difficulty; level of confidence in understanding (“Confidence 1”) and implementing (“Confidence 2”) advanced techniques; enthusiasm; overall satisfaction; usefulness of the tutorials; and helpfulness of the apps in assisting understanding of basic course material (“Helpful 1”) and advanced techniques (“Helpful 2”).
In other open-ended text comments, many students commented on the usefulness of the Shiny apps in terms of being able to “test things out easily” and being able to “learn by doing.” Such comments are supported by findings in the literature; for example remarks in Wild and Pfannkuch (Citation1999) about the iterative exploration of data, and the comments made in Chance et al. (Citation2007) about the use of technology to promote hands-on, immersive learning (see Section 1.2.3 of this article). The open-ended comments also revealed that students in the 2016 cohort appreciated the opportunity to work together with the Shiny apps in the reading group tutorials, learning from each other with the apps. Again, such comments are supported in the literature (the reader should again refer back to Section 1.2.3 of this article and our reference to Everson and Garfield Citation2008). Generally, students were happy that space in the timetable had been made for these tutorials by confining some of the more routine methods and demonstrations to the lecture notes and/or course texts. Some students commented positively on the use of our apps for demonstration purposes, which helped to make some lectures more interesting, fun and easier to follow; comments supported by findings in Doi et al. (Citation2016). Some students commented that some of the methods were “brought to life” by the in-class Shiny demonstrations, and how “excited” and “enthusiastic” the instructors were during these demonstrations! Of course, there were also some negative comments. These were usually about the length of time taken to run some of the MCMC simulations and the apparent instability of some of the features of the app that performs Bayesian inference for extremes. However, contrary to some of the discussion we make in Section 4.1, one student found the apps made the application of some techniques too automatic, and they thought that writing their own code to perform the same functions would have been better for their learning and understanding (of course, students could have done this anyway if they had really wanted to!).
5. Conclusions
5.1. General Remarks
We believe that technology can play a crucial role in helping to implement RILT activities in Statistics courses. We think there is some evidence to suggest that our Shiny applications have encouraged students' interaction with recently published methods in extreme value theory. We found that students who had access to our Shiny apps were much more likely to use methods from the recent literature in their own personal project work and could discuss (and critique) a recently published paper much more convincingly. The reading group tutorials, supported by our Shiny apps, seemed to foster a sense of collaborative learning and collective inquiry, confirmed both by our observations when supervising these sessions and students' comments in the questionnaire feedback. It was apparent that some students were making and testing conjectures using our Shiny apps, which we think may not have happened if the apps were not available. We also observed an increase in student grades in the project work between 2014 and 2016.
The Shiny applications made it much easier for us to implement RILT activities, facilitating students' interaction with advanced techniques without them having to get embroiled in the technicalities of other supporting methods (e.g., block-bootstrapping or Markov chain Monte Carlo). We thought it was equally important for students not to have to get bogged down by complicated coding. We found the use of dedicated reading group tutorial sessions, in place of standard lectures, also helped to facilitate our aims of incorporating RILT activities into the course. Students seemed to find it particularly beneficial to make use of our Shiny applications within these sessions. Group discussions of recent advances in the field, supported by specially selected papers discussed in lectures, enhanced the learning process still further. With reference to , the Shiny apps, supported by the reading group tutorials, helped us move some way to “Students as Participants” with the learning and teaching processes being more “Student led.” To involve undergraduate students directly with the research process itself might be difficult, although some students appreciated how the Shiny apps could help to facilitate inter-disciplinary collaborations.
Of course, there is the concern that using such user-friendly web-based applications can make the implementation process too much like a “black box,” without the user having to understand the methods properly and thus perhaps not fully understanding the output. In the case of the Shiny apps we have developed, we would argue that having to fully understand all of the techniques being implemented would provide too much distraction. Most of our students have at least some background knowledge of some of the techniques we are automating (e.g., bootstrapping, MCMC) and where they do not, the techniques are fully described in the supporting papers. However, we focus mainly on the advantages of the practical applications of these new techniques and not the theoretical development of the methods. To this end, we are content with the functionality of the apps.
There is some work to be done to develop the Shiny apps still further. One of our aims is to make the apps available to practitioners with an interest in extreme value methods (e.g., hydrologists), although this will probably require the development of detailed support material (e.g., user guides). We also aim to make use of similar apps to facilitate RILT activities in other courses, as well as to support the learning and teaching of more basic concepts in Statistics as discussed by Doi et al. (Citation2016). We invite interested readers to visit our webpage and try out some of the apps we have developed (http://www.mas.ncl.ac.uk/∼nlf8/innovation2/). All feedback is extremely appreciated. Full access to all of our apps, via the provision of login credentials to our Shiny server, can be granted by contacting the author.
5.2. Implications for Teaching
We would recommend any readers who have an interest in RILT to support their classroom activities with appropriate technology. In our experience, bringing research-level problems into the classroom can be a rewarding experience for both students and instructors, provided these problems are adequately supported. Replacing standard lectures covering more routine, algorithmic components of a course with interactive, hands-on tutorial sessions is an easy way to make space for RILT activities, and in our case this was appreciated by studentsFootnote1 . We found that the use of our Shiny apps within these reading group tutorials really brought the material they were reading to life. Students were able to try out, in real time, some of the techniques they were reading about. Not only did this allow them to interact directly with the research in the paper they were reading, but they knew they would be rewarded for their efforts as they would gain credit for applying these methods to their own datasets in their personal projects. We believe our Shiny apps made it much more likely for students to run cutting-edge analyses on their own data, but—more importantly—show their results to fellow students and engage in discussions about the work with their peers. This collaborative learning environment we observed unfold was not wholly expected, but for us was one of the most rewarding consequences of our RILT activities. We have attempted to bring research-level problems into the classroom before, without the support of appropriate technology, and the experience was much less positive and rewarding for all concerned.
We have discussed how RILT should be properly supported (e.g., with dedicated activities and technology). It is important, however, to let students take the lead in sessions aimed at promoting RILT. At first, we found it rather difficult to stand back and let students find their own paths. Over time, we realized it was important for the reading group tutorials to relax into more learner-centered sessions, and for us to accept our role as facilitators rather than lecturers here. It is also important to provide adequate staff support in such sessions. There were times during our reading group tutorials when students were working very quietly, reading through papers and trying out methods with our Shiny apps. In every session, however, there were also extremely busy times, as the work promoted discussion and, inevitably, questions. Sometimes these questions were of a technical nature about the apps themselves, and so all staff were required to be proficient in using the apps.
We found it extremely beneficial to demonstrate use of the Shiny apps, both in lectures and the reading group tutorials. Students responded positively to this, as shown by their feedback in the questionnaires. Students seemed more engaged in lectures when we demonstrated techniques via the apps (and we think they would have been much less engaged had we used a basic R console, or even RStudio, instead), and they told us they were happier using the apps themselves in tutorials following such demonstrations. We often notice a distinct lack of confidence in some undergraduate students when it comes to using technology, and so we made a conscious effort to overcome this by performing live demonstrations whenever appropriate. Although we put a considerable amount of time and effort into the design of our apps, mainly to make them user-friendly, we think it is important not to add unnecessary features that could distract from the overall methods being used. The feedback from some of our students suggests that such apps might not be completely appropriate as a learning tool for some individuals. It should be made clear to students that they can, should they prefer, use their own software or write their own code to perform analyses, and that the apps provided are perhaps there as an additional tool to support and augment their learning experience. It may have been the case that we promoted the use of our apps too heavily, and some students who may have otherwise benefited from writing their own code in R were dissuaded from doing so—perhaps to their detriment.
We think it is important to be realistic in terms of what can be achieved when producing Shiny apps to support methods in the recently published literature. For example, there are relatively few examples of Bayesian inference for extremes in the literature (certainly when compared to analyses performed in the frequentist setting). However, at the outset we completely underestimated the time and effort necessary to “convert” our existing R code into code that would produce a Shiny app (for example to enable widgets and interactive graphics), and that was just for our own recently-published work! Our initial plan had been to produce a much more extensive set of apps that could perform Bayesian analyses based on the work published in many more papers, and this was a completely unrealistic plan. Even once our Shiny apps looked like they were working, it was important to have extensive test runs to make sure there were no bugs (and there were, and it took many hours to iron out some of these bugs!). We think it is important for apps that require computationally intensive methods to have base R code that is as efficient as possible, and we spent a considerable amount of time re-writing our original code with this aim in mind. Also, we were lucky enough to be given a University server on which users can run our Shiny apps. This makes managing use of the apps much easier, with students being given log-in credentials to the server. It also makes having multiple simultaneous users of the apps (some of which use computationally intensive simulation-based procedures—e.g., MCMC schemes) a much more realistic feat! For those who may not have access to such a server, RStudio allows Shiny app developers to purchase such resource, with both business and academic pricing policies (see https://www.rstudio.com/products/shiny/shiny-server/).
Supplementary Material
The appendices for this article can be accessed as supplementary material on the publisher's website.
UJSE_1436999_Supplementary_File.zip
Download Zip (26.9 KB)Acknowledgments
The author would like to thank Keith Newman for his support in developing the Shiny apps discussed in this article, as well as the undergraduate interns who worked under Keith's supervision: Amy Green, Theo Roe, and Emma Bradley. We also thank the Editors and reviewers for their comments and suggestions, which we feel has greatly improved the manuscript.
Notes
1 The course discussed in this article was attended by students working at Masters level. Although we might not expect RILT activities to have such a natural place in lower level Statistics courses, there might be a case for replacing standard lectures with more interactive sessions in these courses too, for example to promote a deeper understanding of more basic concepts (see, e.g., Everson and Garfield Citation2008). However, we think more careful consideration would be needed here to identify the course material to be taken out of lectures
References
- Chance, B., and Rossman, A. (2006), “Using Simulation to Teach and Learn Statistics,” in Proceedings of the Seventh International Conference on Teaching Statistics [CD-ROM], eds. A. Rossman and B. Chance, Voorburg, The Netherlands: International Statistical Institute.
- Chance, B., Ben-Zvi, D., Garfield, J., and Medina, E. (2007), “The Role of Technology in Improving Student Learning of Statistics,” Technology Innovations in Statistics Education, 1(1), 1–24.
- Chang, W., Cheng, J., Allaire, J. J., Xie, Y., and McPherson, J. (2015), “Shiny: Web Application Framework for R. R package version 0.11.1,” Retrieved February 23, 2016. Available at www.CRAN.R-project.org/package=shiny.
- Cherian, V. I., and Siweya, J. (1996), “Gender and Achievement in Mathematics by Indigenous African Students Majoring in Mathematics,” Psychological Reports, 78(1), 236–238.
- Cobb, P., and McClain, K. (2004), “Principles of Instructional Design for Supporting the Development of Students' Statistical Reasoning,” in The Challenge of Developing Statistical Literacy, Reasoning, and Thinking (pp. 375–396). eds. D. Ben-Zvi and J. Garfield, Dordrecht, The Netherlands: Kluwer Academic Publishers.
- Coles, S. G. (2001), An Introduction to Statistical Modeling of Extreme Values. London: Springer.
- Coles, S. G., Pericchi, L. R., and Sisson, S. (2003), “A Fully Probabilistic Approach to Extreme Rainfall Modeling,” Journal of Hydrology, 1, 35–50.
- Coles, S.G., and Tawn, J. A. (1996), “A Bayesian Analysis of Extreme Rainfall Data,” Journal of the Royal Statistical Society, Series C, 45, 463–478.
- Crosling, G., and Webb, G. (2002), Supporting Student Learning: Case Studies, Experience and Practice from Higher Education. London: Kogan Page.
- Daisley, P. (1979), “Statistical Thinking Rather Than Statistical Methods,” Journal of the Royal Statistical Society, Series D, 28, 231–239.
- Davison, A. C., Padoan, S. A., and Ribatet, M. (2012), “Statistical Modeling of Spatial Extremes,” Statistical Science, 27, 161–186.
- DelMas, R., Garfield, J., and Chance, B. (1999), “A Model of Classroom Research in Action: Developing Simulation Activities to Improve Students' Statistical Reasoning,” Journal of Statistics Education, 7(3).
- DePaolo, C.A. (2010), “The STAT-ATTIC Website: Links to Statistics Applets for Introductory Courses,” Journal of Statistics Education, 18(3), 1–13.
- Doi, J., Potter, G., Wong, J., Alcaraz, I., and Chi, P. (2016), “Web Application Teaching Tools for Statistics Using R and Shiny,” Technology Innovations in Statistics Education, 9(1), 1–33.
- Edwards, H., Smith, B., and Webb, G. (Eds.) (2001), Lecturing: Case Studies, Experience and Practice. London: Kogan Page.
- Erickson, T. E. (2012), “Designing Games for Understanding in a Data Analysis Environment,” in Proceedings of the International Association for Statistical Education (IASE) Roundtable on “Virtualities and Realities”. Cebu, Philippines: International Statistical Institute.
- Everson, M. G., and Garfield, J. (2008), “An Innovative Approach to Teaching Online Statistics Courses,” Technology Innovations in Statistics Education, 2(1), 1–18.
- Eugenia Castellanos, M., and Cabras, S. (2007), “A Default Bayesian Procedure for the Generalized Pareto Distribution,” Journal of Statistical Planning and Inference, 137(2), 473–483.
- Fawcett, L., and Walshaw, D. (2006a), “Markov Chain Models for Extreme Wind Speeds,” Environmetrics, 17(8), 795–809.
- ——— (2006b), “A Hierarchical Model for Extreme Wind Speeds,” Journal of the Royal Statistical Society, Series C, 55(5), 631–646.
- ——— (2016), “Sea-Surge and Wind Speed Extremes: Optimal Estimation Strategies for Planners and Engineers,” Stochastic Environmental Research and Risk Assessment, 30, 463–480.
- Feingold, A. (1988), “Cognitive Gender Differences are Disappearing,” American Psychologist, 43(2), 95–103.
- Finzer, W. (2006), Fathom Dynamic Data Software (version 2.4), Emeryville, CA: Key Curriculum Press
- ——— (2013), “The Data Science Education Dilemma,” Technology Innovations in Statistics Education, 7(2).
- Franklin, C., and Garfield, J. (2006), “The GAISE (Guidelines for Assessment and Instruction in Statistics Education) Project: Developing Statistics Education Guidelines for pre K-12 and College Courses,” in 2006 NCTM Yearbook: Thinking and Reasoning with Data and Chance, ed. G. Burrill, Reston, VA: National Council of Teachers of Mathematics.
- Griffiths, R. (2004), “Knowledge Production and the Research-Teaching Nexus: The Case of the Built Environment Disciplines,” Studies in Higher Education, 29(6), 709–726.
- Hagtvedt, R., Jones, G. T., and Jones, K. (2007), “Pedagogical Simulation of Sampling Distributions and the Central Limit Theorem,” Teaching Statistics, 29, 94–97.
- Healey, M. (2005), “Linking Research and Teaching: Exploring Disciplinary Spaces and the Role of Inquiry-Based Learning,” in Reshaping the University: New Relationships Between Research, Scholarship and Teaching, ed. R. Barnett, Maidenhead: McGraw-Hill/Open University Press, pp. 67–78.
- Herreid, C. F. (2007), Start with a Story: The Case Study Method of Teaching College Science. Arlington, VA: NSTA Press.
- Konold, C., and Miller, C. (2015), “TinkerPlots™ (version 2.2) [computer software]. Learn Troop,” available at: http://www.tinkerplots.com/
- Lane, D., and Tang, Z. (2000), “Effectiveness of Simulation Training on Transfer of Statistical Concepts,” Journal of Educational Computing Research, 22, 383–396.
- Levy, P. and Petrulis, R. (2007), “Towards Transformation? First Year Students, Inquiry-Based Learning and the Research/Teaching Nexus,” in Proceedings of the Annual Conference of the Society for Research into Higher Education (SRHE), 11–13 December 2007, Brighton, U.K.
- Lunsford, M., Rowell, G., and Goodson-Espy, T. (2006), “Classroom Research: Assessment of Student Understanding of Sampling Distributions of Means and the Central Limit Theorem in Post-Calculus Probability and Statistics Classes,” Journal of Statistics Education, 14(3).
- Nolan, D., and Speed, T. P. (1999), “Teaching Statistics Theory Through Applications,” The American Statistician, 53(4), 370–375.
- Payne, L. (2015), “Gender Differences in Mathematics Ability at an Undergraduate Level,” Transformations, 1(1), 87–102.
- R Core Team (2015), R: A Language and Environment for Statistical Computing. Vienna, Austria: R Foundation for Statistical Computing. Available at: www.R-project.org.
- Rowell, G.H. (2004), “Assessment of Using Technology for Teaching Statistics,” Paper presented at the ARTIST Roundtable Conference on Assessment in Statistics held at Lawrence University, August 2004.
- Sang, H., and Gelfand, A. E. (2009), “Hierarchical Modeling for Extreme Values Observed Over Space and Time,” Environmental and Ecological Statistics, 16, 407–426.
- Sisson, S. A., Perrichi, L. R., and Coles, S. G. (2006), “A Case for a Reassessment of the Risks of Extreme Hydrological Hazards in the Caribbean,” Stochastic Environmental Research and Risk Assessment, 20(4), 296–306.
- Wassermann, S. (1994), Introduction to Case Method Teaching: A Guide to the Galaxy. New York, NY: Teachers College Press, Columbia University.
- Watson, J., and Donne, J. (2009), “TinkerPlots as a Research Tool to Explore Student Understanding,” Technology Innovations in Statistics Education, 3(1).
- Wild, C. J., and Pfannkuch, M. (1999), “Statistical Thinking in Empirical Enquiry (with Discussion),” International Statistical Review, 67, 223–265.
- Zieffler, A., Garfield, J., Alt, S., Dupuis, D., Holleque, K., and Chang, B. (2008), “What Does Research Suggest About the Teaching and Learning of Introductory Statistics at the College Level? A Review of the Literature,” Journal of Statistics Education, 16(2).
- Zieffler, A., Park, J., Garfield, J., delMas, R., and Bjornsdottir, A. (2012), “The Statistics Teaching Inventory: A Survey on Statistics Teachers' Classroom Practices and Beliefs,” Journal of Statistics Education, 20(1).