
Abstract
Biostatistics is a critical skill to physicians in an evidence-based medicine era, but teaching basic statistical concepts is challenging. Students often experience anxiety caused by the complexity of statistics and might express negative attitudes toward the subject. We aimed to analyze the effect of an introductory biostatistics course using RStudio on attitude toward statistics and assess its acceptance among medical students. Forty-three 1st-year medical students were included. Pre- and post-course attitudes toward statistics were assessed using the Survey of Attitudes Toward Statistics (SATS-28) scale and technology acceptance was assessed by a Technology Acceptance Model scale at the end of the course. There was a statistically discernible (significant) gain in the scores of three of the four SATS dimensions: affection (p = 0.006, Cohen’s d = 0.442), cognitive competence (p < 0.001, Cohen’s d = 0.605), and difficulty (p = 0.008, Cohen’s d = 0.421). Acceptance of RStudio was moderate to high in 93% of the participants, without statistical differences between genders. RStudio can be useful in the teaching of statistics to medical students, being well accepted and positively associated with students’ attitude toward statistics. Supplementary files for this article are available online.
1 Introduction
Statistics literacy is a core competence for health professionals in the evidence-based medicine era (Hill Citation1947; Sackett and Rosenberg Citation1995; Hayat Citation2018; Oster and Enders Citation2018). Nonetheless, statistics is generally considered a hard course by the students (Zieffler et al. Citation2008), which can result in uncomfortable levels of anxiety (Onwuegbuzie and Wilson Citation2003). Medical students in particular prefer to avoid math heavy courses and might have a negative attitude toward statistics (Clarke, Clayton, and Donaldson Citation1980; Altman and Bland Citation1991; Miles et al. Citation2010), which contribute to deficient learning and low performance (Emmioğlu and Capa-Aydin Citation2012; Ramirez, Schau, and Emmioglu Citation2012; Stanisavljevic et al. Citation2014).
To overcome this challenge and engage students in the process of learning statistics, many authors have recommended the use of computers and statistics packages as teaching tools (GAISE College Report ASA Revision Committee Citation2016; Sigal and Chalmers Citation2016). The use of software to teach statistics might aid students to actively construct knowledge through observation and experimentation (Ben-Zvi Citation2000). Statistical software allows students to visualize and interact with the dataset increasing comprehension of the analysis and improving performance (Garfield Citation1995; Garfield and Ben-Zvi Citation2007; Larwin and Larwin Citation2011). It also allows them to apply the acquired knowledge, which may increase interest, motivation, and engagement, in addition to making the effort expended in learning be perceived as useful (Altman and Bland Citation1991; Neumann, Hood, and Neumann Citation2013).
The addition of a software to introductory statistical classes must take a series of factors into account: availability, ease of use, possibility to generate graphs and images, ease of access to literature on software, documentation of the software, availability of packages, future usefulness of the software for academic life, cost of installation and of future upgrades and updates. One of today’s most popular software programs for data analysis is the statistical language R (Vance Citation2009; Rexer, Gearan, and Allen Citation2015; Tippmann Citation2015), which Robert Gentleman and Ross Ihaka created in 1993 to teach their introductory statistical courses at the University of Auckland because the existing commercial software was not suited to that purpose (Ihaka Citation1998).
Considering that ease of use is an important factor in shaping students’ attitude toward statistics, it is vital to introduce the software to the students in a friendly manner. The use of R language is simplified when it is coupled with an integrated development environment (IDE), such as RStudio. In a 2015 study, 62% of R users relied on RStudio as an interface to work with that language, and it is currently the most popular development environment among R users (Rexer, Gearan, and Allen Citation2015). The possibility of students working with previously prepared scripts in RStudio’s Notebook is an important factor in decreasing the level of difficulty associated with using R language. These documents can store text and photos, as well as field codes and their results, allowing a document to contain the reference text, like the codes to be used during the study. The visualization of each step of the analysis and the logical sequence of that process facilitate the learning of statistics even further. In other words, despite R’s complexity and slower learning curve, using RStudio may mitigate this difficulty.
However, the acceptance of RStudio in health sciences education has not been evaluated yet. The use of R language in the classroom is frequently complex and stress-inducing for teachers and students alike, particularly those with little or no programing experience (Gomes and Sousa Citation2018). As most students are familiar with user-friendly apps with functions easily accessed by one click, the need to type in the statistical commands may, at first, cause some discomfort. Conversely, proprietary statistical software packages usually have a myriad of options embedded in their menus, creating an overload of information to the novice user which increases the extrinsic cognitive load, and may negatively interfere with learning (Sweller Citation1988).
This study sought to measure acceptance of the RStudio software using R language and the impact of that software on medical students’ attitude toward statistics.
2 Methods
2.1 Study Design
This 2017 quasi-experimental study was designed to evaluate the attitude toward statistics of the medical students at Centro Universitário Presidente Tancredo de Almeida Neves (UNIPTAN), Minas Gerais, Brazil, on two separate occasions during the introductory course of biostatistics: at the beginning and at the end of the school semester. At the end of the semester, a questionnaire was also applied to evaluate the degree with which students accepted the RStudio software.
2.2 Sample
First year medical students were recruited prior to the beginning of an introductory statistical course. Fifty-six students were enrolled in the course in 2017 and 48 showed up in the first day of class. Two students were excluded because they had already taken a statistical course before and three students were transferred to another school in the middle of the semester. Therefore, the final sample consisted of 43 students who filled out the questionnaires at the beginning and at the end of the course: 17 men (39.5%) and 26 women (60.5%). Their mean age was 20.9 (±2.2).
2.3 Procedures
In the first year of medical school, as a part of the regular medical curriculum at UNIPTAN, students take an introductory statistical course focusing on data analysis covering topics such as data types, central tendency and dispersion measures, correlation, regression, probability distributions, z-scores, statistical inference, p-values, significance (discernibility) level, confidence interval, and hypothesis testing.
This 18-week course consists of 1 hr of lecture and 2 hr of practical activities using R and RStudio per week. The students receive the study material in R Notebook files, with R codes previously prepared, in such a way that they can focus on learning the statistical concepts rather than on coding. Students work on their own notebooks during in-class working sessions with supervision of the teacher and one teaching assistant. Course assessment consists of two paper-based tests to evaluate students’ knowledge of statistical concepts (mid-term and final evaluation) and two computer-based tests in which students need to analyze datasets using RStudio (mid-term and final evaluation).
At the outset (Phase I), students answered a sociodemographic questionnaire immediately followed by a Survey of Attitudes Toward Statistics (SATS-28) to measure their attitude at the beginning of the course. At the end of the course (Phase II), the SATS-28 questionnaire was reapplied along with a Technology Acceptance Model (TAM) questionnaire.
2.4 Instruments
2.4.1 RStudio Acceptance
Acceptance of RStudio, that is, acceptance of the use of R language through RStudio software, was assessed by means of the TAM developed by Davis (Citation1986, Citation1989), with three dimensions (attitude toward RStudio, perceived usefulness, perceived ease of use), each with five items, measured through a seven-point Likert scale.
2.4.2 Attitudes Toward Statistics Measurement
To measure the change in medical students’ attitude toward statistics, we used the SATS-28 scale, created by Schau et al. (Citation1995) and adapted to Portuguese by Vendramini et al. (Citation2011). The SATS-28 consists of 28 items, divided into four dimensions: affect (feelings toward statistics), cognitive competence (attitudes toward intellect and skills applied to statistics), value (attitudes toward statistical usefulness and relevance), and difficulty (attitudes toward the difficulty of statistics as a subject). Each item is assessed by a seven-point Likert scale where 1 = “very strongly disagree” and 7 = “very strongly agree” (4 being neutral). The score of each dimension is defined as the mean score of the items that comprise it. Higher scores always mean more positive attitudes. It is worth mentioning that higher scores in the difficulty dimension means statistics is easier.
2.5 Statistical Analysis
Statistical analysis was done with R language version 3.3.4 (R Core Team Citation2018) through RStudio version 1.1.423 (RStudio Team Citation2016), using tidyverse (Wickham Citation2017), magrittr (Bache and Wickham 2014), effsize (Torchiano Citation2017). Statistical discernibility (significance) level of 0.05 (alpha = 0.05) was used, and all tests of significance relied on the parameters for a two-tailed test. The descriptive analysis of the characteristics of the eligible population was done from the distribution of frequency of categorical variables and by means of the measures of central trend and dispersion of continuous variables. Descriptive measures such as minimum, maximum, median, mean, standard deviation (SD), and a 95% confidence interval for the mean, in addition to percentages were used to describe the studied variables.
To compare each of the four dimensions of the SATS questionnaire between the results found at the beginning of the course and those at the end of it, a paired/dependent sample Student’s t-test was taken. The scores of the three TAM dimensions were used to group the students according to the degree of acceptance of RStudio according to the k-mean method. The Welch t-test to compare the SATS-28 means between the male sex and the female sex, the mean TAM scores between men and women, and the final grades of the men and the women, and also, to compare the means of the final grades within the clusters of high and moderate acceptance of technology, generated by the analysis of conglomerates. The size of the effect measured through Cohen’s d coefficient was determined in R through Marco Torchiano’s “effsize” package (2017). The acceptance of the technology was determined by analyzing the clusters based on the k-mean method (Johnson and Wichern Citation1988; Hair et al. Citation2005).
3 Results
3.1 RStudio Acceptance
The scores of the three TAM dimensions (attitude, perceived usefulness/utility, and perceived ease of use/facility) are presented in . The facility dimension had a mean score discernibly lower than that of the other two dimensions (p < 0.001) and the scores of the attitude and usefulness were not discernibly different. There were no discernible differences between male and female students in any of the three TAM dimensions (). The analysis by conglomerate showed that most of the students presented a high (41.8%) or moderate (51.2%) degree of technology acceptance and that there was no statistically discernible association between the student’s sex and degree of technology acceptance (p = 0.23) ().
Fig. 1 TAM scores, male and female.
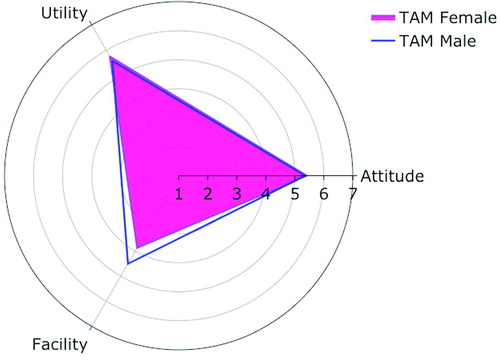
Table 1 TAM scores.
Table 2 RStudio degree of acceptance according to sex.
3.2 Attitudes Toward Statistics Change
There was an improvement in attitude in all SATS-28 dimensions, which was statistically discernible in three of the four dimensions: affect, cognitive competence, and difficulty ( and ). The competence dimension had the highest effect size (0.605). Analysis of the change in attitude toward statistics stratified by sex showed a statistically discernible improvement for the affect, difficulty, and cognitive competence dimensions only among women ( and , ).
Fig. 2 SATS-28 pre- and post-course.
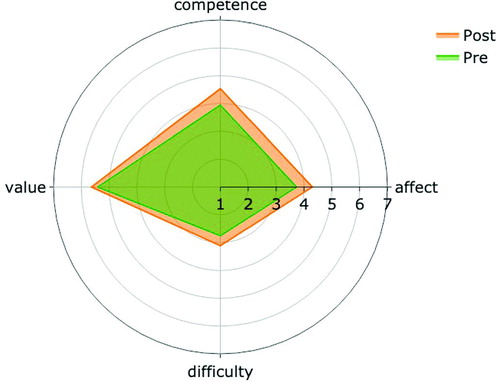
Fig. 3 SATS, females and males (pre- and post-scores).
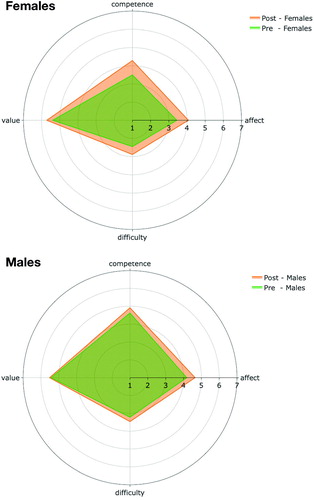
Table 3 SATS-28, scores pre- and post-course—all students.
Table 4 SATS-28, scores pre- and post-course—females (n = 26).
Table 5 SATS-28, scores pre and post course—males (n = 17).
Comparing male and female students with respects to attitude toward statistics at the beginning of the course, it was observed that all the mean scores of the SATS dimensions were higher among men, and that difference was statistically discernible in the competence and difficulty dimensions (pre-course difference (male-female) in mean scores (95% CI)): affect 0.74 (-0.05, 1.52,); competence 1.12 (0.44, 1.81); value 0.04 (-0.53, 0.60); difficulty 0.77 (0.20, 1.34). However, at the end of the course, although the men continued to have higher means than the women did, that difference was only statistically discernible in the difficulty dimension (post-course difference (male-female) in mean scores (95% CI)): affect 0.57 (-0.26, 1.40); competence 0.62 (-0.13, 1.38); value -0.20 (-0.74, 0.33); difficulty 0.58 (0.11, 1.04). The competence dimension, in which women had a lower mean score than men did, increased for both sexes, and there was no discernible difference in that dimension at the end of the course.
3.3 Attitudes Toward Statistics, Performance, and RStudio Degree of Acceptance
By stratifying the change in the scores of the SATS dimensions according to the degree of acceptance of RStudio in three groups, we were able to see that the cluster with high acceptance had a statistically discernible improvement in the mean scores of all SATS dimensions (). In the cluster with moderate acceptance, despite an improvement in the mean scores for all dimensions, the improvement was only discernible in the competence dimension. The cluster with low acceptance had three students only and was therefore not included in the statistical analysis.
Table 6 SATS change, according to RStudio degree of acceptance.
Final grades were also greater in the high acceptance group with differences larger than chance variation would generate. Students in the high RStudio acceptance group had higher final performance scores compared with those in the moderate acceptance group (87.4 ± 5.53 vs. 82.1 ± 4.27; p = 0.002) ().
Table 7 Final grades, according to RStudio degree of acceptance.
The analysis of the correlation between post-course SATS score and students’ final performance score in the course showed a positive correlation for value (r = 0.54; p < 0.001) and affect (r = 0.32; p = 0.04) dimensions.
4 Discussion
Our findings indicate that there was good acceptance of the technology (RStudio) by the students, without differences in the TAM scores between male and female. The cluster analysis showed that the use of RStudio was well accepted, with most (93%) of the students classified as having a moderate or high degree of acceptance, without differences between the sexes. The TAM’s utility dimension scored high (5.7/7), well above the point of neutrality of the scale, showing that the students perceived that RStudio was instrumental in improving their performance, productivity, and efficacy during statistics classes. The TAM’s attitude dimension also scored well above the neutrality point (5.4/7), showing that the students perceived that RStudio was useful, making statistics classes more interesting, more pleasant, and positive experience overall. The facility dimension of the RStudio had the lowest score (4.1/7). However, although the mean score of this dimension was lower than that of the others, this result was practically at the point of neutrality (4) of the scale and higher than initially expected, considering that R is a programing language and, even with the help of the RStudio environment, the initial difficulty of learning to use it is a critical point (Lander Citation2014).
The introductory statistics course with the use of the RStudio brought about an improvement in students’ attitude toward statistics, with a statistically discernible gain in cognitive competence, in affect, and in difficulty toward statistics at the end of the course. In other words, an introductory statistics course using RStudio improved students’ perception to understanding statistics (cognitive competence), improved students’ feelings toward statistics (affect), and raised perception regarding the difficulty in learning statistics, that is, there was a reduction in the level of difficulty in learning statistics.
The perception of the difficulty of statistics improved discernibly in our sample. There was an increase of 0.36 points in the mean score for difficulty, indicating a decrease in difficulty. Most of the literature shows unexpressive increases (Finney and Schraw Citation2003; Cashin and Elmore Citation2005; Carnell Citation2008; Froelich, Stephenson, and Duckworth Citation2008; Harpe, Phipps, and Alowayesh Citation2012; Schau and Emmioğlu Citation2012; Jatnika Citation2015), no change (Harpe, Phipps, and Alowayesh Citation2012), or even reductions in the mean score of this dimension (Faghihi and Rakow Citation1995; Dempster and McCorry Citation2009; DeVaney Citation2010; Bond, Perkins, and Ramirez Citation2012; Zhang et al. Citation2012; Milic et al. Citation2016). Few studies found a discernible increase in the difficulty dimension (Carlson and Winquist Citation2011; Gundlach et al. Citation2015).
The mean score for cognitive competence increased by 0.59 points. Considering that a 0.5 points difference in the SATS score can be regarded as relevant (Schau and Emmioğlu Citation2012), the increase of the score for cognitive competence found in our study is noteworthy. Previous studies show no increase or an increase lower than 0.5 points in cognitive competence scores (Carnell Citation2008; Bond, Perkins, and Ramirez Citation2012; Schau and Emmioğlu Citation2012; Kerby and Wroughton Citation2017). It is worth highlighting that cognitive competence dimension was the one with the highest effect size in our study (d = 0.605 in general; d = 0.727 for the women’s cluster, d = 0.406 for the men’s cluster).
SATS scores were discernibly lower for women when compared to men for the difficulty and cognitive competence dimensions at the beginning of the course. Such finding is corroborated by previous studies showing a pattern of greater insecurity and less self-confidence among women with respect to statistical skills (Fullerton and Umphrey Citation2001; Else-Quest, Hyde, and Linn Citation2010; Stanisavljevic et al. Citation2014; Chiesi and Primi Citation2015; Paechter et al. Citation2017). Nevertheless, at the end of the course, the difference in the scores for cognitive competence was not statistically discernible, suggesting that the course contributed to leveling off men’s and women’s feelings of cognitive competence. This finding became even more important when analyzed within a social context in which women tend to have less acceptance of the use of computers, and, therefore, could have benefited less with the introduction of a statistical software program in the classes (Whitley Citation1997; Wang and Degol Citation2017).
The mean score of the affect dimension also presented a statistically discernible gain in our study, with an absolute increase of 0.57 points. When compared to the literature, this increase was also relevant, since in most studies there was a reduction (Carnell Citation2008; Bond, Perkins, and Ramirez Citation2012) or only a tiny increase of this score (less than 0.3 points) (Chiesi and Primi Citation2010, Citation2017; Kerby and Wroughton Citation2017). Few studies show an increase in absolute values higher than 0.5 points of the score for the affect dimension (Carlson and Winquist Citation2011; Gundlach et al. Citation2015).
The value dimension showed an increase, but it was not a statistically discernible one. This finding is also interesting insofar as the literature has shown that a decrease is expected for this score (Carnell Citation2008; Bond, Perkins, and Ramirez Citation2012; Gundlach et al. Citation2015; Kerby and Wroughton Citation2017).
Considering that the literature shows that it is hard to see changes in SATS scores over a single semester (Gal and Ginsburg Citation1994; Gal, Ginsburg, and Schau Citation1997; Zieffler et al. Citation2008; Schau and Emmioğlu Citation2012; Gundlach et al. Citation2015) and that few authors have demonstrated an increase in SATS scores at the end of the course (Carlson and Winquist Citation2011; Chiesi and Primi Citation2017), our findings show that the use of R language jointly with RStudio might be interesting choices to teach statistics.
Another objective in our study was to assess the relationship between the degree of acceptance of RStudio and a change in attitude toward statistics. We have observed a positive association between the degree of acceptance and the gain in SATS dimensions. In the cluster with high acceptance, there was a discernible improvement in affect toward statistics, in valuing the knowledge of statistics, and in the feeling of competence toward statistics. As for the cluster with moderate acceptance, the gain was only discernible for the competence dimension. It might be the case that acceptance of the statistical software influences attitude toward statistics. If it is so, a study that tries to determine attitude toward statistics should also evaluate the acceptance of the software used in class.
The final grades were also better in the group with high acceptance of the statistical software, suggesting a positive influence of acceptance in the learning process. These results indicate that performance assessment should also take into consideration the level of software acceptance. Unfortunately, most of the literature on the change of attitude toward statistics does not take account of the influence of the software used during the course nor does it mention if any software was ever used. Although RStudio is the most popular IDE for R language, we have not found mention of the use of RStudio in many previous studies concerning the change of attitude toward statistics. In the few studies that mentioned the software used, the R was cited in only one (Chiesi and Primi Citation2017), which did not use RStudio, but, rather, R-Commander. In the aforementioned study, there was a statistically discernible increase in the scores of all SATS dimensions, except for the value dimension. In a study that specifically assessed the effect of using SPSS® statistical software package no discernible changes were found in any of the SATS dimensions, except for some improvement of the cognitive competence dimension, whereas there was a statistically discernible decrease in students’ grades after the introduction of the SPSS® (Jatnika Citation2015). In another study using SPSS to teach statistics to doctors, a reduction in all SATS dimensions was found at the end of the course (Zhang et al. Citation2012). So, it appears that the software might play a role in the learning process and that needs to be taken into consideration in future research.
The main limitation of this study was the fact that there was no control group. Therefore, we were unable to isolate the effect of RStudio on students’ attitude toward statistics. The generalization of the findings is also limited because medical students of a single institution were assessed, and the sample was relatively small. The comparisons of the SATS scores with those of literature must be viewed with caution, considering the great heterogeneity of the courses regarding methodology, credit hours of each course, content, target population, teachers’ skills, and assessment methods. The design of the course also does not allow us to infer causality in the associations found between acceptance of technology and attitude toward statistics, considering that causality may occur in both directions or even derive from unassessed confusion factors.
We hope that our findings may encourage further research regarding the role of R language and the RStudio software as tools for teaching medical statistics courses. We also hope that these findings can serve to assist in planning and organizing statistics courses in the area of health and, lastly, contribute to improving health professionals’ knowledge of statistics.
5 Conclusions
Our findings suggest that the use of R language jointly with the RStudio software program appears to be a viable option in a health-oriented course of introductory statistics.
The fact that R is a programing language is, in fact, the most critical factor when evaluating its use in a course for health professionals, precisely because of these professionals’ lack of familiarity with this type of language. However, the findings in this study have shown that this apprehension must not prevent the use of this tool. As viewed through a different lens, the fact that it is a programing language can be considered a virtue because of its flexibility, allowing instructors to adapt it as conveniently as they can to a given context. The greatest restriction to its use is, in fact, the instructor’s mastery of R language and RStudio. Well-designed practical classes, with appropriate programing scripts lessen students’ efforts. As pointed out by Perry et al. (Citation2014), successful use of a software package in a statistical course can make it intriguing and interesting for students, integrating clinical content and real situations in the classes, and turning anxiety into a stimulus to overcome challenges. If carefully planned, the use of R language with RStudio might be an important tool to teach statistics, and its introduction in a health-oriented course could be a valuable choice.
Supplemental Material
Download Zip (11.5 KB)Supplemental Material
Download Zip (1.4 MB)Acknowledgments
We thank Dr. Candace Schau for allowing the use of SATS scale in our research.
Disclosure Statement
No potential conflict of interest was reported by the author(s).
Henrique Alvarenga da Silva http://orcid.org/0000-0001-9799-5240
Alexandre Sampaio Moura http://orcid.org/0000-0002-4818-5425
References
- Altman, D. G., and Bland, J. M. (1991), “Improving Doctors’ Understanding of Statistics,” Journal of the Royal Statistical Society, Series A, 154, 223–267, DOI: 10.2307/2983040.
- Bache, S. M., and Wickham, H. (2014), “magrittr: A Forward-Pipe Operator for R.”
- Ben-Zvi, D. (2000), “Toward Understanding the Role of Technological Tools in Statistical Learning,” Mathematical Thinking and Learning, 2, 127–155, DOI: 10.1207/S15327833MTL0202_6.
- Bond, M. E., Perkins, S. N., and Ramirez, C. (2012), “Students’ Perceptions of Statistics: An Exploration of Attitudes, Conceptualizations, and Content Knowledge of Statistics,” Statistics Education Research Journal, 11, 6–25.
- Carlson, K. A., and Winquist, J. R. (2011), “Evaluating an Active Learning Approach to Teaching Introductory Statistics: A Classroom Workbook Approach,” Journal of Statistics Education, 19. DOI: 10.1080/10691898.2011.11889596.
- Carnell, L. J. (2008), “The Effect of a Student-Designed Data Collection Project on Attitudes Toward Statistics,” Journal of Statistics Education, 16. DOI: 10.1080/10691898.2008.11889551.
- Cashin, S. E., and Elmore, P. B. (2005), “The Survey of Attitudes Toward Statistics Scale: A Construct Validity Study,” Educational and Psychological Measurement, 65, 509–524, DOI: 10.1177/0013164404272488.
- Chiesi, F., and Primi, C. (2010), “Cognitive and Non-Cognitive Factors Related to Students’ Statistics Achievement,” Statistics Education Research Journal, 9.
- Chiesi, F., and Primi, C. (2015), “Gender Differences in Attitudes Toward Statistics: Is There a Case for a Confidence Gap?,” in CERME 9-Ninth Congress of the European Society for Research in Mathematics Education.
- Chiesi, F., and Primi, C. (2017), “Do Attitudes Toward Statistics Change During an Introductory Statistics Course? A Study on Italian Psychology Students,” in 10th Congress of European Research in Mathematics Education.
- Clarke, M., Clayton, D. G., and Donaldson, L. J. (1980), “Teaching Epidemiology and Statistics to Medical Students the Leicester Experience,” International Journal of Epidemiology, 9, 179–185. DOI: 10.1093/ije/9.2.179.
- Davis, F. D. (1986), “A Technology Acceptance Model for Empirically Testing New End-User Information Systems: Theory and Results,” Tese, Massachusetts Institute of Technology, Sloan School of Management.
- Davis, F. D. (1989), “Perceived Usefulness, Perceived Ease of Use, and User Acceptance of Information Technology,” MIS Quarterly, 13, 319–340, DOI: 10.2307/249008.
- Dempster, M., and McCorry, N. K. (2009), “The Role of Previous Experience and Attitudes Toward Statistics in Statistics Assessment Outcomes Among Undergraduate Psychology Students,” Journal of Statistics Education, 17. DOI: 10.1080/10691898.2009.11889515.
- DeVaney, T. A. (2010), “Anxiety and Attitude of Graduate Students in On-Campus vs. Online Statistics Courses,” Journal of Statistics Education, 18. DOI: 10.1080/10691898.2010.11889472.
- Else-Quest, N. M., Hyde, J. S., and Linn, M. C. (2010), “Cross-National Patterns of Gender Differences in Mathematics: A Meta-Analysis,” Psychological Bulletin, 136, 103–127.
- Emmioğlu, E., and Capa-Aydin, Y. (2012), “Attitudes and Achievement in Statistics: A Meta-Analysis Study,” Statistics Education Research Journal, 11, 95–102.
- Faghihi, F., and Rakow, E. A. (1995), “The Relationship of Instructional Methods With Student Responses to the Survey of Attitudes Toward Statistics,” in Twenty-Fourth Annual Meeting of the Mid-South Educational Research Association, MSERA, Biloxi, MS.
- Finney, S. J., and Schraw, G. (2003), “Self-Efficacy Beliefs in College Statistics Courses,” Contemporary Educational Psychology, 28, 161–186. DOI: 10.1016/S0361-476X(02)00015-2.
- Froelich, A. G., Stephenson, W. R., and Duckworth, W. M. (2008), “Assessment of Materials for Engaging Students in Statistical Discovery,” Journal of Statistics Education, 16. DOI: 10.1080/10691898.2008.11889561.
- Fullerton, J. A., and Umphrey, D. (2001), “An Analysis of Attitudes Toward Statistics: Gender Differences Among Advertising Majors,” in Annual Meeting of the Association for Education in Journalism and Mass Communication, AEJMC, Washington, DC.
- GAISE College Report ASA Revision Committee (2016), “Guidelines for Assessment and Instruction in Statistics Education (GAISE) College Report 2016.”
- Gal, I., and Ginsburg, L. (1994), “The Role of Beliefs and Attitudes in Learning Statistics: Towards an Assessment Framework,” Journal of Statistics Education, 2, DOI: 10.1080/10691898.1994.11910471.
- Gal, I., Ginsburg, L., and Schau, C. (1997), “Monitoring Attitudes and Beliefs in Statistics Education,” in The Assessment Challenge in Statistics Education, eds. I. Gal and J. B. Garfield, Voorburg, The Netherlands: IOS Press, pp. 37–51.
- Garfield, J. (1995), “How Students Learn Statistics,” International Statistical Review/Revue Internationale de Statistique, 63, 25–34, DOI: 10.2307/1403775.
- Garfield, J., and Ben-Zvi, D. (2007), “How Students Learn Statistics Revisited: A Current Review of Research on Teaching and Learning Statistics,” International Statistical Review, 75, 372–396, DOI: 10.1111/j.1751-5823.2007.00029.x.
- Gomes, D., and Sousa, B. D. (2018), “Teaching With R—A Curse or a Blessing?,” in Looking Back, Looking Forward. Proceedings of the Tenth International Conference on Teaching Statistics, eds. A. Sorto, A. White, and L. Guyot, Kyoto: International Statistical Institute.
- Gundlach, E., Richards, K. A. R., Nelson, D., and Levesque-Bristol, C. (2015), “A Comparison of Student Attitudes, Statistical Reasoning, Performance, and Perceptions for Web-Augmented Traditional, Fully Online, and Flipped Sections of a Statistical Literacy Class,” Journal of Statistics Education, 23. DOI: 10.1080/10691898.2015.11889723.
- Hair, J. F., Jr., Anderson, R. E., Tatham, R. L., and Black, W. C. (2005), Análise Multivariada de Dados (5th ed.), Porto Alegre: ARTMED.
- Harpe, S. E., Phipps, L. B., and Alowayesh, M. S. (2012), “Effects of a Learning-Centered Approach to Assessment on Students’ Attitudes Towards and Knowledge of Statistics,” Currents in Pharmacy Teaching and Learning, 4, 247–255. DOI: 10.1016/j.cptl.2012.05.002.
- Hayat, M. J. (2018), “Statistics Education in the Health Sciences,” Journal of Statistics Education, 26, 135–136, DOI: 10.1080/10691898.2018.1483786.
- Hill, A. B. (1947), “Statistics in the Medical Curriculum?,” British Medical Journal, 2, 366–368. DOI: 10.1136/bmj.2.4522.366.
- Ihaka, R. (1998), “R: Past and Future History,” in Computing Science and Statistics, pp. 392–396.
- Jatnika, R. (2015), “The Effect of SPSS Course to Students Attitudes Toward Statistics and Achievement in Statistics,” International Journal of Information and Education Technology, 5, 818–821, DOI: 10.7763/IJIET.2015.V5.618.
- Johnson, R. A., and Wichern, D. W. (1988), Applied Multivariate Statistical Analysis (2nd ed.), Englewood Cliffs, NJ: Prentice-Hall.
- Kerby, A. T., and Wroughton, J. R. (2017), “When Do Students’ Attitudes Change? Investigating Student Attitudes at Midterm,” Statistics Education Research Journal, 16.
- Lander, J. P. (2014), R for Everyone: Advanced Analytics and Graphics, Upper Saddle River, NJ: Pearson Education.
- Larwin, K., and Larwin, D. (2011), “A Meta-Analysis Examining the Impact of Computer-Assisted Instruction on Postsecondary Statistics Education: 40 Years of Research,” Journal of Research on Technology in Education, 43, 253–278. DOI: 10.1080/15391523.2011.10782572.
- Miles, S., Price, G. M., Swift, L., Shepstone, L., and Leinster, S. J. (2010), “Statistics Teaching in Medical School: Opinions of Practising Doctors,” BMC Medical Education, 10, 75,DOI: 10.1186/1472-6920-10-75.
- Milic, N. M., Masic, S., Milin-Lazovic, J., Trajkovic, G., Bukumiric, Z., Savic, M., Milic, N. V., Cirkovic, A., Gajic, M., Kostic, M., Ilic, A., and Stanisavljevic, D. (2016), “The Importance of Medical Students’ Attitudes Regarding Cognitive Competence for Teaching Applied Statistics: Multi-Site Study and Meta-Analysis,” PLoS One, 11, e0164439, DOI: 10.1371/journal.pone.0164439.
- Neumann, D., Hood, M., and Neumann, M. (2013), “Using Real-Life Data When Teaching Statistics: Student Perceptions of This Strategy in an Introductory Statistics Course,” Statistics Education Research Journal, 12, 59–70.
- Onwuegbuzie, A. J., and Wilson, V. A. (2003), “Statistics Anxiety: Nature, Etiology, Antecedents, Effects, and Treatments—A Comprehensive Review of the Literature,” Teaching in Higher Education, 8, 195–209, DOI: 10.1080/1356251032000052447.
- Oster, R. A., and Enders, F. T. (2018), “The Importance of Statistical Competencies for Medical Research Learners,” Journal of Statistics Education, 26, 137–142, DOI: 10.1080/10691898.2018.1484674.
- Paechter, M., Macher, D., Martskvishvili, K., Wimmer, S., and Papousek, I. (2017), “Mathematics Anxiety and Statistics Anxiety. Shared but Also Unshared Components and Antagonistic Contributions to Performance in Statistics,” Frontiers in Psychology, 8, 1196,DOI: 10.3389/fpsyg.2017.01196.
- Perry, Z. H., Barak, A.-T., Neumann, L., and Levy, A. (2014), “Computer-Based Learning: The Use of SPSS Statistical Program for Improving Biostatistical Competence of Medical Students,” Journal of Biomedical Education, 2014, 298140, DOI: 10.1155/2014/298140.
- R Core Team (2018), R: A Language and Environment for Statistical Computing, Vienna, Austria: R Foundation for Statistical Computing.
- Ramirez, C., Schau, C., and Emmioglu, E. (2012), “The Importance of Attitudes in Statistics Education,” Statistics Education Research Journal, 11, 57–71.
- Rexer, K., Gearan, P., and Allen, H. (2015), “2015 Data Science Survey,” Rexer Analytics.
- RStudio Team (2016), RStudio: Integrated Development Environment for R, Boston, MA: RStudio, Inc.
- Sackett, D. L., and Rosenberg, W. M. (1995), “The Need for Evidence-Based Medicine,” Journal of the Royal Society of Medicine, 88, 620–624.
- Schau, C., and Emmioğlu, E. (2012), “Do Introductory Statistics Courses in the United States Improve Students’ Attitudes?,” Statistics Education Research Journal, 11.
- Schau, C., Stevens, J., Dauphinee, T. L., and Vecchio, A. D. (1995), “The Development and Validation of the Survey of Antitudes Toward Statistics,” Educational and Psychological Measurement, 55, 868–875. DOI: 10.1177/0013164495055005022.
- Sigal, M. J., and Chalmers, R. P. (2016), “Play It Again: Teaching Statistics With Monte Carlo Simulation,” Journal of Statistics Education, 24, 136–156, DOI: 10.1080/10691898.2016.1246953.
- Stanisavljevic, D., Trajkovic, G., Marinkovic, J., Bukumiric, Z., Cirkovic, A., and Milic, N. (2014), “Assessing Attitudes Towards Statistics Among Medical Students: Psychometric Properties of the Serbian Version of the Survey of Attitudes Towards Statistics (SATS),” PLoS One, 9, e112567. DOI: 10.1371/journal.pone.0112567.
- Sweller, J. (1988), “Cognitive Load During Problem Solving: Effects on Learning,” Cognitive Science, 12, 257–285, DOI: 10.1016/0364-0213(88)90023-7.
- Tippmann, S. (2015), “Programming Tools: Adventures With R,” Nature, 517, 109–110, DOI: 10.1038/517109a.
- Torchiano, M. (2017), “effsize: Efficient Effect Size Computation.”
- Vance, A. (2009), “Data Analysts Captivated by R’s Power,” New York Times, 6.
- Vendramini, C. M. M., Silva, C. B., Kataoka, V. Y., and Cazorla, I. M. (2011), “Validity Evidences of the Attitudes Towards Statistics Scale SATSPORTUGUÊS: A Study with Brazilian Students.” Paper presented at the 58th World Statistical Congress, Dublin.
- Wang, M. T., and Degol, J. L. (2017), “Gender Gap in Science, Technology, Engineering, and Mathematics (STEM): Current Knowledge, Implications for Practice, Policy, and Future Directions,” Educational Psychology Review, 29, 119–140, DOI: 10.1007/s10648-015-9355-x.
- Whitley, B. E., Jr.(1997), “Gender Differences in Computer-Related Attitudes and Behavior: A Meta-Analysis,” Computers in Human Behavior, 13, 1–22. DOI: 10.1016/S0747-5632(96)00026-X.
- Wickham, H. (2017), “tidyverse: Easily Install and Load the ‘Tidyverse’.”
- Zhang, Y., Shang, L., Wang, R., Zhao, Q., Li, C., Xu, Y., and Su, H. (2012), “Attitudes Toward Statistics in Medical Postgraduates: Measuring, Evaluating and Monitoring,” BMC Medical Education, 12, 117–124, DOI: 10.1186/1472-6920-12-117.
- Zieffler, A., Garfield, J., Alt, S., Dupuis, D., Holleque, K., and Chang, B. (2008), “What Does Research Suggest About the Teaching and Learning of Introductory Statistics at the College Level? A Review of the Literature,” Journal of Statistics Education, 16, DOI: 10.1080/10691898.2008.11889566.