
 ?Mathematical formulae have been encoded as MathML and are displayed in this HTML version using MathJax in order to improve their display. Uncheck the box to turn MathJax off. This feature requires Javascript. Click on a formula to zoom.
Abstract
One of the first simulation-based introductory statistics curricula to be developed was the NSF-funded Change Agents for Teaching and Learning Statistics curriculum. True to its name, this curriculum is constantly undergoing change. This article describes the story of the curriculum as it has evolved at the University of Minnesota and offers insight into promising new future avenues for the curriculum to continue to affect radical, substantive change in the teaching and learning of statistics. Supplementary materials for this article are available online.
1 Introduction
The NSF-funded Change Agents for Teaching and Learning Statistics (CATALST) curriculum was one of the first simulation-based introductory statistics curricula to be developed after Cobb’s (Citation2007) call for radical change in introductory statistics courses. CATALST has since been adopted and used at several institutions across the United States (e.g., Montana State University, University of Nebraska-Lincoln, and Portland State University), and at its birthplace, the University of Minnesota (UMN).
The CATALST curriculum is continually undergoing change. Changes occur for multiple reasons: to respond to assessment results that point out weaknesses, to update content to stay aligned with current statistical practice, and for practical reasons such as to make the teaching load more manageable for instructors. The year 2018 marked the 10-year anniversary of the start of funding of the CATALST grant, and also marked a time when the authors—a group of six statistics education researchers who had poured blood, sweat, and tears into the project—all moved on to new adventures. In this time of anniversary and change, this article offers a look back into our story with the curriculum and changes we made at the UMN. We also offer insight into how we envision the CATALST curriculum serving new groups in the future.
2 What Has Remained the Same?
The CATALST curriculum still draws heavily from its original foundations, namely: (1) the primary course learning objective is developing students’ statistical thinking, (2) the course uses a model-simulate-evaluate approach to statistical inference, and (3) the pedagogy is grounded in research-based educational principles. For a detailed introduction to the CATALST curriculum, please see Garfield, delMas, and Zieffler (Citation2012). The current course online textbook (e.g., Zieffler and Catalysts for Change 2017, and associated readings to be completed and videos to be watched by students outside of class) can be found at https://zief0002.github.io/statistical-thinking/.
2.1 The Goal: Develop Students’ Statistical Thinking
The primary learning objective has not changed: develop students’ statistical thinking, as described by Ben-Zvi and Garfield (Citation2004). Inspired by Schoenfeld’s (Citation1998) metaphor of helping students to be able to “really cook” rather than just follow recipes, the curriculum includes fewer topics than what is typically covered in other popular introductory statistics curricula (e.g., Lock et al. Citation2013; Moore, McCabe, and Craig Citation2017). For example, procedures for the t-test, chi-square test, regression, and ANOVA are not included. Rather, the scope of analysis is purposefully limited to one-proportion, two-proportions, one-mean, and two-means randomization tests and bootstrapped intervals, with the idea that students will develop a solid understanding of a few important principles of statistical thinking, including (but not limited to) “an understanding of how models are used to simulate random phenomena, how data are produced to estimate probabilities, and how, when, and why existing inferential tools can be used to aid an investigative process” (Ben-Zvi and Garfield Citation2004, p. 7).
2.2 The Method: Model-Simulate-Evaluate
The model-simulate-evaluate approach to understanding the core logic of statistical inference is based on Cobb’s suggestions (2007). Students are led to: (1) create a model, (2) randomize and repeat (i.e., generate simulated data based on the model and record a summary measure for each simulated trial), and (3) evaluate by comparing the observed data to a distribution of summary measures and making an assessment about whether the model is plausible.
As suggested by Chance et al. (Citation2007), and as supported in the recent study by Hancock and Rummerfield (Citation2020), we have held to the practice that students should first experience the model-simulate-evaluate process using physical objects before turning to technology. For example, to introduce randomization tests, students shuffle and deal paper notecards to randomly pair treatment assignments to participant outcomes. Then, students summarize the results of the randomization pairings and repeat the process several times. By first experiencing the physical simulation, students may gain a deeper understanding of the simulation process once it is conducted using technology. As stated by Chance and colleagues, “We do not want computer visualizations to just become a black box generating data” (Chance et al. Citation2007, p. 20).
Once students have experienced a physical simulation, they typically want to find faster ways to conduct a simulation. The CATALST curriculum has historically used TinkerPlots dynamic statistical software. TinkerPlots
allows students to create statistical models, produce simulated data from their models, and use the results of their simulations to evaluate the viability of their models. The software does not require command line programing; students can drag and click to create models. Research suggests that technologies such as TinkerPlots
help promote statistical thinking and reasoning (e.g., Watson Citation2008). We also appreciate how TinkerPlots
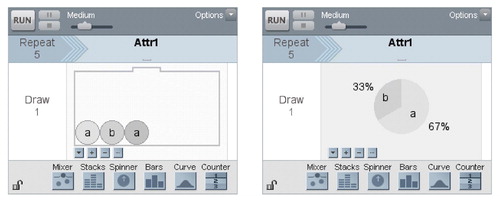
software has several sampling devices (“samplers”) available to create isomorphic models, whereby students can use creativity and innovation to arrive at correct answers in different ways. For example, displays the “mixer” and the “spinner,” two samplers that achieve the same purpose of drawing with replacement from a population for which the odds of drawing item “a” are 2:1. We imagine this flexibility of device selection helps students to see the salient elements of a correct model and learn to “really cook” rather than follow a recipe. We also like how the dynamic software explicitly illustrates the sampling process. This gives students opportunities to watch their models in action, tie the animated version to the physical simulations they conducted earlier (e.g., with the notecards), notice features of the simulation process, and “tinker” with their models as necessary. Historically, students were required to purchase TinkerPlots
software (which cost less than $20 for a 1-year license).
Fig. 1 Example of two samplers that achieve the same purpose. Both samplers will randomly select five items with replacement, with 2/3 probability of selecting “a” and 1/3 probability of selecting “b.”
2.3 The Pedagogy: Group-Based Active Learning
All generations of CATALST have remained true to pedagogical principles of educational research and instructional design that guided the initial course development (e.g., Cobb and McClain Citation2004; Garfield, delMas, and Zieffler Citation2012). In lieu of lectures, the course content is delivered primarily through activities where students work together in groups of two or three to answer questions and run simulations. Instructors provide scaffolding for the small groups as needed, monitor the groups for healthy function, and facilitate large-group discussions to highlight the main points of each lesson by building on arguments the students offer. Overall, instructors take the role of facilitators of learning rather than of deliverers of knowledge (e.g., Kember Citation1997).
In accordance to research that suggests students learn more if they make predictions before observing natural phenomena (e.g., Shaughnessy Citation1977), students are guided to make conjectures before running their simulations. Using the results of their simulations, students then revisit their conjectures and refine them, perhaps facing misconceptions they held.
3 What Has Changed?
While it may have the same roots, the CATALST curriculum is continually being evaluated and adjusted by a team of statistics education researchers and graduate students at the UMN. Some adjustments have been minor, others have been more substantial. For an example of a minor change, a brief course reading discussing the six principles of correct use of p-values (Wasserstein and Lazar Citation2016) was added when the American Statistical Association produced a report on the proper use of p-values. In fact, to facilitate the frequent changes to the readings, hard copies of the readings are no longer included in the textbook; readings are made available online to allow for frequent updates and easier incorporation of new materials as they arise. (See website https://zief0002.github.io/statistical-thinking/.)
It would be impossible to discuss all the strategies that have been tried, assessed, kept, or omitted. In the next sections, we tell the stories of some of the major changes in the curriculum and give the motivation for each. As you will see, some of the changes have been adopted because our teaching team realized there were gaps in student understanding and areas that needed further instruction. In other instances, we made changes based on practicality; adjustments helped us carry out the curriculum within the confines of our limited number of in-class hours and teaching resources.
3.1 Organization Overhaul: Smaller Units With More Focus
Earlier versions of the CATALST curriculum had three units, which are described in greater detail by Zieffler and Huberty (Citation2015). Unit 1 introduced simulations using TinkerPlots software and led students to use the results to evaluate models for one proportion. Unit 2 covered randomization tests for comparing two group means and two group proportions and brought in issues of appropriate conclusions that may be drawn based on the study design. The third unit included bootstrapping to create confidence intervals for proportions. The original plan was to start each unit with a model-eliciting activity (MEA, e.g., Lesh et al. Citation2000), which will be discussed in greater depth later.
When the number of MEAs was reduced to just one (the rationale is discussed in the next section), the CATALST team began to explore how a change in course organization might help communicate main ideas to students. In particular, we hypothesized that in our semester-long system, shorter units with just one main focus might help students navigate the most important course topics.
Meanwhile, Fry (Citation2017) created and administered a short five-lesson unit about study design and scope of inferences based on previous research documenting student difficulties reasoning about these topics (e.g., Derry et al. Citation2000; Tintle et al. Citation2012). When assessment results suggested the short unit was helpful for student understanding, the CATALST team was motivated to continue using it. We broke Unit 2 into two separate shorter units: one that introduced two-group comparison, followed by Fry’s unit that addressed issues of study design. To keep the units about the same length, our team also broke up Unit 1 to separate Monte Carlo simulation from simulation-based hypothesis testing. We finished with five shorter units rather than three large units. A summary of the old and new organization into units is given in .
Table 1 Summary of units in the old and new versions of the CATALST curriculum.
It was natural to continue to assess student learning at the end of each of the units, but with two additional units in the curriculum the assessments arrived sooner and more often. The assessments provided much-needed feedback to students (who often received a wake-up call from their scores and comments) and instructors (who learned about the topics students struggled to understand), helping us make changes designed to support students who might otherwise have fallen behind too far to recover.
3.2 Trimmed Curriculum: Removing All But One MEA
The original plan for CATALST was to start each unit with an MEA (e.g., Lesh et al. Citation2000). MEAs are open-ended problems that encourage students to create models that answer complex, real-world questions. In CATALST, the MEAs were used to “plow the field” for the unit (Schwartz, Sears, and Chang Citation2007); that is, to informally get students thinking about a theme that would be developed over the course of several lessons and assignments in the unit. Each MEA took about one day (65 min) to complete.
For many years the CATALST curriculum had only two MEAs: the iPod Shuffle MEA (see Ziegler and Garfield Citation2013) and the Comparing Airlines MEA (see Horton, Baumer, and Wickham Citation2015). These MEAs were used as introductions to Units 1 and 2, respectively. Later in each unit, homework assignments revisited each MEA problem; students could use what they had learned in the unit to find a more expert-like solution to the same problem. For example, at the beginning of Unit 2 students created a numerical measure for comparing two airlines’ on-time arrival performance. This challenged students to think about whether differences were likely due to random chance. At the end of the unit students revisited the airline problem by using technology to perform randomization tests for the difference in average arrival time for several cities.
The Comparing Airlines MEA has since been cut from the curriculum, as was the corresponding Comparing Airlines Revisited homework assignment. The homework assignment was the first to go (instead offered as a suggested review exercise) because it did not appear to add anything helpful to students at either end of the spectrum: students who struggled with the material did not find it useful, and students who understood the material found it redundant. The associated Comparing Airlines MEA was later also dropped from Unit 2 because more time was needed in Unit 2 to introduce randomization tests. We extended our one-day activity introducing randomization tests into two days so students could conduct a physical simulation with note cards randomizing two groups. This change allowed us to emphasize the underlying assumptions of a randomization test, giving students a chance to really explore what they were doing with the physical simulation before conducting the simulation conducted using TinkerPlots software (Hancock and Rummerfield Citation2020). This change is aligned with many other cuts in the curriculum; topics have been trimmed as we have discovered other topics need more time to reach the depth intended in the original curriculum.
The CATALST team at the UMN is still enthusiastic about MEAs. In particular, the iPod Shuffle activity continues to be used to kick off the course as an in-depth model-eliciting activity. This MEA is an excellent way to introduce and revisit key ideas of the course throughout the semester: random behavior, uncertainty, making decisions about a model, and Type I and Type II errors. As we continue to build upon key ideas, there are many opportunities throughout the curriculum to refer back to the iPod Shuffle MEA. For example, when discussing issues with hypothesis testing, we can relate the possibility of Type I error to incorrectly declaring a shuffle playlist as nonrandom. When making a decision about a model, we can relate to the fact that different metrics can result in different conclusions, just as students’ different criteria for flagging nonrandom iPod playlists ended up with different conclusions.
3.3 Emphasis on Themes: Variation and Uncertainty
Another change in the curriculum is a renewed effort to make explicit central themes of the course: variation and uncertainty. This has been primarily embodied by delaying the concept of p-value so students can focus on variation in distributions. Previously, we led students into calculating p-values without stopping to examine the variability in their simulation results. Assessment data suggested students struggled to notice the effect of the variability, and consequently sample size, on p-values (see Section 3.6).
Our new approach is related to ideas of critical values. When students finish running their Monte Carlo simulations, initially we ask them to identify “a range of typical values that one might reasonably expect under this model.” Here, students must implicitly assess the variability of their simulation results. Then, using their identified ranges, the students informally determine the viability of a hypothesized (or null) model by whether an observed result from data falls within their selected range. The p-value is presented several lessons later as an alternate approach to evaluating the null model. We have noticed that delaying the p-value calculation seems to help students pay more attention to the variability in their simulation results.
There was a ripple effect after we placed more emphasis on the idea of the “range of typical values.” Some students became frustrated by how their idea of “typical” did not match that of their peers. This tension set the stage for a discussion of the standard deviation as a tool for determining what qualifies as typical deviation of results from the mean. Eventually, instructors suggest that statisticians may consider an appropriate “range of typical values” to extend to roughly two standard deviations above and below the mean. The topic of standard deviation, which was previously reserved for much later in the original curriculum, has been promoted to earlier in the course to give students the tools and language to evaluate models in a more formal way. This promotion of the standard deviation is representative of how we made variation a more explicit focus of the course; we introduce it earlier and refer to it more often. However, we are mindful that this could, if misused, become just another procedure and may require further adjustment.
3.4 Scaffolding Reduction: Let Students “Tinker”
In original versions of the CATALST curriculum, TinkerPlots operations were primarily introduced via step-by-step instructions. Using this method, the CATALST team noticed students were hesitant to “tinker” with their models or branch out to use new devices that would appropriately provide the same results; students wanted to follow the step-by-step instructions. This inspired the teaching team to take away these “recipes.”
We start with a homework assignment inviting students to watch TinkerPlots Help menu videos that show examples of what the program can do. These videos expose students to several sampling devices, many of which can be adjusted to effectively do the same thing. We also invite students to work through the TinkerPlots
tutorial called TinkerPlots Basics, which is also available via the TinkerPlots
Help menu. The preamble to this assignment is given in Appendix A in the supplementary materials. The assignment that follows does not specify many of the steps students need to use to create the necessary visualizations.
To supplement the built-in TinkerPlots resources and to build up students’ understanding of the software, an activity was created to introduce the concept of linked samplers. This activity, called the Cat Factory Activity, is based upon yet another TinkerPlots
built-in resource. The resource provides an example model of cats being created as if in a “cat factory” where cat attributes are randomly assigned to cats. offers an example of a cat factory that randomly assigns names, eye color, and ages to cats. The activity walks students through the different types of samplers available and the different types of relationships between samplers (dependent, independent sampling).
Fig. 2 Example “Cat Factory” sampler in TinkerPlots software.
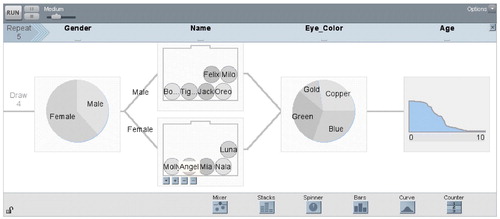
We added this activity for two reasons: (1) students do more “tinkering” with TinkerPlots; and (2) students can see how variables that are assigned independently have a single horizontal bar between the samplers, while dependent variables are illustrated by branching. In the example in , Name is dependent on Gender (hence, the branching bars from the Gender spinner to the Name mixer), but Eye_Color and Age are assigned independently of other variables (hence, the gathering of the branches from the Name mixer to the Eye_Color spinner and the single horizontal bar from the Eye_Color spinner to the Age mixer). We hope this activity helps students understand the relationships between variable assignments, in particular how a horizontal bar (with no branching) represents independence (used in randomization tests) and branching represents dependence (used for bootstrapping to estimate the standard error of an effect size).
After the cat factory exercise, we invite students to use samplers to model different random phenomena. The sampler to be used is not specified.
The rest of the curriculum continues the trend of not specifying the device students should use. For example, the second homework assignment reads:
In 2015 a typical player in the WNBA made 52 free throw attempts and was a 75.4% free throw shooter. In other words, of the 52 free throws attempted during the 2015 season, the typical WNBA player made 75.4% of the free throw attempts, and missed 24.6% of those attempts. The percentage of free throws that were made is referred to as the player’s “free throw percentage.”
Use TinkerPlots to set up a sampler based on a typical WNBA player—assume this player makes 52 free throw attempts and has a free throw percentage of 75.4%.
Students have many options and must critically evaluate their choice, perhaps “tinkering” with it until it is appropriate. Students who use a “spinner” (, right) may find it easier to achieve the desired free throw percentage than students who use the “mixer” (, left). Different students may come up with several isomorphic models that achieve the same goal. In large-group discussions, students have the opportunity to consider and evaluate whether their peers’ models are appropriate. Moreover, it seems this comparison helps students identify the essential features of an appropriate model and, at the same time, begin to realize features that are insignificant. This change is one example of how we incorporate more critical thinking in the homework assignments (by prescribing less and requiring students to be the judge of whether their model is appropriate).
With these early TinkerPlots experiences in the curriculum, we experimented with removing much of the technology instruction provided in the margins in the original versions of the curriculum. With this scaffolding gone, we noticed students appeared more apt to create interesting and innovative models for a given situation, as well as to critique models that were proposed. This diversity of models prompted rich classroom discussions about the essential components of an appropriate model. This was important for the CATALST course because one of the goals was to help students learn to “cook” rather than simply “follow recipes.” Removing the TinkerPlots
scaffolding was akin to removing the recipes; without the recipes, students began to try cooking on their own.
3.5 Assessing Students: Homework Assignments and Exams
We have tried many different approaches to the number and form of student assessments in the CATALST course. The three main types of assessment that historically have been used are homework assignments, individual exams, and group exams. This section will discuss what each of these tend to look like and how their role has changed over time.
3.5.1 Homework Assignments
The homework assignments typically contain about 15 questions regarding one scientific study. Often times, the homework assignment is very similar to the activity that preceded it in the course; this time students complete it on their own instead of in class with their peers and instructor there to provide support. Homework assignments also tend to ask more interpretation questions to help students develop reasoning for their processes and decisions. Each assignment begins with the study’s research question and describes the process used to collect data. The students are asked to answer questions regarding their suspicions about variable relationships, interpret steps as they conduct simulations, and draw conclusions and inferences based on their results and study design.
The number of homework assignments used each semester has decreased over time, from 15 assigned in 2012 down to only nine assignments five years later. Primarily, the reduction in homework assignments was motivated by limited resources and time for grading. In prior semesters when the CATALST grant was funded, we were able to hire and train teaching assistants to help grade assessments. However, with the end of the grant and other budget constraints in our department, we had limited access to qualified graduate teaching assistants and we needed to reduce the grading load.
Most of the assignments that were eliminated were merely “more practice” type of problems, and we felt these assignments did not contribute much to students’ learning. For example, the aforementioned Comparing Airlines Revisited homework required students to run several randomization tests, something they had already experienced many times in other homework assignments. We realized these could be included as optional practice recommendations or as part of exam review instead of assigning it formally.
Instead, we focused on homework assignments that furthered the goal of promoting statistical thinking. For example, before p-values are introduced, one assignment prompts students to conduct a simulation to create results under the assumption of the null hypothesis. Then the assignment asks students to describe the variation in the simulated results by describing the range where most of the simulated results can be found. More specifically, students are asked to fill in three blanks in the following:
Under the hypothesized model, ___% of the simulated results are between ___ and ___.
Based on their answer, students are prompted to make a decision as to whether the observed result of the study is likely or unlikely under the hypothesized model, and to explain their reasoning. Here, students are not following prescribed procedures, but rather making a judgment based on their ideas of what is typically expected under the hypothesized model. The answers are evaluated primarily on whether their responses are reasonable (i.e., the range of “typical” values is within the range of all simulated values) and consistent (i.e., their judgment on the observed result is consistent with whether the observed result is within the range of typical values given in the previous problem).
3.5.2 Exams
Historically, the course has made use of individual exams and group exams. None of the questions on the individual exams involved using technology to analyze data because we could not provide computers with TinkerPlots for students who did not own laptop computers. Consequently, the individual exam questions would often involve critiquing and interpreting samplers or output. Problems requiring technology were reserved for group exams, where we could easily assume at least one group member would be able to bring a laptop to class.
Groups are assigned by the instructor, and each group turns in just one copy to be graded. On the group exams, each student took one or more turns being assigned a “recorder role.” The recorder was responsible for helping the group come to consensus before recording the group’s answer. The exam prompted students to alternate serving as the recorder so as to encourage positive interdependence, promote individual accountability, and to prevent a single student from dominating the group’s solutions (see, e.g., Johnson and Johnson Citation1989, Citation1999).
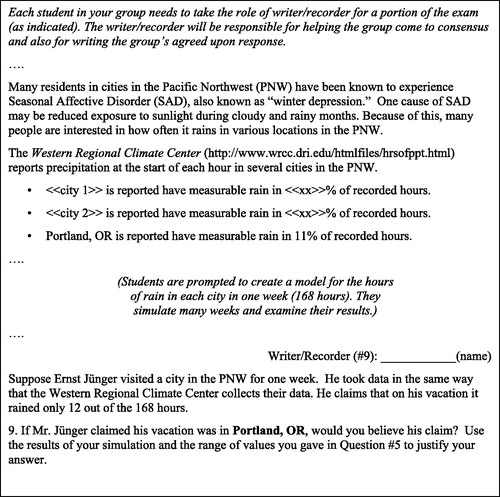
The group exams had two primary purposes. First, group exams are aligned with our desire to use assessment for learning, rather than just assessment of learning (see Garfield et al. Citation2011). In other words, we see evidence that many students refine their understanding during the group exams. For example, while proctoring the group exams, we overhear rich and spirited conversations; students explain concepts to each other, argue about ideas, and answer each other’s questions with a higher sense of rigor and interest than in regular activities. Second, group exams are designed to push students beyond what has been covered in class. Many of our group exams include far-transfer concepts or lead students to explore new concepts that we will build upon in the next class sessions. In this sense, the group exams are helping to serve the purpose that the MEAs once played of “plowing the field” to prepare for upcoming concepts. An excerpt from a group exam is given in . In this exam, prior to any formal introduction to hypothesis testing, the exam prompts students to conduct a few Monte Carlo simulations based on three different models. For each model, students are asked to use their simulated results to identify a range of typical values that one might reasonably expect according to each model. Then students are presented with mystery data and must conclude which models (if any) are plausible given the observed mystery data. This “plows the field” because students are evaluating models before they have seen any hypothesis testing in class, and they certainly have not been given any formal procedures for doing so.
Fig. 3 Excerpts from an example group exam.
When time constraints and the aforementioned organizational overhaul pushed us to reduce the number of class sessions spent on assessments, we opted to keep group exams and omit the individual exams entirely. We felt it was worth sacrificing individual exams in exchange for the rich discussions and opportunities for student learning afforded by the group exams.
3.6 Assessing the Curriculum: GOALS and REALI Instruments
As with any good curriculum, the CATALST team has been using assessments to evaluate various aspects of the curriculum and inform many of our decisions. The story of assessment of the CATALST curriculum begins with the Goals and Outcomes Associated with Learning Statistics (GOALS) instrument, which was developed as a part of the grant that birthed CATALST. Many items from GOALS were borrowed and adapted from the more well-known Comprehensive Assessment of Outcomes in Statistics (CAOS) instrument (delMas et al. Citation2007). In contrast to CAOS, GOALS was designed to have two versions (a traditional and a simulation-based version), witgh the intent to use the two versions to evaluate and compare different introductory statistics curricula. Despite much hard work, the GOALS team found it difficult to develop two assessments that were comparable, and the traditional version of the instrument was eventually dropped.
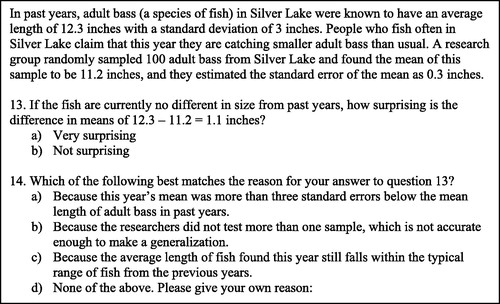
Many of the aforementioned changes in the curriculum have been motivated—at least in part—by results of assessments such as GOALS. For example, in the spring of 2012, on Items 13 and 14 in , only about 18% of the students recognized the difference in sample means of 1.1 was a surprising result given the standard error of 0.3 (Sabbag and Zieffler Citation2015). This result suggested students were not able to make connections about their understanding of p-values and the standard error as a measure of how much the sample mean is expected to vary from sample to sample. Since that time, we have placed a greater emphasis on variation and uncertainty (described in Section 3.3), and it remains to be explored whether this deficiency in student understanding has improved since the changes described in Section 3.3.
Fig. 4 Items 13 and 14 from the GOALS assessment.
Although much of the information gathered from the GOALS instrument was useful, its usefulness was limited when further analysis revealed that creating a psychometrically sound GOALS assessment was extremely challenging—despite many revisions (e.g., Sabbag and Zieffler Citation2015). However, not all was lost; many items from GOALS served as the foundation for another helpful instrument: the REAsoning and Literacy Instrument (REALI, Sabbag, Garfield, and Zieffler Citation2018), which was designed to measure statistical literacy and statistical reasoning.
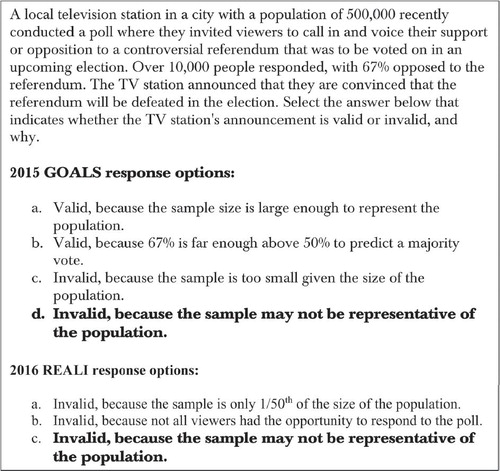
Some items on the REALI assessment remain similar to their “parent” items in GOALS. shows how an item from GOALS was modified for the REALI assessment based on feedback from a panel of statistics education experts. To increase item difficulty, the wording of option C was modified. Also, think-aloud interviews suggested that students were not even considering options A and B, so these were discarded in favor of a new option that better represented common student misconceptions. In 2015, 63% of CATALST students answered the item correctly on the GOALS assessment. In 2016, 94% answered the revised item correctly on the REALI assessment. Though this may indicate an increase, we do not hold this comparison appropriate because the item changed.
Fig. 5 Example of an item that was adapted from GOALS to the REALI assessment.
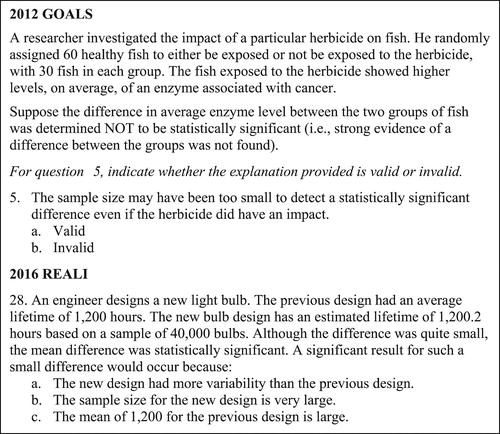
Another example of an item from the GOALS assessment that helped shape the REALI is given in . Psychometric analyses indicated that Item 5 from GOALS did not perform well among top students, so a new item was developed and used for the REALI assessment (, Item 27). In 2016, about 65% of CATALST students were able to identify that the very large sample size led to statistically significant results. This seems like an improvement compared to students’ performance in 2012, but again, conclusions should be taken with great caution as these items are not appropriate to be used for strong comparisons, even though they both involve issues of statistical power.
Fig. 6 Item 5 from the GOALS and Item 28 from REALI.
The challenge of assessing the CATALST curriculum has proven to be very difficult. To date, there have not been any new instruments developed to assess the curriculum for broader research purposes; the most recent data collection was in 2016 (described in Sabbag, Garfield, and Zieffler (Citation2018)). Steps have been taken to try to develop assessments that hone in on more specific aspects of introductory statistics curricula (e.g., statistical literacy, Ziegler and Garfield Citation2018; transfer of concepts to novel situations, Beckman Citation2015; statistical reasoning and literacy, Sabbag, Garfield, and Zieffler Citation2018; and statistical thinking, Le Citation2017). These more specific assessments may aid us in an assessment endeavor that can, in turn, help further evaluate the curriculum and make adjustments.
4 New Audiences for the CATALST Curriculum
The CATALST curriculum currently serves many different audiences. At the UMN, it is the curriculum used in the College of Educational Psychology’s introductory statistics course taken by nursing, child psychology, and other liberal arts majors. At our collaborator institutions, variations of CATALST are used for other audiences including preservice teachers (e.g., Noll and Kirin 2015) and calculus-based statistical theory students (e.g., Green and Blankenship Citation2015). In addition to these student groups, we have recently found three other audiences for which the curriculum appears to be appropriate.
4.1 CATALST for High School Students
In the UMN’s College in the Schools (CIS) Statistics program, high school students are able to take the CATALST course in their high schools while earning both high school and college credit. CIS Statistics courses (which are taught by a select group of high school teachers) serve as an alternative to the Advanced Placement (AP) program (CitationRossman, St. Laurent, and Tabor 2015); achievement is not dependent entirely on one high-stakes test at the end of the year. Rather, college credit is awarded upon successful completion of the assigned course work and group exams. This is not the first time selected CATALST materials were used in high schools; however, after being piloted in one high school (see Zieffler and Huberty Citation2015), it has, for the first time, been used in several high schools in its entirety and in a concurrent-enrollment program (i.e., where students can simultaneously earn high school and college credit).
As part of the program, members of our UMN CATALST teaching team conducted classroom observations of each of our participating high schools. While visiting, we were pleased to see high school students engaging in excellent statistical thinking and reasoning discourse. We observed students engaging with the content and the learning process in ways similar to our college sections of the course (e.g., describing the p-value’s true meaning to one another, helping each other tinker with the software, and critiquing each other’s models and conclusions).
4.2 CATALST for In-Service Teachers
In the aforementioned CIS Statistics program, many participating high-school teachers have little or no prior experience with simulation-based methods for teaching statistical inference. We rely heavily on the CATALST curriculum itself for introducing these teachers to the necessary content. The CIS program includes five days of professional development throughout the academic year to help the teachers build content and pedagogical knowledge for teaching the course. However, five days (plus one site visit, as mentioned above) is certainly not enough time to introduce the high school instructors to all the content offered in the course.
To further support the high school teachers’ acquisition of the content, we set up a Google-group by which E-mails can be sent to the entire cohort of participating teachers, and teachers can reply to one another with guidance (occasional correction made by the UMN CATALST teaching team chiming in if discussions go astray). Some of our superstar CIS high-school teachers initiated meet-ups with each other to discuss concepts and ask questions about correct solutions to the activities. Aside from these additional resources and professional development opportunities, we rely heavily on the curriculum itself to deliver the course content to these teachers.
A recent study of participating teachers’ understanding of statistical models provided evidence that experiences with the curriculum and TinkerPlots software helped the teachers develop their content knowledge of randomization tests and the overall core logic of inference. Justice et al. (Citation2017) summarized the results of the interviews with a sample of four teachers in the program:
Participants were generally very adept in many areas of near-transfer tasks. They displayed very little trouble recognizing a randomization test context for two groups and using the software to create a sampler to model a no-difference in means model (p. 143).
Teachers also appeared to have mastered the software:
…teachers displayed fluency with using the TinkerPlots software to model the hypothesis of “no mean differences”… All the participants were able to explain the theoretical rationale behind the randomization test for comparing two groups (p. 143).
One participant in the study explicitly stated how the use of the TinkerPlots software helped him understand assumptions about statistical models that he accepted (but did not fully understand) when learning about t-tests in college. The interviewer asked him why a t-test was appropriate, and he responded,
….Why? Because that’s what someone told me when I was in college and that was—and I accepted it. And that’s why I love this (pointing to TinkerPlots screen on computer) part of it because it, that makes that question much more understandable (Justice et al. Citation2017, supplementary transcript).
This is one of many examples where teachers express how the curriculum and software helped in-service teachers make sense of concepts that they had not understood as well from their other statistical training, which is often sparse. With ample support, these in-service teachers were able to learn more about statistical modeling techniques by teaching the curriculum in their own classrooms. It is worth exploring whether the CATALST curriculum can help other in-service secondary teachers of statistics begin to develop the content knowledge they need to be effective teachers of statistics, perhaps coming closer to the recommendations for the statistical education of teachers as outlined by the ASA-endorsed Statistical Education of Teachers document (SET, Franklin et al. Citation2015).
4.3 CATALST for Graduate Student Instructors and Assistants
Another audience we see benefitting from the CATALST curriculum is graduate students who teach or assist with the teaching of introductory statistics. A 2013 Conference Board on Mathematical Sciences study suggested that graduate students are responsible for teaching roughly 25% of introductory statistics courses in the United States (Blair, Kirkman, and Maxwell Citation2013). There is evidence that these graduate students often do not enter their programs with the content knowledge needed for teaching simulation-based statistical inference (e.g., Noll Citation2011). For example, in a survey of graduate students representing 38 Ph.D.-granting institutions in the United States, Justice, Zieffler, and Garfield (Citation2017) found that over half of survey participants had not learned about nontraditional course content such as big data and randomization methods. Noll (Citation2011), after surveying and interviewing graduate students from 18 institutions across the United States, recommended that graduate students experience simulation methods to complement their understanding of theoretical principles in the discipline. The CATALST curriculum can provide such experience.
At the UMN, graduate students in the Statistics Education Program are often funded via teaching assistantships, and many teach the CATALST course. As with the graduate students in Noll’s (Citation2011) study, upon entry into our program, many graduate students have not developed expertise with simulation approaches to statistical modeling. By teaching and assisting with the CATALST curriculum, graduate students have the opportunity to view statistical principles from simulation—rather than theoretical—approaches.
The model we use for developing graduate students into graduate instructors of record is a communities of practice approach (Lave and Wenger Citation1991), which at the surface means that experts and novices meet together weekly to discuss the practice of teaching simulation-based inference. The community meets to discuss content and pedagogical content knowledge, develop assessments, make decisions regarding grades, and sort through other issues regarding the course. During these meetings, graduate students can ask questions that surface in their interactions with students and refine their prior conceptions about course content. Also aligned with Lave and Wenger’s model for communities of practice, we assign graduate students with progressively increasing responsibilities—first grading assessments, then perhaps writing some assessment questions, teaching one section of the course after gaining some experience as an assistant, and finally designing lesson plans or helping with revisions of the curriculum itself. The CATALST curriculum provides experiences with simulation-based statistical inference, which can complement their experiences with traditional methods.
5 Future Research and Conclusions
The story of the CATALST curriculum is ever changing. In this article, we provided an overview of some aspects of what the UMN CATALST teaching team has kept the same and what we have changed. We hope that sharing our experiences with the statistics education community can help others who may use the curriculum, whether by inspiring changes of their own or by helping to anticipate the impacts of those changes.
There is certainly still a lot of work to do. First, we would like to collect data to help us discern the extent to which the described changes in the curriculum appear to have a positive effect on student learning beyond our theories and anecdotal evidence. For example, when Fry (Citation2017) gave a pretest and posttest at each end of the two-and-a-half week unit on study design, she found that overall, the great majority of students improved in their ability to make connections between random sampling and generalization to a population, and between random assignment and causation. However, upon analysis of a few items, it was evident that a small, but noticeable, portion of students continued to demonstrate misunderstandings, such as lingering confusion between the purposes of random sampling and random assignment. These results imply students need plenty of experience exploring the implications of random sampling or random assignment of treatments to groups, and these experiences still need to be developed and assessed.
The role of TinkerPlots software is also an area of interest for the future. About the time this manuscript was completed, the new CATALST team was working to write adaptations of the activities that can use the Common Online Data Analysis Program (CODAP) software, a free web-based tool that does not rely on compatibility with specific computer operating systems. There are many differences between CODAP and TinkerPlots
, such as the flexibility with designing and observing samplers in-action. The changes will require attention and evaluation: what is lost or gained with the transition? What might we advocate to be added to CODAP to enhance student learning?
We also hope to continue to explore how CATALST can play a role in teacher professional development and the types of professional support that are needed for teachers to prepare for teaching the CATALST curriculum. Preliminary results suggest that the CATALST curriculum can help facilitate a large body of content knowledge but there are particular propensities for teachers to miss the main mark of the purpose of statistical modeling, namely to model the variation in a data generating process (Justice et al. Citation2018). We would like to continue to collect data to learn how we can help teachers hone in on the most appropriate focus for their models.
With the recent recommendations from the American Statistical Association to avoid statistical significance all together (see The American Statistician, Volume 23, 2019), there is further potential to revisit the areas where significance is included. However, the focus of the curriculum is on statistical modeling—not a set of procedures for declaring significance—and as such the ASA’s recommendations do not in of themselves necessarily call for a major revamp of the curriculum.
We have taken away many lessons learned from our experiences with the CATALST curriculum. As we have moved on to other courses in other curricula, we have been able to adapt CATALST activities to suit different audiences. We also have learned from the CATALST strategy of creating a homework assignment or activity around one central research question, going deep into that question rather than introducing several questions with unrelated contexts. Perhaps most importantly, we have taken experiences from working collaboratively with others to try new teaching strategies, observe how students respond to them, and propose revisions. The continuous collaborative critique and modification of the curriculum reminds us of an ongoing Japanese Lesson Study-type approach (e.g., Roback et al. Citation2006), where we worked together to develop activities and strategies that might better facilitate student learning.
We hope for and encourage new partners and departments to work with the CATALST curriculum. The course readings are available free online at the course website https://zief0002.github.io/statistical-thinking/). Anyone interested in obtaining course activities and group exams may contact the first author at [email protected]. The full activities and assessments for the five-lesson unit about study design and scope of inferences can be viewed in a public Google Drive folder: z.umn.edu/studydesign/.
Supplementary Materials
Appendix A offers the preamble to the first homework assignment, which directs students to videos and tutorials in the TinkerPlots Help Menus. Appendix B provides the Cat Factory Activity, which was adapted from TinkerPlots
resources into an in-class activity designed to help familiarize students with the software.
Supplemental Material
Download Zip (4.6 MB)Acknowledgments
Special thanks to Christine Nicolai (Pacific Lutheran University) for her proofreading and writing suggestions. We would also like to thank additional University of Minnesota Statistics Education CATALST team members Ethan Brown, Jonathan Brown, Robert delMas, Michael Huberty, Suzanne Loch, and of course Andrew Zieffler, for their contributions to the work described in this article.
Funding
The CATALST curriculum and GOALS assessment were developed with support from the National Science Foundation (Collaborative Research: The CATALST Project, Change Agents for Teaching and Learning Statistics, DUE-0814433).
ORCID
Nicola Justice https://orcid.org/0000-0002-0356-3509 Anelise Sabbag https://orcid.org/0000-0001-9287-3981 Elizabeth Fry https://orcid.org/0000-0001-8349-1578 Laura Ziegler https://orcid.org/0000-0003-3921-2580
References
- Beckman, M. (2015), “Assessment of Cognitive Transfer Outcomes for Students of Introductory Statistics,” Ph.D. dissertation, University of Minnesota, available at http://iase-web.org/Publications.php.
- Ben-Zvi, D., and Garfield, J. B. (2004), “Statistical Literacy, Reasoning, and Thinking: Goals, Definitions, and Challenges,” in The Challenge of Developing Statistical Literacy, Reasoning and Thinking, Dordrecht: Springer, pp. 3–15.
- Blair, R., Kirkman, E., and Maxwell, J. (2013), Statistical Abstract of Undergraduate Programs in the Mathematical Sciences in the United States: Fall 2010 CBMS Survey, Washington, DC: American Mathematical Society.
- Chance, B., Ben-Zvi, D., Garfield, J., and Medina, E. (2007), “The Role of Technology in Improving Student Learning of Statistics,” Technology Innovations in Statistics Education, 1, available at https://escholarship.org/uc/item/8sd2t4rr.
- Cobb, G. W. (2007), “The Introductory Statistics Course: A Ptolemaic Curriculum?,” Technology Innovations in Statistics Education, 1, available at https://escholarship.org/uc/item/6hb3k0nz.
- Cobb, P., and McClain, K. (2004), “Principles of Instructional Design for Supporting the Development of Students’ Statistical Reasoning,” in The Challenge of Developing Statistical Literacy, Reasoning, and Thinking, eds. D. Ben-Zvi and J. Garfield, Dordrecht: Kluwer Academic Publishers, pp. 375–395.
- delMas, R., Garfield, J., Ooms, A., and Chance, B. (2007), “Assessing Students’ Conceptual Understanding After a First Course in Statistics,” Statistics Education Research Journal, 6, 28–58, available at https://iase-web.org/documents/SERJ/SERJ6(2)_delMas.pdf.
- Derry, S. J., Levin, J. R., Osana, H. P., Jones, M. S., and Peterson, M. (2000), “Fostering Students’ Statistical and Scientific Thinking: Lessons Learned From an Innovative College Course,” American Educational Research Journal, 37, 747–773, DOI: 10.3102/00028312037003747.
- Franklin, C., Bargagliotti, A., Case, C., Kader, G., Scheaffer, R., and Spangler, D. (2015), Statistical Education of Teachers, Alexandria, VA: American Statistical Association, available at http://www.amstat.org/education/SET/SET.pdf.
- Fry, E. B. (2017), “Introductory Statistics Students’ Conceptual Understanding of Study Design and Conclusions,” Ph.D. dissertation, University of Minnesota, available at http://iase-web.org/Publications.php.
- Garfield, J., delMas, R., and Zieffler, A. (2012), “Developing Statistical Modelers and Thinkers in an Introductory, Tertiary-Level Statistics Course,” ZDM, 44, 883–898, DOI: 10.1007/s11858-012-0447-5.
- Garfield, J., Zieffler, A., Kaplan, D., Cobb, G. W., Chance, B. L., and Holcomb, J. P. (2011), “Rethinking Assessment of Student Learning in Statistics Courses,” The American Statistician, 65, 1–10, DOI: 10.1198/tast.2011.08241.
- Green, J. L., and Blankenship, E. E. (2015), “Fostering Conceptual Understanding in Mathematical Statistics,” The American Statistician, 69, 315–325, DOI: 10.1080/00031305.2015.1069759.
- Hancock, S., and Rummerfield, W. (2020), “Simulation Methods for Teaching Sampling Distributions: Should Hands-On Activities Precede the Computer?,” Journal of Statistics Education, 28, 9–17, DOI: 10.1080/10691898.2020.1720551.
- Horton, N. J., Baumer, B. S., and Wickham, H. (2015), “Taking a Chance in the Classroom: Setting the Stage for Data Science: Integration of Data Management Skills in Introductory and Second Courses in Statistics,” CHANCE, 28, 40–50, DOI: 10.1080/09332480.2015.1042739.
- Johnson, D. W., and Johnson, R. T. (1989), Cooperation and Competition: Theory and Research, Edina, MN: Interaction Book Co.
- Johnson, D. W., and Johnson, R. T. (1999), “Making Cooperative Learning Work,” Theory Into Practice, 38, 67–73.
- Justice, N., Huberty, M. D., Zieffler, A., and delMas, B. (2017), “Secondary Teachers’ Reasoning About Statistical Models,” Invited paper presented at the Tenth International Collaboration for Research on Statistical Reasoning, Thinking, and Literacy: Innovations in Statistical Modelling to Connect Data, Chance and Context, Rotorua, New Zealand, pp. 135–156.
- Justice, N., Zieffler, A., and Garfield, J. (2017), “Statistics Graduate Students’ Preparation for Teaching Statistics,” Statistics Education Research Journal, 16, available at https://iase-web.org/documents/SERJ/SERJ16(1)_Justice.pdf.
- Justice, N., Zieffler, A., Huberty, M. D., and delMas, R. (2018), “Every Rose Has Its Thorn: Secondary Teachers’ Reasoning About Statistical Models,” ZDM, 50, 1253–1265, DOI: 10.1007/s11858-018-0953-1.
- Kember, D. (1997), “A Reconceptualisation of the Research Into University Academics’ Conceptions of Teaching,” Learning and Instruction, 7, 255–275, DOI: 10.1016/S0959-4752(96)00028-X.
- Lave, J., and Wenger, E. (1991), Situated Learning: Legitimate Peripheral Participation, Cambridge, England: Cambridge University Press.
- Le, L. (2017), “Assessing the Development of Students’ Statistical Thinking: An Exploratory Study,” Ph.D. dissertation, University of Minnesota, available at http://iase-web.org/Publications.php.
- Lesh, R., Hoover, M., Hole, B., Kelly, A., and Post, T. (2000), “Principles for Developing Thought-Revealing Activities for Students and Teachers,” in Handbook of Research Design in Mathematics and Science Education, eds. A. Kelly and R. Lesh, Mahwah, NJ: Lawrence Erlbaum Associates, Inc., pp. 591–646.
- Lock, R. H., Lock, P. F., Morgan, K. L., Lock, E. F., and Lock, D. F. (2013), Statistics: Unlocking the Power of Data, Hoboken, NJ: Wiley.
- Moore, D. S., McCabe, G. P., and Craig, B. A. (2017), Introduction to the Practice of Statistics New York: W.H. Freeman
- Noll, J. A. (2011), “Graduate Teaching Assistants’ Statistical Content Knowledge of Sampling,” Statistics Education Research Journal, 10, 48–74, available at https://iase-web.org/documents/SERJ/SERJ10(2)_Noll.pdf?1402525003.
- Noll, J. A., and Kirin, D. (2015), “Students’ Emerging Statistical Models Using TinkerPlotsTM,” in Proceedings of SRTL-9: Reasoning About Models and Modelling in the Context of Informal Statistical Inference, eds. D. Ben-Zvi and K. Makar, Paderborn, Germany: University of Paderborn, pp. 24–45.
- Roback, P., Chance, B., Legler, J., and Moore, T. (2006), “Applying Japanese Lesson Study Principles to an Upper-Level Undergraduate Statistics Course,” Journal of Statistics Education, 14, DOI: 10.1080/10691898.2006.11910580.
- Rossman, A. J., St. Laurent, R., and Tabor, J. (2015), “Advanced Placement Statistics: Expanding the Scope of Statistics Education,” The American Statistician, 69, 121–126, DOI: 10.1080/00031305.2015.1033985.
- Sabbag, A. G., Garfield, J., and Zieffler, A. (2018), “Assessing Statistical Literacy and Statistical Reasoning: The REALI Instrument,” Statistics Education Research Journal, 17, 141–160, available at https://iase-web.org/documents/SERJ/SERJ17(2)_Sabbag.pdf.
- Sabbag, A. G., and Zieffler, A. (2015), “Assessing Learning Outcomes: An Analysis of the Goals-2 Instrument,” Statistics Education Research Journal, 14, available at http://iase-web.org/documents/SERJ/SERJ14(2)_Sabbag.pdf.
- Schoenfeld, A. H. (1998), “Making Mathematics and Making Pasta: From Cookbook Procedures to Really Cooking,” in Thinking Practices in Mathematics and Science Learning, eds. J. G. Greeno and S. V. Goldman, Mahwah, NJ: Lawrence Erlbaum, pp. 299–319.
- Schwartz, D. L., Sears, D., and Chang, J. (2007), “Reconsidering Prior Knowledge,” in Thinking With Data, eds. M. C. Lovett and P. Shah, Mahwah, NJ: Erlbaum, pp. 319–344.
- Shaughnessy, J. M. (1977), “Misconceptions of Probability: An Experiment With a Small-Group Activity-Based, Model Building Approach to Introductory Probability at the College Level,” Education Studies in Mathematics, 8, 285–316.
- Tintle, N., Topliff, K., VanderStoep, J., Holmes, V. L., and Swanson, T. (2012), “Retention of Statistical Concepts in a Preliminary Randomization-Based Introductory Statistics Curriculum,” Statistics Education Research Journal, 11, 21–40, available at https://iase-web.org/documents/SERJ/SERJ11(1)_Tintle.pdf.
- Wasserstein, R. L., and Lazar, N. A. (2016), “The ASA’s Statement on p-Values: Context, Process, and Purpose,” The American Statistician, 70, 129–133, DOI: 10.1080/00031305.2016.1154108.
- Watson, J. M. (2008), “Exploring Beginning Inference With Novice Grade 7 Students,” Statistics Education Research Journal, 7, available at https://iase-web.org/documents/SERJ/SERJ7(2)_Watson.pdf?1402525008.
- Zieffler, A., and Catalysts for Change (2017), Statistical Thinking: A Simulation Approach to Uncertainty (4th ed.), Minneapolis, MN: Catalyst Press, available at http://zief0002.github.io/statistical-thinking/.
- Zieffler, A., and Huberty, M. D. (2015), “A Catalyst for Change in the High School Math Curriculum,” CHANCE, 28, 44–49, DOI: 10.1080/09332480.2015.1099365.
- Ziegler, L., and Garfield, J. (2013), “Exploring Students’ Intuitive Ideas of Randomness Using an iPod Shuffle Activity,” Teaching Statistics, 35, 2–7, DOI: 10.1111/j.1467-9639.2012.00531.x.
- Ziegler, L., and Garfield, J. (2018), “Developing a Statistical Literacy Assessment for the Modern Introductory Statistics Course,” Statistics Education Research Journal, 17, 161–178, available at https://iase-web.org/documents/SERJ/SERJ17(2)_Ziegler.pdf.