 ?Mathematical formulae have been encoded as MathML and are displayed in this HTML version using MathJax in order to improve their display. Uncheck the box to turn MathJax off. This feature requires Javascript. Click on a formula to zoom.
Abstract
This article focuses on the unique contribution of the QT-clicker regarding formative and summative assessment in a large flipped first year statistics module. In this module, the flipped classroom as pedagogical model first substituted the traditional teaching model. QT-clickers were subsequently introduced to enable active and cooperative learning for face-to-face engagement inside the classroom. The various input capabilities of the QT-clicker, providing for the possibility of partial grade crediting, offer a distinguishing advantage. These clickers were initially only used for formative assessment, but soon extended to summative assessment. Two cohorts—2014 (no QT-clickers) and 2017 (with QT-clickers)—were compared. The intervention of using QT-clickers was evaluated along two lines: the pedagogical influence of the QT-clicker and the effect of partial grade crediting. Several general linear models (GLMs) were fitted to the data to investigate how QT-clicker use is related to the students’ examination performance. The outcome of the GLM models indicates that the association of higher examination marks with QT-clicker use holds for the 2017 cohort with and without partial credit. A qualitative component of the study reports on the student voice testifying to positive experience.
1 Introduction
Classroom response systems are not new in education and have been used for decades, especially for formative assessment in traditional classrooms (Judson and Sawada Citation2002). The learning advantages of clickers in traditional classrooms are well reported (Mayer et al. Citation2009). However, few studies are available on the use of clickers in flipped classrooms or for formative assessment extended to summative assessment. The purpose of this article is to investigate whether using QT-clickers for formative assessment, as well as for summative assessment, can enrich student learning in a large flipped classroom environment for an introductory statistics course.
A flipped classroom model, resulting in problem-based in-class instruction, was implemented in 2013 for the Introductory Statistics course at an urban South African university. An online homework system was used in combination with the flipped classroom for students to prepare before they came to class and it was found that the students’ examination performance improved. However, this improvement could not necessarily be attributed to the online homework system per se. It is more likely the result of the combination of the flipped classroom and the online homework system embedded in a constructivist foundation (Reyneke et al. Citation2018).
In this article, the introduction of QT-clickers as part of active learning in a flipped classroom environment is investigated. These clickers were used for both formative and summative assessment. A Turning Technology QT-clicker is distinguished from a standard clicker by a full-featured keypad with a variety of input abilities, over and above the basic multiple choice options. It is widely known that multiple choice options may lead to guessing or clever elimination of certain distractors for a question (McKenna Citation2019). With QT-clickers, instead of providing students with a choice of answers, one (or more) of which is correct, students have to calculate answers which they submit via the QT-clicker keypad.
Formative assessment in this study involved individual or group clicker questions in class which formed part of PowerPoint® polling slides. Formative assessment measured students’ understanding of concepts, and combined with the advantages of peer learning and immediate feedback it renders an improved learning model. These formative assessment tasks contribute a small percentage to students’ grades. Formative assessment is also attained in the form of online homework assignments that constitute a larger part of the semester mark (term mark), to encourage students to participate.
The successful implementation of QT-clickers for active learning and formative assessment prompted us to extend the use to summative assessment as well. For the purpose of this study, summative assessment is a formal, graded test or examination paper, written in a controlled environment without peer interaction. The papers were administered by using Turning Technology’s self-paced polling, that is, students could pace themselves by moving forward and backward between the questions using the QT-clicker’s keypad to modify or change their answers. The advantage of a QT-clicker in a self-paced test—over a multiple choice questions (MCQs) test—is that, in addition to the variety of input abilities that allow students to type in, for example, numerical answers or words, partial grade crediting can be done following the assessment. Since the students’ answers are captured on an Excel spreadsheet, the lecturer can readily pick up common mistakes by the frequency of common wrong answers (e.g., students using the variance instead of the standard deviation in a calculation). Partial grade crediting allows the lecturer to award some marks for intermediate steps even though the submitted answer is wrong. This more comprehensive assessment obviously benefits students.
2 Literature Review
The use of electronic voting systems in large lecture modules, especially in science, can be dated to the 1960s (Judson and Sawada Citation2002). Since then, lecturers using such systems have had the same aim, namely active learning and instant feedback, particularly for students in large classes. Technology has evolved rapidly, therefore crude, hard-wired systems of the past paved the way for today’s modern wireless, multi-function alternatives, although the underlying pedagogy has stayed the same in the majority of classes.
A distinct feature of current classroom response systems (clickers) is the ability to display graphic representations of students’ answers in the form of bar charts, which facilitate immediate feedback. The vast majority of formative assessment research on classroom response systems has been done in psychology (Lantz and Stawiski Citation2014), biology (Smith et al. Citation2011), science (Baltaci-Goktalay Citation2016), business subjects (Rana and Dwivedi Citation2016), mathematics (Chen et al. Citation2010), and statistics (Kaplan Citation2011). Only a few nonspecific articles, none in statistics, could be found on summative assessment involving clickers (Kay and LeSage Citation2009; Hancock Citation2010; Han and Finkelstein Citation2013; Wang, Chung, and Yang Citation2014; Premkumar Citation2016). Studies on the use of clickers in flipped classrooms are even more scarce. Only two clicker studies could be traced, one in an English and the other in a statistics flipped classroom (McGee, Stokes, and Nadolsky Citation2016; Hung Citation2017).
Mazur (Citation1997; p. 9–32) implemented peer instruction supported by clickers in the 1990s. Mazur and his team later developed an interactive program, Learning Catalytics (Prensky Citation2011), which then needed a more sophisticated response tool in the form of smart devices, such as smart phones and tablets, to accommodate advanced software. More recently, several articles on the use of smart phones and other internet devices as substitutes for traditional clickers have been published (Dunn et al. Citation2012; Chou, Chang, and Lin Citation2017; Hung Citation2017).
Barnett (Citation2006) divided the advantages of using a classroom response system for formative assessment into three categories, namely interactional, attitudinal, and pedagogical advantages, which are discussed accordingly.
Lasry (Citation2008) argued that using peer instruction and low-technology flash cards versus peer instruction and high-technology clickers provides the same interactional benefit. However, while a lecturer can easily implement flash cards instead of clickers in small classes, with large classes there could be gain from clickers that provide automatic, accurate, anonymous, and immediate feedback (Koppel and Berenson Citation2009).
According to the Guidelines for Assessment and Instruction in Statistics Education, GAISE project (American Statistical Association Citation2016), lecturers should enhance active learning and use the appropriate technology to develop conceptual understanding. Clickers offer a good option, because they can promote active and fun learning instead of students passively listening to a lecturer (Dufresne et al. Citation1996; Wit Citation2003; Sharma et al. Citation2005; Caldwell Citation2007; Hoekstra Citation2008).
Many lecturers initially used clickers to incorporate active learning as a one-way engagement in large classes (Littauer Citation1972; Crews et al. Citation2011). Soon it emerged that students prefer to use clickers with peers to learn from each other and the lecturer, discussing questions and interchanging ideas (Beatty Citation2004; Caldwell Citation2007; Yourstone, Kraye, and Albaum Citation2008; Kay and LeSage Citation2009; Smith et al. Citation2011; Bojinova and Oigara Citation2013).
Another benefit of the use of clickers is that it may help to improve student attitudes.
A student’s attitude toward a subject is of critical importance. Many students have a fear of subjects like mathematics, statistics, and science (Fullerton and Umphrey Citation2001). Positive attitudes when using clickers are observed in physics by Sharma et al. (Citation2005). Barnett (Citation2006) shared a similar experience with science students who described their clicker experience as fun, like playing a game, and convenient. Some students are often negative about the introductory statistics module under discussion, which is a service course with compulsory enrolment. Clickers could change students’ attitudes toward the subject if they start to enjoy learning statistics and think it is useful (Mateo Citation2010; Mocko and Jacobbe Citation2010; Titman and Lancaster Citation2011).
Researchers found that the anonymity of clicker use results in students not having to embarrass themselves in front of their peers, thereby fostering positive attitudes and active participation in class (Draper and Brown Citation2004; Sharma et al. Citation2005; Freeman, Blayney, and Ginns Citation2006; Trees and Jackson Citation2007; Laxman Citation2011).
A study by Amstelveen (Citation2013) confirms that proper clicker use can improve attitudes, which in turn has an influence on class attendance. There is a relationship between class attendance and academic achievement in an introductory statistics course (Wang and Englander Citation2010). In a study by Credé, Roch, and Kieszczynka (Citation2010), it was found that class attendance is a better predictor of grades than any other of the student characteristics, including hours studied and GPA score.
Finally, we turn to the pedagogical advantage. It has been found that metacognition from clicker use has a positive impact on the learning process—learning occurs at a higher level and students can clarify their own misconceptions because of immediate feedback (Dunn et al. Citation2012; Forster Citation2014; Lantz and Stawiski Citation2014) and therefore gain better understanding of content (Barnett Citation2006; Mayer et al. Citation2009; Brady, Seli, and Rosenthal Citation2013). Mayer et al. (Citation2009) suggested that a questioning based teaching model, using clickers, can enhance academic performance and generative learning (constructing meaning) in large classes.
To develop higher order questions that will stimulate students’ critical thinking takes time and effort (Beatty et al. Citation2006). Barnett (Citation2006), Smith et al. (Citation2011), and Büyükkurt, Li, and Cassidy (Citation2012) argued that the use of properly set questions and peer discussion, combined with the lecturer’s explanation, can enhance student learning. Kaplan (Citation2011) used simulations on a calculator and then submitted the results via clickers in a large lecture statistics class to improve the “conceptual understanding of statistical inference.”
Hung (Citation2017) used MCQs in the form of Kahoot! quizzes in his gamified use of smart devices (clickers) called BYOD (bring your own device) in a flipped classroom. Kahoot! is a cloud-based automated response system where students can use any smart device instead of clicker devices. Kahoot! quizzes had a beneficial effect on student learning, that is, the Kahoot group who used smart devices outperformed the non-Kahoot group who used PowerPoint slides and the raising of hands in the post-test. A perception survey was conducted to find out how both groups experienced the flipped learning. The results show that the Kahoot group was consistently more positive than the non-Kahoot group.
McGee, Stokes, and Nadolsky (Citation2016) used clickers for formative assessment and immediate feedback in a large flipped statistics classroom with just-in-time teaching (JITT). Apart from watching videos, reading a chapter before class or active learning in class, students have to complete a short set of online questions before attending the next class. Based on the online answers, the instructor can immediately address and correct misunderstandings in the next class.
It can also be argued that the use of clickers could have a positive influence on achievement. Several studies reported on the influence of clickers on performance and how the experimental group (with clickers) outperformed the control group (without clickers) on the final examination scores (Gauci et al. Citation2009; Kyei-Blankson Citation2009; Mayer et al. Citation2009; Majerich et al. Citation2011).
Instructors have varying conceptions of the difference between formative and summative assessment. According to Kay and LeSage (Citation2009), formative assessment consists of questions and tests without grades and summative assessment consists of formal tests with grades. Han and Finkelstein (Citation2013) described the use of clicker assessment and feedback (CAF) for formative assessment as a measure of understanding course concepts without grades, while summative assessment is similar to formative assessment, but students’ answers are linked to grades. Han and Finkelstein (Citation2013) reported on a large CAF supporting project that was introduced to improve students’ engagement in undergraduate modules. The 74 instructors who participated in the project were categorized as either formative- or summative CAF users. Instructors’ use of CAF for formative assessment was found to be more effective than for summative assessment, based on students’ opinions of engagement and learning.
Hancock (Citation2010) discarded all paper tests and used PowerPoint® polling where clicker questions are integrated into the PowerPoint® lecture or tests for both formative and summative assessment. Tests consisted of a series of PowerPoint® slides with MCQs. Each slide is time limited for all students, depending on the type of problem. The limitation is that students cannot go back to a specific question on a previous slide. Wang, Chung, and Yang (Citation2014) also used a set of MCQs for summative assessment at the end of each unit. A compatible clicker software program, Examination View, was used to build questions of different difficulty level for the summative assessment tests. Premkumar (Citation2016) used self-paced polling of TurningPoint® technology for a complete MCQ paper, substituting the scannable answer sheet for clicker answers. No reports on studies could be found on using self-paced polling and written papers where students could have the benefit of revising and changing answers on a clicker, by typing in answers instead of simply selecting an MCQ option, and be advantaged by partial grade crediting.
3 Theoretical Framework
Constructivism is the theoretical underpinning of the flipped classroom and the use of QT-clickers in class. The leading theorist among cognitive constructivists is Jean Piaget. Lev Vygotsky can be considered the main social constructivist while Jerome Bruner combines the cognitive and social constructivism theory (Lutz and Huitt Citation2004). Piaget perceives a child as an independent being who should acquire knowledge through self-discovery. Vygotsky observes a child as a “social being and cognitive development is led by social interactions.” Cognitive development can be accelerated if the right scaffolding provided by an educated person is used within the zone of proximal development. The “zone of proximal development is the distance between the actual development level and the potential development level” (Vygotsky Citation1978), for example, in tertiary education, it denotes the difference between what a student can achieve with and without the help of an expert lecturer or peer. Bruner was strongly influenced by Vygotsky’s theory of social constructivism. He also believes that learning new concepts is influenced by active learning with the assistance of an educator. Bruner differs from Piaget by arguing that cognitive development should be seen as a continuous process instead of being categorized into separate stages.
The three constructivists mentioned above provided an important basis to this study. In our study, the out-of-class activities are scheduled as individual activities. Piaget’s cognitive development theory influenced the design of this study’s out-of-class activities of the students. Students are expected to use self-directed learning to explore and construct statistical concepts to build prior knowledge. Relationships have been found between the prior knowledge and performance in statistics courses (Schutz et al. Citation1998). Our in-class activities are inspired by Vygotski and Bruner’s social constructivism. Students are engaged in various active learning activities in class, with QT-clickers playing a fundamental role. The large lecture groups seem contradictory to social constructivism perspectives at face value, but students form small informal groups for peer discussion before they submit their answers to QT-clicker questions in class. The immediate feedback helps students to clarify their misconceptions (Dunn et al. Citation2012) and integrate it with their prior knowledge (Bransford, Brown, and Cocking Citation2000; p. 10). It is a continual scaffolding process, building on prior knowledge in a student-centered environment where a higher level of potential learning can be attained (Hannafin and Land Citation2000). The lecturer helps students to engage in active learning through the use of scaffolding, that is, providing comprehensive support with all the different tasks in class (Wood, Bruner, and Ross Citation1976). As students take more ownership of their learning, the assistance can slowly be reduced and eventually removed when students perform better.
4 Teaching Model
QT-clickers were used for both formative and summative assessment for the 2017 intervention cohort. Formative assessment was achieved through QT-clicker use in class, as well as by using an online homework system for pre- and post-class assignments. The class tests, semester tests (term tests), and examination formed part of our summative assessment. All tests were based on a subset of the syllabus while the examination paper was based on the complete syllabus. The final grade is the average of the semester mark (Sem) and the examination mark (Exam). The semester mark included all formative assessments (20% of semester mark) and summative assessments during the semester (80% of the semester mark).
The examination paper for every cohort was set by a team of examiners and tested the same learning outcomes, but the questions differed from year to year. Before 2015, we used a MCQ examination paper with approximately 64 questions, each with five distractors. Each question counted one or two marks. Students could do their calculations on the back of each printed page, but the paper was not handed in for grading purposes. A scan sheet was used to capture the answers for the MCQ papers. Starting in 2015 the examination paper was more comprehensive and had approximately 55 free response and a few MCQ questions, counting one or two marks each. Students had two-and-a-half hours to write the paper and 30 min to submit their answers on their QT-clickers in nine different venues on campus. We are confident that the examination papers are valid and comparable, by virtue of the item analyses and the internal panel’s evaluation of the examination papers (Reyneke et al. Citation2018).
Currently in the 14-week semester (term), the flipped classroom model consists of three segments:
Out-of-class preparation
Prescribed pre-reading of relevant textbook sections and classnotes;
Pre-class online homework assignments with automated grading and immediate feedback.
In-class active learning
Problem-based real world exercises;
QT-clicker questions dispersed through the weekly three 50-min periods;
One 50-min tutorial per week, also used to write class tests using QT-clickers;
One optional 50-min Excel practical session in a computer laboratorium.
After-class consolidation
Post-class assignments based on real world scenarios.
The flipped classroom pedagogy requires students to come to class prepared, where difficult concepts can be revisited; QT-clicker questions are used in class to test the students’ understanding. TurningPoint® technology is used to integrate the QT-clicker questions into the PowerPoint® lecture. For some of the QT-clicker questions in class, depending on the type, students have to submit an individual answer, indicated by a deleted group-symbol; if they are allowed to discuss with their peers, the group-symbol is used.
The immediate feedback after polling makes it possible for the lecturer to assess the overall level of understanding, while students know what they do not understand and they can compare themselves against their peers.
The tutorial classes are based on a worksheet posted on the Blackboard learning management system for students to prepare for the weekly tutorial. Students have to submit their worksheet answers via QT-clickers in the tutorial class. The lecturer can then give immediate feedback on misunderstood concepts or calculation errors. Unfortunately some students simply copy worksheet answers from their peers and for this reason unannounced short QT-clicker tests, based on the worksheet, are given in the tutorial class.
Before QT-clickers were implemented in 2015, summative assessment (formal assessment) comprised the sole use of MCQ semester tests and examination papers. To supplement MCQs, class tests were written and graded by hand. The written class tests resulted in delayed feedback because of human resource capacity constraints and it is possible that this could have negatively impacted on student learning.
Since 2015 summative assessment has changed from MCQs to written papers using QT-clickers with self-paced polling. All students receive a hard copy of the test or examination paper, which should be turned in, showing their detailed calculations. The students’ hard copies will only be graded by hand if a power failure or any other technical malfunction occurs. The responses are submitted on their QT-clickers, which are sent to a wireless receiver (dongle), collected and then sent to the lecturer’s device. An Excel file is exported for the calculation of the final assessment marks. The few non-clicker papers of students who do not have a QT-clicker are graded by hand and captured in an Excel file. The process of partial grade crediting can commence by viewing the Excel sheet with all the responses. The answers to each question, located in a column in the spreadsheet, can then be sorted individually to pick up common mistakes. For example, if the normal probability of a variable should be calculated and a student managed to get the correct z-value, but read the wrong probability from the normal table, then intermediate marks (partial credit) can be awarded. This is an advantage of written papers with self-paced polling and a benefit to summative assessment, which is not possible for solely MCQ-based papers.
An added benefit of self-paced polling testing versus PowerPoint® polling is that tests and examination can be taken at a student’s own pace, that is, answers can be reviewed and changed as the student works through the paper. Students can submit answers after each question or return to previous questions and submit only after completion of the paper. The only limitation is the three hour cap on the paper as a whole.
5 Research Aim and Design
The aim of this article is to investigate whether the use of QT-clickers for active learning extended to summative assessment can enhance student learning in a large flipped classroom environment in an introductory statistics course.
The ideal scientific approach would have been to conduct a randomized experiment. However, from the studies mentioned above there is strong evidence that clickers benefit students, and a randomized experimental design would knowingly disadvantage the group of students who are not allowed to use clickers. To avoid unethical behavior, we decided to use two cohorts from different time periods instead, one who used QT-clickers (2017 students) and one who did not use QT-clickers (2014 students). QT-clickers were already introduced in 2015, but it was decided to use the 2017 cohort as the intervention group because of practical problems encountered with the implementation of QT-clickers in 2015 and 2016.Footnote1
5.1 Participants
Participants were all registered students for the first semester module of Introductory Statistics (STK110) at a large residential university in South Africa for the years 2014 or 2017. Up to 2014, the Grade 12 mathematics prerequisite for STK110 was at least 50% and from 2015 it was increased to at least 60%. Therefore, to make the 2014 and 2017 cohorts comparable, the samples representing these two cohorts included only first time statistics students with a Grade 12 mathematics mark of at least 60%. Repeat students, who may have an advantage based on their prior exposure to the module, were excluded from the sample. The two cohorts were exposed to the same textbook, course content and teaching pedagogy, namely a flipped classroom. In addition, the first four weeks of each semester were used to review basic statistics concepts and probability theory taught in Grade 12 mathematics to make sure that the baseline understanding of statistics concepts was similar for students who entered the module. A group of four to five lecturers teach STK110 in the first semester and typically at least three of the lecturers remain the same on an annual basis. The two cohorts differ primarily in that no QT-clickers were used by the 2014 cohort versus QT-clickers being used by the 2017 cohort. The 2014 cohort consisted of 1448 students and the 2017 cohort of 1176 students (cf. ).
Table 1 Summary of cohort composition.
The price of a new QT-clicker in 2015 was approximately $48.95 and increased to $53.01 in 2017. Past students could sell their QT-clickers to the on-campus bookstore or directly to other students, allowing prospective students to buy a secondhand refurbished QT-clicker at a lower price. Approximately 5% of the students in the 2017 cohort, similar to the previous two cohorts, could not afford to purchase a QT-clicker. They were, however, not penalized, since their class tests and semester tests were graded by hand and the marks manually captured on the grade book. These students could still actively participate in class with formative assessment questions and, when needed, handed their answers in on paper.
5.2 Equipment
The classroom response system most suitable to our needs is the QT-clicker of Turning Technologies. This QT-clicker differs from the standard clicker in that it has a full-featured keypad that allows more comprehensive data to be entered as opposed to the standard multiple choice option. It enables a wide variety of question types, from multiple choice, true/false, and numerical answers to words, sentences, and essays. Students’ answers can be tracked as each device has a unique serial number allocated to an individual student. QT-clicker devices are registered on the Blackboard learning management system and the QT-clicker serial number is then linked to a unique student number, which prevent students from using a peer’s QT-clicker.
6 Analysis
A mixed methods approach was used to obtain a comprehensive picture of the effectiveness of QT-clicker use. The quantitative analysis consists of descriptive statistics in the form of tables and graphs, as well as regression analyses. A general linear model (GLM) was used to investigate the relationship between QT-clicker use and examination performance. It could be argued that a difference between the two cohorts may be related to the partial crediting implemented in the 2017 examination versus no partial crediting in the 2014 examination, and not to the use of the QT-clickers for formative and summative assessment per se. Therefore, the 2017 examination and semester test papers were regraded as purely multiple-choice questions (i.e., without partial credit for intermediate steps) to allow for a comparison of the 2014 and 2017 summative papers. This enabled us to evaluate the impact of partial grade crediting on summative assessment by building two models, namely the 2017 examination graded with and without partial credits, each against the 2014 MCQ examination mark.
The qualitative analysis component of the study consists of ten survey questions to measure the 2017 cohort’s perception of the use of QT-clickers for formative and summative assessment. The survey was administered during class in the last few weeks of the first semester of 2017. The response rate was 79.5% (935 out of 1176). An eleventh open-ended question inviting general comments on QT-clickers was filled out by 527 of the 935 students (56.4%, 44.8% overall). Focus group interviews were conducted to obtain richer data to get a better understanding of the perceptions of students concerning QT-clicker use.
7 Findings
7.1 Quantitative Analysis
A summary of the composition of the two cohorts is given in .
7.1.1 Cohort Mark Distribution Comparison
Polygons based on deciles have been used in to give a better visual comparison between the distributions of the two cohorts.
Fig. 1 Frequency polygons of the distribution of examination marks for the 2014 cohort and the 2017 cohorts with and without partial grading.
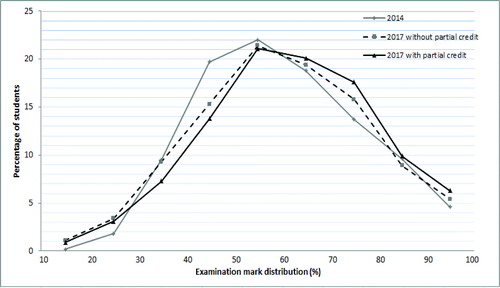
shows that the 2017 cohort with partial grading outperformed the 2014 cohort from the interval upward. The 2017 cohort without partial grading also outperformed the 2014 cohort in the
and
intervals.
Two chi-squared tests were conducted to evaluate the association between the examination marks for the 2014 cohort compared to the 2017 cohorts with and without partial grading, as well as McNemars’ tests for the paired data (the 2017 cohorts with and without partial grading).
There is a significant relationship when first comparing the distribution of scores for the 2014 cohort to the 2017 cohort with partial grading , Cramer’s
Footnote2. The grade intervals that contribute most to the discernible difference between the two distributions are
, and
. The 2017 cohort, for example, has significantly fewer students with an examination mark in the interval
and several more students than expected under the null hypothesis of no association with an examination mark in the interval
and vice versa for the 2014 cohort.
Second, when comparing the distribution of scores for the 2014 cohort to the 2017 cohort without partial grading a significant result was also found ( Cramer’s V = 0.098). The grade intervals that contribute most to the discernible difference between the two distributions, are
and
. We see that far fewer 2017 students than expected under the null hypothesis of no association achieved an examination mark in the interval
, while many more 2014 students than expected fall in this interval.
Finally, McNemar’s tests with a continuity correction were used to test which grade intervals, if any, have different proportions between the examination marks for the 2017 cohort with and without partial grading. The gains made by awarding partial credit were substantial with a significantly higher proportion of students with examination scores in the intervals , (p = 0.01),
, (p < 0.0001),
, (p = 0.002) and
(p = 0.003). There is also a significantly lower proportion of students with examination scores in the intervals
, (p < 0.0001) and
, (p < 0.0001).
7.1.2 Statistical Modeling
The GLM has as main objective to model the effect of the intervention (clicker cohort in 2017 versus the control cohort in 2014) on the performance of students as measured by their examination mark with and without partial grading. The students of both cohorts are therefore included in the model. Clicker use is included as a dummy variable. The model allows us to control for covariates that may also influence the outcome (i.e., examination mark).
In the first part, two GLM models with only main effects are constructed to evaluate the impact of partial grading versus no partial grading on examination performance. In the second part, a number of GLM models are built to investigate the dominance of Sem (semester mark) in the model. Finally, a model with interaction terms in addition to the main effects as in GLM I is constructed to model the effect of clicker use on examination performance for partial grading in 2017.
We identified nine plausible covariates that are likely to have an effect on the examination mark, in addition to clicker use. The variables Gr 12 Math, Gr 12 Eng, APS score, and Sem (explained in ) have been centered around their means, because they do not contain a meaningful value of zero and with interaction terms being included in the model, centering can avoid multicollinearity issues. The assumptions for all the GLM analyses were tested and met. The variables are defined in .
Table 2 Description of variables identified for the GLM.
Part I: Effect of Partial Grading
Two models were constructed: The GLM I (with partial grading) and GLM II (without partial grading) models explain 67.9% and 67.6% of the variance in the dependent variable, examination mark, respectively. A stepwise procedure was followed to identify the meaningful covariates in the model. Five of the nine covariates remain in both the GLM models, together with the independent variable of interest, that is, clicker use. The results of GLM I are displayed in and the results of GLM II in .
Table 3 Results of GLM I with partial grading in 2017.
Table 4 Results of GLM II without partial grading in 2017.
The general linear model without partial grading is given by:
The most important finding from the GLM, without partial grading, is that the mean examination mark for the 2017 students who used QT-clickers is 2.36% higher compared to the 2014 students who did not use QT-clickers, ceteris paribus. The GLM clicker regression coefficient for partial grading in 2017 is 3.337, which is almost 1% higher than without partial grading. It was found that students gain on average between 1% to 10% extra for a semester test or an examination paper when partially graded. The observed difference between the 2014 and non-partially graded 2017 scores could be due to the pedagogical advantage of QT-clickers, apart from partial grading.
Not surprisingly, the semester mark (term mark) is the best predictor of the examination mark in terms of its relative contribution to explaining the variance in the dependent variable (largest standardized regression coefficient in both models). For each 1% increase in the semester mark, the examination mark increases by 0.87%, controlling for all other predictors in the model. The use of QT-clickers is also the most important predictor in both models, following the semester mark. This is an indicator that the use of QT-clickers is a key predictor of student performance as measured by the examination mark.
Part II: Dominance of the Predictor Sem (Semester Mark) for 2017 With Partial Grading
We knew that Sem (semester mark) would be the strongest predictor of examination performance, well before exploring the data to assess the influence of the clickers and identify meaningful covariates that should be controlled for.
We constructed five additional GLM models to gain a better understanding of the role of Sem. The results of GLM III, IV, V, and VI are captured in ; the final model is GLM VII with interaction terms (see ).
Table 5 Summary of the four additional GLM models.
Table 6 Results of GLM VII (interaction model) with partial grading in 2017.
From GLM III the mean semester mark for 2017 students who used QT-clickers is 1.68% lower compared to the 2014 students who did not use QT-clickers. Clickers are novel to first year students and it may take time for them to get used to it, especially for summative assessment. The formative assessment component for the 2017 cohort contributed approximately 5%, toward the semester mark and students’ unfamiliarity with this new approach is possibly reflected in the negative relationship between the semester mark and clicker use.
It is evident from GLM IV that the mean examination mark for the 2017 students who used QT-clickers is 2.03% higher compared to the 2014 students who did not use QT-clickers.
We believe that the effect of clicker use is more evident toward the end of the semester and hence only truly quantifiable in the examination marks as indicated by GLM IV.
For GLM V confirming the strong association between students’ performance during the semester and their examination.
The lower coefficient of determination for GLM VI captures the importance of Sem in the model. The results of GLM VI justify the investigation of a model with interaction terms, as it is evident that Sem plays a role, not only in predicting the examination mark, but it also influences the other covariates’ roles in the model.
A model with all second and third-order interactions was therefore built. Four second-order interaction terms, namely Sem*Clicker, Sem*APS, Clicker*Mothertongue, and YrsReg*Math and none of the third-order interaction terms were found to be significant. The results of GLM VII model with all the significant interaction terms are displayed in .
The general linear model is given by:
The main objective is to interpret the effect of clickers on examination performance for both cohorts. Consider the following four options that the general linear equation reduces to:
1. Clicker = 0 and Mother tongue = 0:
2. Clicker = 0 and Mother tongue = 1:
3. Clicker = 1 and Mother tongue = 0:
4. Clicker = 1 and Mother tongue = 1:
For the 2017 students who used clickers and not educated in their mother tongue, there is a shift of approximately 4% in the intercept, with an accompanying increase of 0.106 in Sem (X2) compared to the 2014 students who did not use clickers and not educated in their mother tongue. Interaction terms Clicker*Sem and Sem*APS are of importance for interpreting the effect of the semester mark on the examination mark in combination with other covariates, however, both these two terms have a small effect on the examination mark. When comparing the two partial grading models the distinct effect of Clicker on the examination mark is noticeable, that is, in GLM I the coefficient is 3.337 and for GLM VII it is 2.485.
The estimated β-coefficient for Clicker*Mtongue of 1.52 captures the large effect of this interaction on the semester mark. It is evident that the 2017 students with clickers and non-mother tongue instruction have on average a higher examination mark than those with mother tongue instruction. It could be that many students are already used to non-mother tongue instruction at school level, or students tend to work harder because of the language barrier at university level.
7.2 Qualitative Analysis
The 2017 cohort was surveyed to obtain these students’ perceptions of QT-clicker use. Students could compare their understanding of statistics course content with QT-clickers against their understanding of course content in other courses that do not use QT-clickers. Ten statements were posed on how students perceived QT-clickers anchored on a scale from 0 (don’t agree) to 10 (fully agree). Where students did not fill in an answer, it was coded as a blank.
The ten QT-clicker statements in the survey that students could rate their agreement on a 0–10 scale are as follows:
QT-clickers made class more fun and exciting.
I prefer to use a QT-clicker than to raise my hand during class activities.
The use of QT-clickers made me feel more inclined to engage with my peers in class.
The QT-clicker questions during a tut session inspired me to do my tutorial beforehand.
Response to QT-clicker questions and feedback improved my attention.
Response to QT-clicker questions and feedback in class helped me to be more involved and engaged in a large lecture hall.
QT-clickers contributed positively to my learning experience.
The use of QT-clicker feedback improved my understanding of course content.
The QT-clicker feedback enabled the lecturer to respond and explain difficult concepts that I might not have understood.
Answers to QT-clicker questions and feedback helped me to judge my own understanding of the course content.
The scale from 0 to 10 was divided into three categories, 0 to 4 (low), 5 to 7 (moderate) and 8 to 10 (high). For each of the ten statements students’ responses were categorized according to the above parsing of the scale. A clustered bar graph represents the perceptions of the students (categorized as low, moderate, and high) on the 10 QT-clicker statements in .
Fig. 2 Clustered bar graph of students’ perceptions on ten QT-clicker statements.
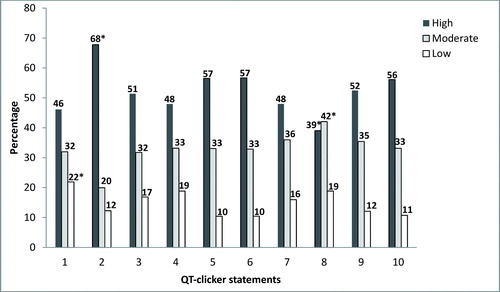
In general, approximately 50% of the students have a high perception of QT-clicker use. There were exceptions like statement 2 where 68% of students perceived QT-clickers a better medium of communicating their answers, than hand raising. The moderate perceivers formed about 33% of the students and the low perceivers from 10% to 22% depending on the statement.
A few data points in were flagged with an asterisk, to highlight the statements with noteworthy responses. The first statement identified for further discussion was “QT-clickers made class more fun and exciting.” It is evident that not all students perceived QT-clicker use as fun and exciting. Compared to the other nine statements, Statement 1 has the highest percentage of low perceivers, namely 22%. In the literature some of the authors described clicker use as fun and engaging, and it breaks up boredom and repetition of lectures (Mayer et al. Citation2009; Koenig Citation2010; Baltaci-Goktalay Citation2016), but these students have a differing opinion.
The outcome of Statement 2 supports the other studies that have shown that students prefer to use a QT-clicker rather than raising their hands during class activities. Stowell and Nelson (Citation2007) reported that clickers are superior to hand-raising and flash cards, the reason being that clickers maximize participation, especially in large classes, because of anonymity (Hoekstra Citation2008; Hwang and Wolfe Citation2010), and students can relax and have confidence facing their peers or lecturer. In one of the focus groups a student said: “The students are shy and if you put up your hand to answer a question, the whole class turns and stares at you, which is embarrassing.”
The results of statement 8 (whether the use of QT-clicker feedback improves understanding of course content) were somewhat unforeseen as we expected more students to agree with this statement. According to the literature, the purpose of feedback is to improve understanding of course content. Apart from immediate generated feedback in the form of a bar chart, lecturers should decide on time and detail of explaining wrong answers and revisiting certain concepts. The construction of more effective QT-clicker questions and simulations could also be considered in the future (Wit Citation2003; Kaplan Citation2011; Büyükkurt, Li, and Cassidy Citation2012).
The student responses to the ten QT-clicker statements (average mark out of 10) were also compared and merged with their final grades. The averages for the different statements in the grade distribution were calculated and tabulated in .
Table 7 Average statement response against final grades.
It is evident from that the average student satisfaction of QT-clicker use is positively correlated with the grade intervals of the final grade. It is worth noting that similar average statement responses can be bounded in broader bands of approximately 20% as indicated by the shading, that is, 40%–59%, 60%–79%, and 80%–100%. For certain statements, for example Statement 2, no matter what their grade distribution is, most students do not prefer to raise their hands. Students from the weakest to the strongest achievers rated Statement 8 (how QT-clicker feedback improved mastery of course content) lower than expected. There should be valid reasons that need to be clarified. This will be investigated in our follow-up studies.
The open-ended question was answered by only 44.8% of the 2017 students. A graphical representation of the primary response of the students can be seen in .
Fig. 3 Bar chart of students’ general comments on clicker use.
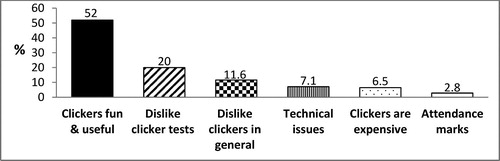
The open-ended question produced several disparate comments. Fifty-two percent of students perceived the use of clickers as positive. Comments made were that clickers are useful, helpful, increased productivity, learning, and engagement in class, kept students focused, etc. It made classes an interactive, inspiring, fun, exciting, incredible, and amazing learning experience. The students who were negative in general regarding the use of clickers formed 11.6% of the total and 20% of the students did not prefer clickers for formal tests. The average final grade for the students who disliked clickers in general and for formal tests were 57% and 60%, respectively, compared to the overall average final grade of 62%. Students who disliked clickers in general expressed their emotions in words such as that clickers are intimidating, frustrating, time-consuming, irrelevant, annoying, impractical, and complicated. The perception was that clickers make them nervous and they do not like it. Misconceptions regarding clicker use in formal assessment were responsible for some of the comments, that is, rounding of decimal places, marks not displayed, poor marks in tests, and waste of time in tests. In reality students have never lost marks for incorrect spelling and after all the answers have been submitted, the lecturer can give extra half marks or full marks for certain in-between calculation steps. All answers were marked in an interval, therefore they could not lose marks for incorrect decimal places. Students with clickers had at least an extra 10 min per hour to submit their answers on the clicker. Other categories of comments were: 7.1% of the students experienced technical problems, 6.5% felt that a clicker was very expensive, and 2.8% had problems with attendance marks. For example, if they forgot their clicker at home, they would not be able to do the questions in class and then lose marks on attendance.
8 Discussion
This study investigates the use of QT-clickers in a large first year statistics module, following a flipped classroom teaching model. The intervention of using QT-clickers was evaluated with respect to the pedagogical influence of the QT-clicker and the effect of partial grade crediting. Awarding partial credit allows instructors to better measure students statistical understanding and get a more nuanced view of what students do and do not understand. By using QT-clickers students are forced to come up with answers in class and tests, instead of multiple-choice guesses. This could help students to achieve a better understanding of basic statistical concepts. The immediate clicker feedback helps students to clarify their misconceptions and if it is integrated with their prior knowledge we believe that deeper learning is attained in the long term.
The first two GLM models predict that students of the 2017 clicker cohort’s examination marks are 2.36%–3.34% higher compared to the 2014 students who did not use QT-clickers, ceteris paribus. What is of importance, however, is the statistically significant increase in the students’ examination marks that can be linked to clicker use with or without partial grading.
The next four GLM models investigate the dominant role of the semester mark in combination with other covariates to predict the examination performance. Even if Sem (semester mark) is the only covariate in the model, it explains more than 65% of the unique variation in the examination scores. The focus of the last GLM is the influence of clickers on examination marks when controlling for the semester mark and its significant interaction with the other covariates.
Students may be getting a better understanding of some basic statistical concepts due to clicker use and that could account for the difference in examination grade distributions (i.e., a shift in examination scores away from the low decile scores with a rise from 60% onward) as observed in the polygons in .
Both the quantitative and the qualitative data indicate that clickers were successfully used in the flipped environment. The quantitative data shows that the clicker cohort’s partially graded examination average and pass rate were higher than that of the no clicker cohort. The improved performance of the clicker cohort is also evidenced by the stronger presence in the top performance categories of the examination marks, as compared to that of the no clicker cohort. The marginal improvement of 2% in both the examination average and pass rate has the practical importance of an increase of more than 23 successful students because of the large cohort. The qualitative findings evince the interactional and attitudinal benefits of Barnett (Citation2006), such as anonymity of responses and a positive attitude. A few concerns were identified for further attention, such as that the use of clicker question feedback provided did not necessarily improve understanding. Sometimes students can clarify their own misconceptions because of immediate generated feedback (Dunn et al. Citation2012), but it is also the lecturer’s responsibility to revisit a concept depending on the feedback.
The use of clickers and the evidence of the benefits that it offers are not unique to this study as shown by the existing rich body of literature on clicker use. What makes this study unique is that it expounds the benefits of QT-clicker use through the lens of a flipped classroom model, and using these clickers for both formative and summative assessment. The exposition of how clickers are used within this environment should be valuable to someone considering either using QT-clickers in a flipped classroom setting and/or using QT-clickers for summative assessment. Based on the results of this study prospective users can be fairly confident that using clickers in a flipped classroom for summative assessment is not detrimental to but, in fact, enhances student learning.
Future research could investigate a breakdown of topics that have historically given students trouble (item analysis of threshold concepts can be used) and a comparison of two or more cohorts across those topics would be worth pursuing. The contradicting results from our GLM models showing that students not educated in their mother tongue outperform their counterparts also warrant investigation.
Additional information
Funding
Notes
1 The lecturers were unaware that the power saver option must be disabled on the computers used for summative assessment in 2015. This led to uncaptured QT-clicker answers and apart from concerned students and the majority of scripts graded by hand, an optional, compensational test opportunity was offered which disqualified the comparison of the 2015 to the 2014 cohort. In 2016 the political unrest on campus regarding instruction in the Afrikaans medium resulted in the 2016 cohort also not being credibly comparable to the 2014 cohort.
2 Cramer’s V is a measure for effect size, V = 0.119 denotes a small effect.
References
- American Statistical Association (2016), “Guidelines for Assessment and Instruction in Statistics Education: College Report. Report (August 2005),” pp. 1–61.
- Amstelveen, R. H. (2013), “The Effect of ‘Clickers’ on Attendance in an Introductory Statistics Course: An Action Research Study,” Capella University.
- Baltaci-Goktalay, S. (2016), “How Personal Response Systems Promote Active Learning in Science Education?,” Journal of Learning and Teaching in Digital Age, 1, 47–54.
- Barnett, J. (2006), “Implementation of Personal Response Units in Very Large Lecture Classes: Student Perceptions,” Australasian Journal of Educational Technology, 22, 474–494. DOI: 10.14742/ajet.1281.
- Beatty, I. D. (2004), “Transforming Student Learning With Classroom Communication Systems,” Educause Center for Applied Research, 2004, 1–13.
- Beatty, I. D., Gerace, W. J., Leonard, W. J., and Dufresne, R. J. (2006), “Designing Effective Questions for Classroom Response System Teaching,” American Association of Physics Teachers, 74, 31–39, DOI: 10.1119/1.2121753.
- Bojinova, E., and Oigara, J. (2013), “Teaching and Learning With Clickers in Higher Education,” International Journal of Teaching and Learning in Higher Education, 25, 154–165.
- Brady, M., Seli, H., and Rosenthal, J. (2013), “‘Clickers’ and Metacognition: A Quasi-Experimental Comparative Study About Metacognitive Self-Regulation and Use of Electronic Feedback Devices,” Computers & Education, 65, 56–63, DOI: 10.1016/j.compedu.2013.02.001.
- Bransford, J. D., Brown, A. L., and Cocking, R. R., eds. (2000), How People Learn: Brain, Mind, Experience, and School: Expanded Edition. Developing Mindful Students, Skillful Thinkers, Thoughtful Schools, Washington, DC: National Academy Press.
- Büyükkurt, M., Li, Y., and Cassidy, R. (2012), “Using a Classroom Response System in an Introductory Business Statistics Course: Reflections and Lessons Learned,” in Proceedings of Informing Science & IT Education Conference (ISI), pp. 379–388.
- Caldwell, J. E. (2007), “Clickers in the Large Classroom: Current Research and Best-Practice Tips,” CBE—Life Sciences Education, 6, 9–20, DOI: 10.1187/cbe.06.
- Chen, J. C., Whittinghill, D. C., and Kadlowec, J.A. (2010), “Classes That Click: Fast, Rich Feedback to Enhance Student Learning and Satisfaction,” Journal of Engineering Education, 99, 159–168. DOI: 10.1002/j.2168-9830.2010.tb01052.x.
- Chou, P., Chang, C., and Lin, C. (2017), “BYOD or Not: A Comparison of Two Assessment Strategies for Student Learning,” Computers in Human Behavior, 74, 63–71, DOI: 10.1016/j.chb.2017.04.024.
- Credé, M., Roch, S. G., and Kieszczynka, U. M. (2010), “Class Attendance in College: A Meta-Analytic Review of the Relationship of Class Attendance With Grades and Student Characteristics,” Review of Educational Research, 80, 272–295, DOI: 10.3102/0034654310362998.
- Crews, T. B., Ducate, L., Rathel, J. M., Heid, K., and Bishoff, S. T. (2011), “Clickers in the Classroom: Transforming Students Into Active Learners,” ECAR Research Bulletin, 9, 1–12.
- Draper, S. W., and Brown, M. I. (2004), “Increasing Interactivity in Lectures Using an Electronic Voting System,” Journal of Computer Assisted Learning, 20, 81–94, DOI: 10.1111/j.1365-2729.2004.00074.x.
- Dufresne, R. J., Gerace, W. J., Leonard, W. J., Mestre, J. P., and Wenk, L. (1996), “Classtalk: A Classroom Communication System for Active Learning,” Journal of Computing in Higher Education, 7, 3–47, DOI: 10.1007/BF02948592.
- Dunn, P. K., Richardson, A., McDonald, C., and Oprescu, F. (2012), “Instructor Perceptions of Using a Mobile-Phone-Based Free Classroom Response System in First-Year Statistics Undergraduate Courses,” International Journal of Mathematical Education in Science and Technology, 43, 1041–1056, DOI: 10.1080/0020739X.2012.678896.
- Forster, M. (2014), “Teaching Data Analysis in Large Classes Using Clicker Assessment,” in Proceedings of the Ninth International Conference on Teaching Statistics (IASE).
- Freeman, M., Blayney, P., and Ginns, P. (2006), “Anonymity and in Class Learning: The Case for Electronic Response Systems,” Australasian Journal of Educational Technology, 22, 568–580. DOI: 10.14742/ajet.1286.
- Fullerton, J. A., and Umphrey, D. (2001), “An Analysis of Attitudes Toward Statistics: Gender Differences among Advertising Majors,” Association for Education in Journalism and Mass Communication, pp. 356–366.
- Gauci, S. A., Dantas, A. M., Williams, D. A., and Kemm, R. E. (2009), “Promoting Student-Centered Active Learning in Lectures With a Personal Response System,” Advances in Physiology Education, 33, 60–71, DOI: 10.1152/advan.00109.2007.
- Han, J. H., and Finkelstein, A. (2013), “Understanding the Effects of Professors’ Pedagogical Development With Clicker Assessment and Feedback Technologies and the Impact on Students’ Engagement and Learning in Higher Education,” Computers and Education, 65, 64–76, DOI: 10.1016/j.compedu.2013.02.002.
- Hancock, T. M. (2010), “Use of Audience Response Systems for Summative Assessment in Large Classes,” Australasian Journal of Educational Technology, 26, 226–237. DOI: 10.14742/ajet.1092.
- Hannafin, M. J., and Land, S. M. (2000), “Technology and Student-Centered Learning in Higher Education: Issues and Practices,” Journal of Computing in Higher Education, 12, 3–30, DOI: 10.1007/BF03032712.
- Hoekstra, A. (2008), “Vibrant Student Voices: Exploring Effects of the Use of Clickers in Large College Courses College Courses,” Learning, Media and Technology, 33, 329–341, DOI: 10.1080/17439880802497081.
- Hung, H. T. (2017), “Clickers in the Flipped Classroom: Bring Your Own Device (BYOD) to Promote Student Learning,” Interactive Learning Environments, 25, 983–995, DOI: 10.1080/10494820.2016.1240090.
- Hwang, J. H., and Wolfe, K. (2010), “Implications of Using the Electronic Response System in a Large Class,” Journal of Teaching in Travel & Tourism, 10, 265–279, DOI: 10.1080/15313220.2010.503536.
- Judson, E., and Sawada, D. (2002), “Learning From Past and Present: Electronic Response Systems in College Lecture Halls,” Journal of Computers in Mathematics and Science Teaching, 21, 167–181.
- Kaplan, J. J. (2011), “Innovative Activities: How Clickers Can Facilitate the Use of Simulations in Large Lecture Classes,” Technology Innovations in Statistics Education, 5, 1–15.
- Kay, R., and LeSage, A. (2009), “A Strategic Assessment of Audience Response Systems Used in Higher Education,” Australasian Journal of Educational Technology, 25, 235–249, DOI: 10.1016/j.compedu.2009.05.001.
- Koenig, K. (2010), “Building Acceptance for Pedagogical Reform Through Wide-Scale Implementation of Clickers,” Journal of College Science Teaching, 39, 46–50.
- Koppel, N., and Berenson, M. (2009), “Ask the Audience—Using Clickers to Enhance Introductory Business Statistics Courses,” Information Systems Education Journal, 7, 1–18.
- Kyei-Blankson, L. (2009), “Enhancing Student Learning in a Graduate Research and Statistics Course With Clickers,” Educause Review Online, available at http://www.educause.edu/ero/article/enhancing-student-learning-graduate-research-and-statistics-course-clickers.
- Lantz, M. E., and Stawiski, A. (2014), “Computers in Human Behavior Effectiveness of Clickers: Effect of Feedback and the Timing of Questions on Learning,” Computers in Human Behavior, 31, 280–286, DOI: 10.1016/j.chb.2013.10.009.
- Lasry, N. (2008), “Clickers or Flashcards: Is There Really a Difference?,” The Physics Teacher, 46, 242–244, DOI: 10.1119/1.2895678.
- Laxman, K. (2011), “A Study on the Adoption of Clickers in Higher Education,” Australasian Journal of Educational Technology, 27, 1291–1303. DOI: 10.14742/ajet.894.
- Littauer, R. (1972), “Instructional Imp a Low-Cost Electronic Studȩnt Response System Technology Brings Instruction Home,” Educational Technology, 12, 69–71.
- Lutz, S. T., and Huitt, W. G. (2004), “Connecting Cognitive Development and Constructivism: Implications From Theory for Instruction and Assessment,” Constructivism in the Human Sciences, 1, 67–90.
- Majerich, D. M., Stull, J. C., Varnum, S. J., and Ducette, J. P. (2011), “Facilitation of Formative Assessments Using Clickers in a University Physics Course,” Interdisciplinary Journal of ELearning and Learning Objects, 7, 11–24.
- Mateo, Z. F. (2010), “Creating Active Learning in a Large Introductory Statistics Class Using Clicker Technology,” in Proceedings of the Eighth International Conference on Teaching Statistics (IASE).
- Mayer, R. E., Stull, A., Deleeuw, K., Almeroth, K., Bimber, B., Chun, D., Bulger, M., Campbell, J., Knight, A., and Zhang, H. (2009), “Clickers in College Classrooms: Fostering Learning With Questioning Methods in Large Lecture Classes,” Contemporary Educational Psychology, 34, 51–57, DOI: 10.1016/j.cedpsych.2008.04.002.
- Mazur, E. (1997), Peer Instruction: A User’s Manual, Upper Saddle River, NJ: Prentice Hall.
- McGee, M., Stokes, L., and Nadolsky, P. (2016), “Just-in-Time Teaching in Statistics Classrooms,” Journal of Statistics Education, 24, 16–26, DOI: 10.1080/10691898.2016.1158023.
- McKenna, P. (2019), “Multiple Choice Questions: Answering Correctly and Knowing the Answer,” Interactive Technology and Smart Education, 16, 59–73, DOI: 10.1108/ITSE-09-2018-0071.
- Mocko, M., and Jacobbe, T. (2010), “The Effects of an Audience Response System (ARS) on Achievement and Attitudes Towards Statistics in an Introductory Statistics Class,” in Eighth International Conference on Teaching Statistics (IASE).
- Premkumar, K. (2016), “Use of Student Response Systems for Summative Assessments,” Creative Education, 7, 1851–1860.
- Prensky, M. (2011), “A Huge Leap for the Classroom. True Peer-to-Peer Learning, Enhanced by Technology,” Educational Technology, 51, 63–64.
- Rana, N. P., and Dwivedi, Y. K. (2016), “Using Clickers in a Large Business Class: Examining Use Behavior and Satisfaction,” Journal of Marketing Education, 38, 47–64, DOI: 10.1177/0273475315590660.
- Reyneke, F., Fletcher, L., and Harding, A. (2018), “The Effect of Technology-based Interventions on the Performance of First Year University Statistics Students,” African Journal of Research in Mathematics, Science and Technology Education, 7295, 231–242, DOI: 10.1080/18117295.2018.1477557.
- Schutz, P. A., Drogosz, L. M., White, V. E., and Distefano, C. (1998), “Prior Knowledge, Attitude, and Strategy Use in an Introduction to Statistics Course,” Learning and Individual Differences, 10, 291–308, DOI: 10.1016/S1041-6080(99)80124-1.
- Sharma, M. D., Khachan, J., Chan, B., and O’Byrne, J. (2005), “An Investigation of the Effectiveness of Electronic Classroom Communication Systems in Large Lecture Classes,” Australasian Journal of Educational Technology, 21, 137–154. DOI: 10.14742/ajet.1330.
- Smith, M. K., Wood, W. B., Krauter, K., and Knight, J. K. (2011), “Combining Peer Discussion With Instructor Explanation Increases Student Learning From In-Class Concept Questions,” CBE—Life Sciences Education, 10, 55–63, DOI: 10.1187/cbe.10-08-0101.
- Stowell, J. R., and Nelson, J. M. (2007), “Benefits of Electronic Audience Response Systems on Student Participation, Learning, and Emotion,” Teaching of Psychology, 34, 253–258, DOI: 10.1080/00986280701700391.
- Titman, A. C., and Lancaster, G. A. (2011), “Personal Response Systems For Teaching Postgraduate Statistics To Small Groups,” Journal of Statistics Education, 19, 1–20.
- Trees, A. R., and Jackson, M. H. (2007), “The Learning Environment in Clicker Classrooms: Student Processes of Learning and Involvement in Large University-Level Courses Using Student Response Systems,” Learning, Media and Technology, 32, 21–40, DOI: 10.1080/17439880601141179.
- Vygotsky, L. S. (1978), “Interaction Between Learning and Development,” in Mind and Society, eds. M. Cole, V. John-Steiner, S. Scribner, and E. Souberman, Cambridge, MA: Harvard University Press, pp. 79–91.
- Wang, Y., Chung, C., and Yang, L. (2014), “Using Clickers to Enhance Student Learning in Mathematics,” International Education Studies, 7, 1–13, DOI: 10.5539/ies.v7n10p1.
- Wang, Z., and Englander, F. (2010), “A Cross-Disciplinary Perspective on Explaining Student Performance in Introductory Statistics—What Is the Relative Impact of Procrastination?,” College Student Journal, 44, 458–471.
- Wit, E. (2003), “Who Wants to Be … The Use of a Personal Response System in Statistics Teaching,” MSOR Connections, 3, 14–20. DOI: 10.11120/msor.2003.03020014.
- Wood, D., Bruner, J. S., and Ross, G. (1976), “The Role of Tutoring in Problem Solving,” Journal of Child Psychology and Psychiatry, 17, 89–100, DOI: 10.1111/j.1469-7610.1976.tb00381.x.
- Yourstone, S. A., Kraye, H. S., and Albaum, G. (2008), “Classroom Questioning With Immediate Electronic Response: Do Clickers Improve Learning?,” Decision Sciences Journal of Innovative Education, 6, 75–88, DOI: 10.1111/j.1540-4609.2007.00166.x.