
 ?Mathematical formulae have been encoded as MathML and are displayed in this HTML version using MathJax in order to improve their display. Uncheck the box to turn MathJax off. This feature requires Javascript. Click on a formula to zoom.
Abstract
The primary goal of this article is to demonstrate the close relationship between 2 classes of dynamic models in psychological research: latent change score models and continuous time models. The secondary goal is to point out some differences. We begin with a brief review of both approaches, before demonstrating how the 2 methods are mathematically and conceptually related. It will be shown that most commonly used latent change score models are related to continuous time models by the difference equation approximation to the differential equation. One way in which the 2 approaches differ is the treatment of time. Whereas there are theoretical and practical restrictions regarding observation time points and intervals in latent change score models, no such limitations exist in continuous time models. We illustrate our arguments with three simulated data sets using a univariate and bivariate model with equal and unequal time intervals. As a by-product of this comparison, we discuss the use of phantom and definition variables to account for varying time intervals in latent change score models. We end with a reanalysis of the Bradway–McArdle longitudinal study on intellectual abilities (used before by McArdle & Hamagami, 2004) by means of the proportional change score model and the dual change score model in discrete and continuous time.
Longitudinal studies are becoming increasingly popular in the social sciences, and so are the methods for analyzing the data that arise from them. Among the plethora of different approaches, choosing the method that is best suited to address one’s research question is not an easy task. Depending on how time is treated in the analysis, we can roughly distinguish between two different types of longitudinal models: static models and dynamic models. In static models, time is treated as a predictor in the model equation, just like any other predictor (e.g., in a standard regression model). This, for example, is the case in latent growth curve models (Bollen & Curran, Citation2006; Duncan, Duncan, & Strycker, Citation2006) or multilevel/mixed-effects models (Hox, Citation2010; Pinheiro & Bates, Citation2000; Singer & Willett, Citation2003). These models are useful because they allow us to investigate changes in one or more dependent variables as a function of time (and possible other predictors). However, time per se does not cause anything. Thus, from the perspective of a cause–effect relationship, these models are misspecified. Time might often be a good proxy for the actual mechanisms underlying the change in a dependent variable, but—other than suggested by the model equation—certainly does not cause this change.Footnote1 In contrast to static models, dynamic models try to capture the actual mechanisms of a change process. Common examples include autoregressive, cross-lagged, or latent change score (LCS) models (e.g., Du Toit & Browne, Citation2001; Jöreskog, Citation1970; Jöreskog & Sörbom, Citation1977; McArdle, Citation2001, Citation2009; McArdle & Hamagami, Citation2004). In these models, time is considered implicitly by the order of the measurement occasions, but is not explicitly used as a predictor. Thus, these models are particularly useful when one is interested in the dynamics and the causes of a change process.
Researchers’ preferences for dynamic versus static models have changed back and forth over the years. As pointed out in a recent review by McArdle (Citation2009), cross-lagged models (i.e., dynamic models) were widely used in the 1970s and 1980s, and growth curve models (i.e., static models) became extremely popular in the late 1990s and 2000s following the seminal publications by Meredith and Tisak (Citation1990) and McArdle (Citation1986). Even though growth curve models remain very popular, with the development and advancement of (dual) change score models during the last 10 years, researchers are increasingly considering dynamic modeling approaches as well.
A similar shift in preference can be observed with respect to the question of whether time should be treated continuously or discretely. In the econometric literature, researchers have highlighted the need to model time continuously as early as in the 1940s (Bartlett, Citation1946; Bergstrom, Citation1988), followed by similar calls in the sociological literature (Coleman, Citation1968; Simon, Citation1952). In psychology, it was probably the advent of multilevel models that popularized the use of time as a predictor in static models of change. Despite their long history, dynamic models in continuous time are only recently starting to find their way into the psychological literature (Oud & Jansen, Citation2000; Voelkle, Oud, Davidov, & Schmidt, Citation2012).
The goal of this article is to facilitate this process by demonstrating the close relationship between two dynamic models for the analysis of change: the (discrete time) LCS model and the continuous time model. To this end, we begin with a brief review of the LCS concept, in particular the so-called proportional change score model, the dual change score model, and the multivariate dual change score model. Next, we introduce the basic idea of continuous time modeling, followed by a discussion of the mathematical and conceptual relationship between the two. We illustrate our arguments with three simulated data sets and end with a reanalysis of the Bradway–McArdle longitudinal study on intellectual abilities. The data have been analyzed before by McArdle and Hamagami (Citation2004) using LCS models. All models are discussed from a structural equation modeling (SEM) perspective and path diagrams are used to facilitate the specification of the different approaches.
THE BASICS OF LATENT CHANGE SCORE MODELING
For a comprehensive introduction to LCS modeling, we refer the reader to McArdle (Citation2001, Citation2009) and McArdle and Hamagami (Citation2001, Citation2004). In the following, we just sketch the basics of LCS by means of SEM. In line with this literature we limit ourselves to the use of continuous variables.
One of the main advantages of SEM is distinguishing between manifest variables, which can be directly observed, and latent (unobserved) variables. This accommodates for the fact that most measurements are not without error. In line with classical test theory (Gulliksen, Citation1950; Lord & Novick, Citation1968) an observed score of individual i = 1, …, N on any variable x can be conceived of as being composed of a true score and an error score
. Accordingly, we distinguish between manifest (x) and latent (
) variables, such that Footnote2
For at least two measurement occasions, we can compute the change from one time point to the next. This can be done at the level of manifest variables [Δ] as well as at the level of latent variables [
]. In this notation, t represents the actual time point and j = 1, …, T the measurement occasion. For example,
is the value of individual i on variable x at the j = fifth measurement occasion (j = 0 is the first measurement occasion), which happened to be the year t = 2005. In practice, the observation occasions could also differ across individuals (
). For example, whereas individual i = 1 might have had his or her fifth measurement taken in the year 2005, the same year might have been the tenth measurement occasion for individual i = 2 (i.e.,
). Likewise, the time intervals between two measurement occasions
might differ across individuals and the (latent) change score for any individual i is a function of the difference
(
).
Other than the name might suggest, in LCS modeling we are not as interested in the latent change per se (i.e., (
)) as in the rate of change. The rate of change is the change over a certain time interval; that is,
. Only if
= 1 does the rate of change reduce to the difference between two measurement occasions. In this simplified situation—and for only two time points—the univariate LCS model can be defined as
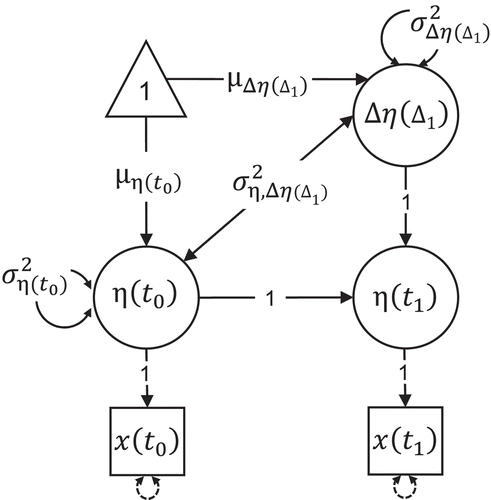
provides a graphical illustration of the model. Note that with only two time points the model is saturated (i.e., the number of parameters to be estimated is equal to the number of nonidentical elements in the data covariance matrix and mean vector) and it is not possible to separate true variance from measurement error.
FIGURE 1 Univariate latent change score model for two time points. The model is just identified, thus there are five free parameters: The mean and variance
of the variable at the initial time point, the mean
and variance
of the latent change variable, and the covariance
between the two. The measurement error variances are constrained to zero. Regression paths of error terms are fixed to 1.
For more than two time points, we can not only separate true variance from measurement variance, but we can also postulate a structure among the latent variables; that is, we can begin to formulate and test hypotheses regarding the dynamics of a change process. For example, the proportional change score model (PCM) assumes a “carry-over” or “self-feedback” effect (McArdle, Citation2001; McArdle & Hamagami, Citation2004, p. 316), in the sense that future changes decrease or increase proportionally to the current status. The proportional effect is represented by the time-invariant parameter in Equation 3:
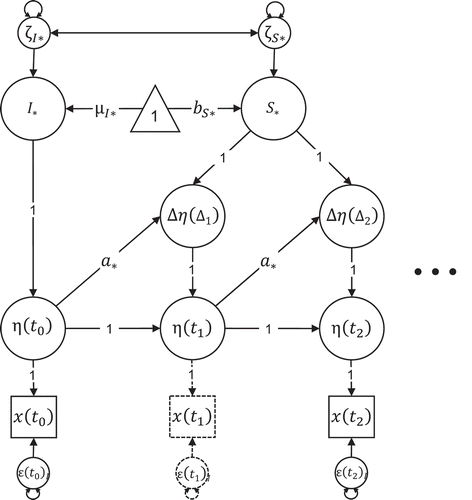
In addition to parameter , the dual change score model (DCM) postulates a random effect
that captures interindividual differences in the rate of change. Because
is a constant (but individual-specific) term that is added at each measurement occasion, McArdle and Hamagami (Citation2004) denoted it a “latent slope” (p. 316). However, one could also conceive of it as a latent “trait,” as it is more common in the literature on continuous time models (Oud & Jansen, Citation2000, p. 200). In the following we therefore use the two terms synonymously. The DCM, whose name stems from the two additive components
and
, is thus defined as
The standard DCM allows for measurement errors, but does not include a dynamic error term in Equation 4 and . However, Equation 4 can be extended by introducing a dynamic error term, albeit the error term is only defined in discrete time with = 1 for all j and i (e.g., McArdle, Citation2001).Footnote3
FIGURE 2 Univariate dual change score model. The dots to the right of the figure indicate that the time series can continue to any arbitrary number of time points T. No measurement took place at (indicated by the dashed part, which is not part of the model), thus the latent variable
is a phantom variable. Regression paths of error terms are fixed to 1.
Accounting for Unequal Time Intervals by Using Phantom Variables
As discussed before, and as explicated in Equation 5, the time intervals () between two adjacent measurement occasions could differ across assessment waves (j) and individuals (i). As long as most individuals are observed at the same occasion, we can account for differences in time intervals between occasions by using so-called phantom variables (Rindskopf, Citation1984). Phantom variables are latent variables without indicators. As illustrated by the dashed part in , they can be used as “placeholders” to artificially create equal intervals. For example, if measurements were obtained in
= 2005,
= 2006, and
= 2008, we could introduce a phantom variable in 2007 (i.e., add a fourth measurement wave to the data, with all values missing), to make the time intervals equidistant. When doing so,
can be dropped from the equation because—after creating equal intervals
= 1 for all j and i—the rate of change would be identical to the difference score. Although a practical solution, there are limits to this approach. First, for many different time intervals the model specification gets quite cumbersome. More important, however, the approach breaks down if time intervals vary across individuals and not just assessment waves. For example for T = 11 time points and N = 100 individuals, we might end up with (T – 1)·N = 1,000 different time intervals. Note that this also limits our ability to use LCS models to investigate change as a function of age (which is likely to vary across individuals in a given sample).
Reformulating the LCS Model as an Autoregressive and Cross-Lagged Panel Model for Δj,i
For Equation 5 can also be written as
For the special case of = 1 and
= 0, Equations 6 and 7 reduce to the DCM defined for the univariate case in Equation 4. If in addition
= 0, Equations 6 and 7 represent the PCM defined for the univariate case in Equation 3.
The reformulation of an LCS model as an ARCL panel model provides an easy way to specify an LCS model by means of simple parameter constraints instead of latent change variables. This makes the specification of an LCS model less cumbersome and less error-prone. In addition, the approach suggests a different way to deal with unequal measurement intervals. Instead of introducing phantom variables for missing measurement occasions, one could simply constrain the parameter estimates in terms of as shown in Equation 7. Because
are known, this would also overcome the limitation of the phantom variable approach that time intervals cannot vary across individuals. In SEM parlance,
would enter the model as a definition variable (Mehta & Neale, Citation2005). Maybe most important, however, the reformulation serves as the basis of relating and comparing LCS models to continuous time models, which is introduced in the next section.
THE BASICS OF CONTINUOUS TIME MODELING
As previously for change score models, in the following we only sketch the basics of continuous time (CT) modeling by means of SEM. For a more comprehensive introduction to the approach, we refer the reader to Voelkle et al. (Citation2012), and to Oud and colleagues for additional background information (Oud, Citation2007b; Oud & Delsing, Citation2010; Oud & Jansen, Citation2000).
In LCS we predict the rate of change, which we defined before as the difference between two latent variables over a discrete time interval . In CT modeling we assume the interval to be infinitesimally small (Coleman, Citation1968). Another way to think about the relationship between a discrete and a CT model is that the former is sampled from the latter at some selected time points, a notion that is common in control theory (e.g., Zadeh & Desoer, Citation1963). This applies to most longitudinal studies where few discrete measurement occasions have to suffice to infer how a construct changes over time (e.g., how cognitive ability changes across the life span based on a longitudinal study with annual measurement occasions only). We thus define the rate of change as the derivative of
with respect to time. Just as in Equation 5, the continuous time model predicts this rate of change in
:
Like the discrete-time LCS model, the p × p matrix (the so-called drift matrix) contains the auto-effects in the main diagonal and the cross-effects of one variable on another (the coupling parameters) in the off-diagonals. Also as before, the p-dimensional vector
represents a person-specific constant (trait) that is added to the equation with covariance matrix
, intercept vector
, and covariance with the first measurement occasion
. Capital letter
denotes the so-called Wiener process, a random walk in continuous time with initial value 0 and independent increments with distribution N(0,
) over interval
. To model arbitrary variances and covariances among the error terms,
is premultiplied by the Cholesky triangle
so that the resulting error covariance matrix in continuous time—the diffusion matrix—is
.
Reformulating the CT Model as an Autoregressive and Cross-Lagged Panel Model for Δj,i
Just like LCS Equation 5 can be expressed as Equation 6, the differential Equation 8 can be solved for any arbitrary time interval and initial values
, resulting in
This corresponds to a vector ARCL panel model as defined in Equation 7, with ,
With these parameter constraints in place, the dynamic error covariance matrix is:
ON THE RELATIONSHIP BETWEEN LATENT CHANGE SCORE AND CONTINUOUS TIME MODELING
What LCS and CT models have in common is that both aim at predicting the rate of change. They differ in their definition of the rate of change. In LCS models the rate of change is the difference in the latent variable(s) of interest between two discrete time points divided by the length of the time interval between them (Equation 5). In CT models, the rate of change is the derivative of the latent variable(s) with respect to time (Equation 8). As demonstrated earlier, for any discrete time interval , LCS and CT models can both be reformulated as ARCL panel models with discrete time parameters constrained to the underlying parameters of an LCS or CT model, respectively. For the special univariate case (i.e., A = a; Q = q;
=
=
;
=
), this is illustrated in , which provides a graphical representation of the LCS model and the CT model. For the general multivariate case, the parameter constraints are summarized in . Because of the different constraints, the two modeling approaches are not the same. For example, for the same time interval between two consecutive measurement occasions (
), the effect(s) of
on
would be
in the LCS model (Equation 5) and
in the CT model (Equation 8). The reason for this difference is that both models make different assumptions about the process between the observed measurement occasions. This is best understood when putting the matrix exponential constraint of the CT model in power series expansion:
TABLE 1 Latent Change Score and Continuous Time Constraints for Time Interval
FIGURE 3 Univariate latent change score model. The dots to the right of the figure indicate that the time series can continue to any arbitrary number of time points T. The different types of circles indicate parameter constraints. The constraints are defined below the figure for the approximate and exact approach. For = 1, the model resulting from implementing the approximate parameter constraints is identical to the (LCS) model in Figure 2. Regression paths of error terms are fixed to 1.
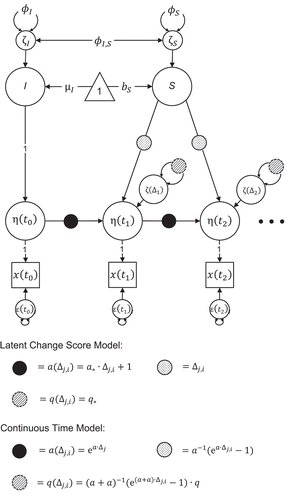
The first two terms of the power series expansion are identical to the LCS constraint ( in Equation 6). The LCS constraint is thus a crude approximation of the full power series of the CT model, which results from the difference score approximation to the actual derivative.Footnote4
Operating in discrete time, the LCS model assumes that the process formulated in Equation 5 only operates between, but not within, measurement occasions. In contrast, the CT model assumes that the model process (Equation 8) also operates between the observed measurement occasions. For equal and discrete intervals, both models should thus provide the same description of the observed discrete-time data, but differ in the interpolation or extrapolation to other time intervals. Such interpolation or extrapolation, however, is crucially important for the comparison of parameter estimates across different time intervals within a study, different time intervals across different studies, and different time intervals across individuals. Without being able to answer whether an effect observed for individual i = 1 at a time interval is weaker or stronger than an effect of another individual i = 2 at a time interval
, no cumulative scientific knowledge can be generated (Voelkle et al., Citation2012).
Based on these considerations, we expect that as dynamic models focusing on the prediction of the rate of change, LCS and CT models should both make it possible to address the same questions in longitudinal data analysis and yield similar results. However, because the two approaches differ in their definition of the rate of change, and in the assumptions about the process between measurement occasions, we also expect the results to be not identical, particularly if time intervals differ. More specifically, we expect discrete time parameter estimates [i.e., ,
,
] for observed time intervals to be identical for both approaches if time intervals are the same (for all j and i). The same should hold true if equidistant time intervals are artificially created by means of phantom variables, which is possible as long as most individuals are observed at the same measurement occasions. Because of the crude approximation of the change process between measurement occasions, the use of definition variables in LCS models is unlikely to be a viable solution to account for individually varying time intervals. Rather we assume that only CT models will yield correct results for individually varying time intervals (e.g., for the analysis of a change process in terms of age). To substantiate our theoretical arguments, we provide three examples using simulated data in the next section, and a reanalysis of an empirical data set in the section following.
AN ILLUSTRATION USING THREE SIMULATED DATA SETS
The purpose of Example 1 is to demonstrate that LCS and CT models provide the same description of the observed data if all intervals are equal. Example 2 is supposed to demonstrate the importance of accounting for time intervals if they are unequal across measurement occasions. To this end we compare four different approaches: (a) the use of phantom variables in LCS models and (b) in LCS models that are reformulated as ARCL models, (c) the use of definition variables in the latter, and (d) CT models. Example 3 then demonstrates how to deal with individually varying time intervals by means of CT modeling. We restrict ourselves to univariate and bivariate models without latent traits () in this section. The DCM with latent traits will be used in the empirical example.
Example 1: Univariate Model With Equal Time Intervals
Method
Data were generated for N = 500 cases at 11 measurement occasions according to a true CT model with , drift coefficient
, and dynamic error
with
. All time intervals were assumed to be equal with
for all j and i.
In a next step we fitted three models (M1–M3) to this data set. M1 was the PCM using the standard formulation by means of latent variables (Equations 3 and 5). M2 was the PCM reformulated as an ARCL model (Equation 7). M3 was the CT model (Equation 8).
For all examples, the free software environment R (R Development Core Team, Citation2012) was used for data generation, Mplus (Muthén & Muthén, Citation1998–2012) was used for estimating the LCS models (here M1 and M2), and the R-based SEM program OpenMx (Boker et al., Citation2011) was used for estimating the CT models (here M3).Footnote5
Results
Parameter estimates for all three models are provided in . There are four free parameters (nonitalic in ). Because LCS and CT models have a different tradition and use a slightly different terminology (e.g., proportion parameter vs. auto-effect; latent slope vs. latent trait), we list both names where necessary. As pointed out before, the fit of the models is equal in this equal interval case, but the parameters, although closely related, are not identical. This is most apparent in the parameter estimate in M1 and M2, versus
in M3. Because of the constraints given in , however, they both result in the same autoregressive effect
=– 0.34 · 1 + 1 =
= 0.66, which is shown in italics in . Likewise, because of the constraints in Equation 9, the dynamic error variance is the same [
0.68], as also shown in italics in . Apart from minor rounding differences, which could partly be due to the different programs (OpenMx vs. Mplus), results are identical. This is also true for the likelihood of all three models.
TABLE 2 Example 1: Univariate Model With Equal Time Intervals ( = 1 for all j and i)
Discussion
This first example demonstrates that LCS models can be reformulated as ARCL models and both yield identical results. In addition, for the model fit (–2LogL) and discrete time parameters of the LCS, the reformulated LCS, and the CT model are identical. However, when it comes to identifying the CT parameters used to generate the data (a = –0.4 and q = 1), with estimates of a = –0.41 and q = 1.00, not surprisingly the CT model gets closer to the true parameters than the LCS models (
= –0.34 and
= 0.68). We therefore conclude that although it is safe to interpret the discrete time parameters of all three models, the LCS proportion parameter and dynamic error variance should not be used to generalize beyond immediately observed measurement occasions.
Example 2: Univariate Model With Unequal Time Intervals
Method
Data were generated in the same way as in the first example, but with = 1, 2, 3, 1, 4, 2, 3, 1, 2, 1 (for j = 1, …, 10 and all i); that is, time intervals were allowed to differ between assessment occasions while remaining constant across individuals.
In a next step we fitted five models (M1–M5) to this data set: M1, the PCM using the standard formulation by means of latent variables (Equations 3 and 5), but without accounting for unequal time intervals; M2, the same PCM as M1, but with 10 additional phantom variables included so as to create artificial time intervals with for all j and i; M3, Model M2 reformulated as an ARCL model (including phantom variables); M4, Model M2 reformulated as an ARCL model, but instead of phantom variables, definition variables were used to account for different time intervals (i.e., instead of creating equal time intervals before using
in Equation 7, the actually observed time intervals
were used directly in Equation 7); and M5, the CT model (Equation 8).
Results
Parameter estimates for all five models are provided in . As before, there are four free parameters (nonitalic in ) and the relationship between (shown in italics in ) and
, respectively
, (
and
, respectively
is given in . For example, for M5,
= 0.69. When ignoring the actual length of the time intervals (M1), the model fit differs from all other models, and the parameter estimates are incorrect and hard to interpret. For example, it is impossible to compute
and
if the observed time intervals do not just happen to be
for all j and i, as was the case in the first example. This problem is resolved when using phantom variables as in M2 and M3. Confirming and extending our previous finding, even with phantom variables, M2 and M3 are identical in terms of fit and parameter estimates. Likewise, M5 yields the same model fit and discrete time—but not CT—parameter estimates as M2 and M3. Finally, M4 yields a model fit and estimates for
and
that differ from all other models. Because the dynamics between measurement occasions are not taken into account, parameter estimates of M4 are further from the true parameters than those of M2, M3, and M5.
TABLE 3 Example 2: Univariate Model With Unequal Time Intervals ( = 1, 2, 3, 1, 4, 2, 3, 1, 2, 1 for j = 1, …, 10 and all i)
Discussion
This second example demonstrates that if time intervals between assessment occasions differ, ignoring this difference results in incorrect results and hard-to-interpret parameter estimates. This has been demonstrated before in a series of publications (Bergstrom, Citation1988; Hamagami & McArdle, Citation2001; Oud & Jansen, Citation2000; see Voelkle et al., Citation2012, for more detailed references). Creating artificially equal time intervals by introducing phantom variables is a straightforward solution to this problem, yielding correct discrete time parameter estimates for the newly created time interval (here, in M2 and M3). The phantom variable approach works for the LCS model as well as the rewrite as an ARCL model (M2 and M3). However, as in the previous example, when it comes to identifying the CT parameters used to generate the data, the CT model is superior to all other models. Finally, using definition variables in the reformulated LCS model (M4) seems tempting, but it is not a viable solution. As compared to M2, M3, and M5, the parameter estimates of model M4 deviate most from the true parameters. We therefore conclude that it is safe to interpret the discrete time parameters of M2, M3, and M5, but only M5 allows an exact generalization beyond the immediately observed measurement occasions. Note that in the presence of unequal time intervals, the LCS model should never be used without phantom variables (M1). Although the use of definition variables is better than ignoring time altogether, we generally recommend not using the definition variable approach in LCS modeling.
Example 3: Bivariate Model With Individually Varying Time Intervals
Method
In this example, data were generated for N = 500 cases at 11 measurement occasions according to a bivariate model with , drift matrix
, and dynamic error
with
. Time intervals were drawn from a continuous uniform distribution, with a minimum length of 1 and a maximum length of 4 (
), resulting in up to (N = 500) · (T – 1 = 10) = 5,000 different time intervals.Footnote6
With such a large number of time intervals of totally different length, the use of phantom variables would become extremely complicated. Although the use of definition variables would still be possible, this would again result in incorrect parameter estimates because the dynamics between measurement occasions are not taken into account as illustrated in the previous example. Thus, we limit ourselves to the estimation of a CT model (M2), which we contrast with an LCS model that ignores the length of the time intervals (M1).
Results
Parameter estimates are provided in . There are 12 free parameters in the bivariate model (nonitalics in ). Despite the large number of different time intervals, all parameter estimates of the CT model (M2) are close to the true parameters. In contrast, when ignoring time intervals, parameter estimates are quite different. For example, whereas the auto-effect (proportion) of the first variable is in M1, it is
in M2 (true parameter:
). Similar differences can be observed for the other parameters (see ).
TABLE 4 Example 3: Bivariate Model With Individually Varying Time Intervals ( ˜ U[1, 4] for all j and i)
Discussion
As demonstrated in Example 2, the use of phantom variables is a straightforward solution to the problem of unequal time intervals as long as the number of unequal time intervals is limited. With a large number of different time intervals—there could be up to individually varying time intervals as in this example—the use of LCS models becomes infeasible. Ignoring such individual differences by creating a few discrete “bins” of individuals (in this example T – 1 = 10 such bins were used) that are then treated as equally spaced measurement occasions will usually result in biased parameter estimates as apparent from (M1). In contrast, CT models as defined in Equation 8 can handle this situation, yield correct parameter estimates, and should thus be used (see M1 in ).
AN EMPIRICAL EXAMPLE: THE BRADWAY–MCARDLE LONGITUDINAL STUDY ON INTELLECTUAL ABILITIES
To further illustrate and extend our discussion on the relationship between LCS and CT models, we use empirical data on short-term memory from the Bradway–McArdle Longitudinal Study (Bradway & Thompson, Citation1962; McArdle, Hamagami, Meredith, & Bradway, Citation2000). In this study, intellectual abilities of 111 individuals were assessed at up to six measurement occasions between the ages of 2 (youngest person at the first measurement occasion) and 67.5 years (oldest person at last measurement occasion). We chose this data set because it has been analyzed before with LCS models (McArdle & Hamagami, Citation2004). This allows us to build directly on previous pioneering work by relating it to CT modeling. For reasons of space, however, we limit ourselves to just two exemplary models used by McArdle and Hamagami (Citation2004): the PCM and the DCM.
We start with the PCM by first replicating the analyses by McArdle and Hamagami (Citation2004) using LCS models with phantom variables to account for unequal time intervals. We then redo the analysis using the ARCL reformulation of the LCS model (with phantom variables), before comparing it to the CT model (without phantom variables). In the subsequent section we proceed in the same way with the DCM.
Participants’ age at the first measurement occasion varied between 2 and 6.5 years, which is a large age range in terms of cognitive development. As discussed earlier, it is not possible to account for these differences in LCS models. For this reason, McArdle and Hamagami (Citation2004, p. 301) computed age-adjusted scores by linearly extrapolating the original data within occasions to the average age before linearly extrapolating across occasions into 5-year age segments. This results in short-term memory scores that are adjusted to the values that would have been obtained if everyone at measurement occasion 1 to 6 had been exactly 5, 15, 30, 40, 55, and 65 years of age. To keep results comparable we work with the adjusted scores in the next two sections. Because CT models can account for such age variation, however, we redo the analyses in terms of age rather than measurement occasion in the final section.
The Proportional Change Score Model in Discrete and Continuous Time
The adjusted short-term memory scores () ranged from a minimum value of 0.28 to a maximum of 100. In a first attempt (M1) to analyze changes in short-term memory by dynamic models, we replicated the PCM by McArdle and Hamagami (Citation2004, p. 317; see their , third column). Equal time intervals (
for all j and i) were created by adding seven phantom variables to the six observed measurement waves, resulting in 13 measurement occasions at the average (and hypothetical) ages of 5, 10, 15, 20, 25, 30, 35, 40, 45, 50, 55, 60, and 65 (measurement occasions represented by phantom variables are shown in italics). The model was defined in Equation 3 with
, assuming normally distributed and uncorrelated measurement errors with time-invariant variance
. Note that the model differs from the PCM used in the simulated examples. Whereas we allowed for dynamic error but no measurement error in the simulated examples, this model allows for measurement error but no dynamic error. We return to this issue later on. Without the latent variable
(i.e., when deleting
from the figure), provides a graphical representation of the model. We next reformulated the LCS model as a constrained ARCL model (M2) as defined in Equation 7, before estimating a CT model (M3) as defined in Equation 8 with
= 2, 3, 2, 3, 2 (for j = 1, …, 5 and all i; without
with measurement error instead of dynamic error; without phantom variables).
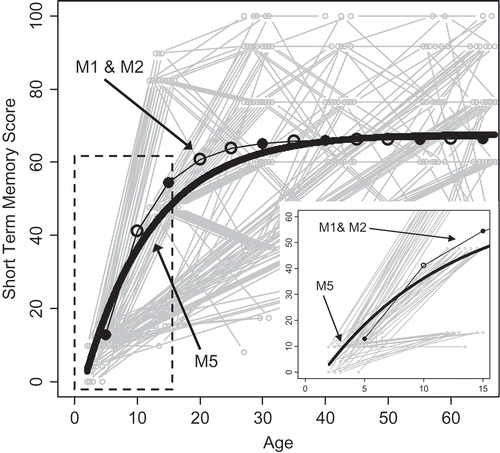
Results are given in . As demonstrated before, the original LCS model in terms of latent change variables and phantom variables, its reformulation as an ARCL model with phantom variables, and the CT model (without phantom variables) yield identical model fit and discrete time parameters and replicate the results of McArdle and Hamagami (Citation2004). With an autoregression parameter larger than 1 [], the model is unstable, meaning that the predicted short-term memory scores approach infinity as time goes toward infinity. Clearly, this is not a reasonable assumption for the task at hand. In addition, the model-predicted mean trajectory provides a poor description of the actual data. This is illustrated in , which shows the predicted average short-term memory scores for LCS model M1 and M2 together with the nonadjusted individual short-term memory scores (in gray) as a function of measurement occasion. Solid circles represent predicted average short-term memory at occasions where actual measurements were obtained, whereas empty circles indicate phantom variables. It is important to understand that the LCS model—being a discrete time model—does not make any predictions between these discrete time points. The straight line connecting the dots is used for illustrative purposes only and is not predicted by the model. In contrast, the CT model (M4; solid black line in ) predicts a continuous trajectory of short-term memory development across the entire age range. We will hold off the discussion of model M4 until later on.
FIGURE 4 Predicted trajectories of latent change score (LCS) models M1 and M2, and continuous time model M4 presented in . The gray lines represent the N = 111 observed trajectories of short-term memory as a function of age. Measurement occasions with phantom variables in the LCS models are represented by empty circles.
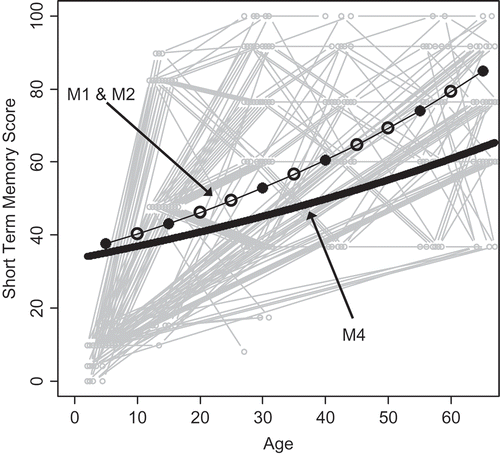
In any case, however, predicting a steadily improving short-term memory is certainly not correct. Part of the reason for the extremely high autoregressive parameters (> 1.00) might not only be the dynamic process, but also stable interindividual differences—that is, unobserved heterogeneity (cf. Halaby, Citation2004)—which might bias the proportion parameter. By adding a random trait (or “slope” in LCS parlance) this is accounted for in the DCM.
The Dual Change Score Model in Discrete and Continuous Time
Adding a random trait (slope) factor to the LCS model results in a significant improvement in model fit (compare and ). Because the two models are nested, the difference between the two log-likelihoods follows a χFootnote2distribution with χFootnote2 = 4428.61 – 4066.56 = 362.05, df = 7 – 4 = 3, p < .001. Unfortunately, however, the addition of resulted in a nonpositive definite covariance matrix of the latent variables, with initial
= –265.78 (not shown in ). To account for this, McArdle and Hamagami (Citation2004) constrained the correlation between
and
to a value smaller than 0.99. To keep our results comparable, we adopted the same constraint, but discuss an alternative approach later.
TABLE 5 Proportional Change Score Model in Discrete and Continuous Time for the Bradway–McArdle Study (M1 & M2: =
1 for all j and i; M3:
2, 3, 2, 3, 2 for j = 1, …, 5 and all i; M4:
Accounting for Individual Age of Participant)
Results are given in . As before, the DCM with latent change scores (M1) and the reformulation as an ARCL model (M2) yield identical results. Interestingly, however, the results of the CT model (M3) differ slightly in terms of model fit (–2LogL = 4066.56 vs. 4065.22) and parameter estimates, which is likely due to the boundary constraint on the discrete time correlation. In all three models, the introduction of a trait (slope) factor led to a considerable change in parameter estimates. Most important, the introduction led to the expected decrease of the proportion (auto) parameter and the associated autoregressive effect [, respectively
], resulting in a stable model. As apparent from , the resulting model predicting short-term memory scores (discrete time LCS model M1 & M2) provide a much better description of the observed data than the PCM presented earlier (). The same is true for the trajectory of short-term memory development as predicted by the CT model (M5). However, as before, we hold off the discussion of this model until the next section.
FIGURE 5 Predicted trajectories of latent change score (LCS) models M1 and M2, and continuous time model M5 presented in . The gray lines represent the N = 111 observed trajectories of short-term memory as a function of age. Measurement occasions with phantom variables in the LCS models are represented by empty circles. To better see how the models differ in their prediction of early cognitive development, the figure in the lower right corner zooms into the part of the entire figure marked by the dashed rectangle.
In an attempt to avoid the boundary constraint on the correlation, we fitted a slightly different CT model (M4) in which we introduced a dynamic error term, while constraining the measurement error to zero (this is the same model that was used in the simulated Example 2, but with an additional trait factor). As a matter of fact, this model converges without problems and yields a positive definite matrix of latent variables, without the need for boundary constraints (see model M4 in ). Thus, this model is used in the following.
Cognitive Development as a Function of Measurement Occasion Versus Age
All analyses of short-term memory presented so far (discrete and continuous time analyses) were based on age-adjusted scores; that is, scores that were extrapolated into 5-year age segments. This was done for reasons of comparability because LCS models cannot handle individually varying time intervals. In addition, the development of short-term memory was modeled as a function of measurement occasion rather than age (accounting for within-occasion variation in age only by linear extrapolation but not in the actual model). To find out whether this makes a difference, we reestimated the previous CT model in terms of age instead of measurement occasion; that is, by accounting for the age of each individual at each measurement occasion (different for all j and i). To this end it was necessary to define a starting point, for which we chose the age of the youngest individual in the data set (2 years). All subsequent intervals (for all individuals) were computed as the distance in age from this reference point.
Parameter estimates and the model-predicted trajectory for the CT model without trait (slope) factor are given in and (M4). For the CT model including the trait (slope) factor, these values are given in and (M5). In particular M5 provides a theoretically and empirically sound description of the data. The estimated short-term memory score at age 2 is = 2.95, with an estimated initial variance
= 21.11, a predicted average trajectory of
, for t ≥ 2, a dynamic error variance
= 56.47, a trait (slope) variance
= 1.16, and a covariance
= –1.30. Apart from the nonsignificant covariance between I and S, all parameter estimates are significant.
Discussion of the Empirical Example
The goal of this article is to (a) demonstrate the close relationship between LCS and CT models, and (b) point out some differences. In line with this goal, the empirical example has shown that LCS and CT models might yield similar results (similarly bad in the case of the PCM [] or similarly good in the case of the DCM []) if the time of measurement is adequately accounted for. However, even if great care is taken to adequately account for differences in time intervals, as the number of different time intervals increases (e.g., when analyzing cognitive development as a function of individual age instead of measurement occasion), there are certain limits to what can be done with LCS models. Because there are no such restrictions in CT models, results will begin to diverge between the two approaches. By computing age-adjusted scores via linear extrapolation of the data within occasions to the average age before linearly extrapolating across occasions into 5-year age segments and by the use of phantom variables, the authors of the original study took great care to meet the assumption of equal time intervals in the LCS analysis (McArdle & Hamagami, Citation2004). Accordingly, LCS and CT model results are similar in this empirical example. In fact, both yield identical estimates and fit indices if the analysis is done in terms of few discrete measurement occasions (compare M1, M2, and M3 in and M1, M2, and M3 in ). However, even in this example results diverge if the analysis is done in terms of age. This is particularly true for early cognitive development: As apparent from , the average LCS model-predicted short-term memory score between the age of 2 and 7.5 years is 12.9 (first solid dot in ). In contrast, the CT model predicts a continuous nonlinear increase in short-term memory from 2.95 at the age of 2 to 28.26 at the age of 7.5 years.
TABLE 6 Dual Change Score Model in Discrete and Continuous Time for the Bradway-McArdle Study (M1 & M2: =
1 for all j and i; M3 & M4:
2, 3, 2, 3, 2 for j = 1, …, 5 and all i; M5:
Accounting for Individual Age of Participant)
GENERAL DISCUSSION
In psychology, the majority of models for the analysis of longitudinal data are static models. Mixed-effects models or (latent) growth curve models are two prototypical examples. Although these models are very useful in many regards, they are not suited to uncover the (causal) dynamics underlying a change process. In contrast to static models, dynamic models are less common. This is surprising, because—albeit not always under the name “dynamic models” (cf. ARCL panel models)—dynamic models have a long history in the social sciences (McArdle, Citation2009). However, it was not until the introduction of LCS models that a constant increase in substantive applications of dynamic models in the psychological literature occurred (e.g., Bielak, Gerstorf, Kiely, Anstey, & Luszcz, Citation2011; Emery, Finkel, & Pedersen, Citation2012; Gerstorf, Lövdén, Röcke, Smith, & Lindenberger, Citation2007; Ghisletta & Lindenberger, Citation2003, Citation2004, Citation2005; Sargent-Cox, Anstey, & Luszcz, Citation2012).
The question of whether time in dynamic models should be treated continuously or discretely has an equally long history (e.g., Arminger, Citation1986; Bergstrom, Citation1988; Coleman, Citation1968; Oud & Folmer, Citation2011; Tuma & Hannan, Citation1984). However, only recently have CT models begun to diffuse into the psychological literature (Oud & Delsing, Citation2010; Oud & Jansen, Citation2000; H. Singer, Citation2012; Voelkle et al., Citation2012).
At the most general level, the purpose of this article was thus to push both trends by unifying the development of LCS models with the development of CT models. Both classes of models are extremely powerful because they allow us to address key objectives in longitudinal research (Baltes & Nesselroade, Citation1979; McArdle & Hamagami, Citation2001) including questions regarding the dynamic development and interplay between psychological constructs over time. At a more specific level, the purpose of this article was to provide a mathematical, conceptual, and empirical comparison of three different dynamic models: the PCM, the DCM, and the CT model (as well as different variants thereof).
Commonalities and Differences of Latent Change Score and Continuous Time Models
All three models are dynamic models that predict the rate of change. As demonstrated in this article, they can all be reformulated as ARCL panel models. They differ, however, in the definition of the rate of change and in the constraints needed for the reformulation. Conceptually, LCS models assume a change process that takes place from one discrete measurement occasion to the next. The change process does not operate between the observed time points. In contrast, CT models assume that change is a continuous process, and that we only happen to observe it at certain discrete occasions. Once these observations are made, we can try to reconstruct the generating mechanism (which also operates between the observed measurement occasions). Mathematically, CT models are stochastic differential equations that predict the derivative of a process with respect to time, whereas LCS models approximate the derivative by a difference equation over successive discrete time intervals. The link between the two becomes most obvious when putting the solution of the CT differential equation for the auto-effect in power series expansion (Equation 10). In contrast to the CT model, which provides an exact solution, the LCS uses the first two terms to approximate the entire series. The difference is even more striking when considering the dynamic error term. Whereas CT models assume an underlying Wiener process, LCS models assume discrete time error terms with .
As long as time intervals are equal across all measurement occasions and across all individuals ( for all j and i), LCS and CT models show the same model fit and yield identical discrete time parameters. Also, the data requirements in terms of the number of variables and individuals are identical, allowing LCS and CT analyses with most available longitudinal data sets. Even if intervals are equal, however, the approaches differ in their estimates of the underlying CT parameters. The same applies for different observed intervals if phantom variables can be used to create artificially equal intervals. If there are too many different intervals for phantom variables to offer a solution, three different possibilities remain: (a) ignoring the length of the time intervals, (b) using definition variables to account for differing time intervals, or (c) the use of CT models. In this article, we have demonstrated, by means of simulated and empirical data, that only the latter is a viable solution.
Limitations and Future Directions
At first sight, a disadvantage of LCS and CT models might be that they are mathematically somewhat more challenging than other models for longitudinal data analysis. This is particularly true for CT models. However, as development in CT modeling and CT software takes place, it will become easier to specify and estimate such models. Given the increasing popularity of LCS models, we are optimistic that researchers will begin to consider other dynamic models, too, and we hope this article can serve as a first step in this direction.
Maybe more critically, McArdle and Hamagami (Citation2004) reported “mathematical and statistical difficulties using [LCS] models with […] sparse longitudinal data” (p. 327)—we experienced similar problems. As demonstrated in this article, CT models overcome problems due to sparse data, but this advantage comes at the price of more complicated, nonlinear, parameter constraints. Especially the matrix exponential constraint makes parameter estimation more difficult and more dependent on good starting values. However, the recently proposed procedure of “oversampling” (H. Singer, Citation2012) could offer at least partial a solution to this problem (see also Voelkle & Oud, Citation2013).
Another limitation of this article is that we did not discuss all possible variants of LCS and CT models. As a matter of fact, the LCS and CT models we were dealing with in this article represent just two popular representatives of a much broader class of analytic techniques for dynamical systems in discrete and continuous time (cf. Boker & Wenger, Citation2007). For example, we did not discuss the bivariate DCM with trait variables, or the introduction of additional predictors. An external “shock,” such as a highly emotionally evoking situation, could change an otherwise continuous development (of affect) almost instantaneously and would have to be included as an exogenous input variable or else parameter estimates will be incorrect. However, even though these are all important extensions, the basic arguments set forth in this article remain valid. We also did not discuss the specification of additional growth factors (e.g., freely estimated factor loadings of the latent trait), resulting in a combination of dynamic and static models (Bollen & Curran, Citation2004; Oud, Citation2010; Voelkle, Citation2008).
As already pointed out by Coleman (Citation1968) “there are at least two fundamental cases in the application of calculus to the study of change” (p. 431): the study of changes in a quantity and the study of changes in a state. By assuming continuous variables that develop continuously over time, we limited ourselves to the former in this article. However, by applying the same tool of calculus to the probability of being in a given state, we could also model the rate of change of the probability with respect to time (Coleman, Citation1968, p. 432). Facilitated by recent advances in latent variable modeling, such as SEM-based CT survival analysis (Asparouhov, Masyn, & Muthén, Citation2006), future research could profit from a combination of the two.
Finally, we did not discuss issues related to the design of longitudinal studies. All models presented in this article were discussed from the perspective of how they would be used for the analysis of existing data. However, conceiving of different time intervals not as a statistical problem but rather as a source of information holds many advantages. For example, McArdle and Woodcock (Citation1997) demonstrated how varying time intervals in a “time-lag” design can be used to separate different psychometric components of developmental interest. Likewise, Voelkle and Oud (Citation2013) showed how individually varying time intervals might help in the estimation of oscillating processes when the sampling rate, as compared to the frequency of oscillation, is low. Furthermore, we only indirectly addressed the issue of missing values in longitudinal studies. A missing value in an LCS model transforms into an unequal measurement interval in a CT model. From a CT perspective, missing values do not exist in longitudinal studies. Rather, the task is to reconstruct an underlying CT process based on limited information, which is obtained from a few existing measurement occasions (and an infinite number of missing measurement occasions). A more detailed discussion of the advantages of this perspective will be given elsewhere.
Despite its limitations in depth and scope, we hope this article appeals to three different audiences: first, readers familiar with LCS models who want to learn more about their relationship to CT models and how the latter might overcome some of the limitations of the former; second, readers familiar with CT models—as they are more common in the econometric literature—who want to learn more about their relationships to dynamic (LCS) models used in psychology; and finally, readers who are neither familiar with CT nor with LCS models. We hope the article might serve as an inspiration to learn more about dynamic approaches to modeling longitudinal data.
ACKNOWLEDGMENTS
We thank Jack McArdle and Fumiaki Hamagami for the suggestion to use the Bradway–McArdle data as an empirical example, for providing us with the data, and for their help in the data preparation. We are grateful to Julia Delius for editorial assistance and Florian Schmiedek for his comments on an earlier draft and the always interesting discussions on longitudinal models in psychological research.
Notes
1 This is already apparent from the very definition of a cause–effect relationship, which requires that the cause precedes the effect in time.
2 To stay consistent with the existing literature on the use of SEM to represent (continuous time) state–space models (e.g., Chow, Ho, Hamaker, & Dolan, Citation2010; Oud & Jansen, Citation2000; Voelkle et al., Citation2012), we deviate from the notation used by McArdle (Citation2009), following roughly the LISREL notation. For multiple variables, we could thus use matrix notation to represent the relationship between latent and manifest variables, with being the factor loading matrix, and
a vector of intercepts, resulting in the well-known measurement model (Bollen, Citation1989):
3 By this we mean that in LCS models, the change of the dynamic error term over interval
is only defined under the assumption of
so that
. As will be shown later on, the continuous time model does not depend on this—usually unrealistic—assumption.
4 The approximation is also known as the “rectangle” approximation (Oud, Citation2007a, p. 27). Voelkle et al. (Citation2012) described it as an “intuitive” approach to CT modeling.
5 Although LCS models can be estimated with most SEM software packages, to the best of our knowledge at present only OpenMx (Boker et al., Citation2011) and Mx (Neale, Boker, Xie, & Maes, Citation2003) allow the user to implement the matrix exponential constraint necessary for continuous time modeling.
6 For reasons of simplicity, time intervals were rounded to two decimal places, thus the actual number of different time intervals might be somewhat lower.
Related Research Data
REFERENCES
- Arminger, G. (1986). Linear stochastic differential equations for panel data with unobserved variables. Sociological Methodology, 16, 187–212.
- Asparouhov, T., Masyn, K., & Muthén, B. (2006). Continuous time survival in latent variable models. In 2006 Proceedings of the American Statistical Association, Biometrics Section (pp. 180–187). Alexandria, VA: American Statistical Association.
- Baltes, P. B., & Nesselroade, J. R. (1979). History and rationale of longitudinal research. In J. R. Nesselroade & P. B. Baltes (Eds.), Longitudinal research in the study of behavior and development (pp. 1–39). New York, NY: Academic.
- Bartlett, M. S. (1946). On the theoretical specification and sampling properties of autocorrelated time-series. Journal of the Royal Statistical Society, 7(Suppl.), 27–41.
- Bergstrom, A. R. (1988). The history of continuous-time econometric models. Econometric Theory, 4, 365–383.
- Bielak, A. A., Gerstorf, D., Kiely, K. M., Anstey, K. J., & Luszcz, M. (2011). Depressive symptoms predict decline in perceptual speed in older adulthood. Psychology and Aging, 26, 576–583.
- Boker, S. M., Neale, M., Maes, H., Wilde, M., Spiegel, M., Brick, T., Spies, J., Estabrook, R., Kenny, S., Bates, T., Mehta, P., & Fox, J. (2011). OpenMx: An open source extended structural equation modeling framework. Psychometrika, 76, 306–317. doi:10.1007/S11336-010-9200-6
- Boker, S. M., & Wenger, M. J. (Eds.). (2007). Data analytic techniques for dynamical systems. Mahwah, NJ: Erlbaum.
- Bollen, K. A. (1989). Structural equations with latent variables. New York, NY: Wiley.
- Bollen, K. A., & Curran, P. J. (2004). Autoregressive latent trajectory (ALT) models: A synthesis of two traditions. Sociological Methods & Research, 32, 336–383. doi:10.1177/0049124103260222
- Bollen, K. A., & Curran, P. J. (2006). Latent curve models: A structural equation perspective. Hoboken, NJ: Wiley.
- Bradway, K. P., & Thompson, C. W. (1962). Intelligence at adulthood: A twenty-five year follow-up. Journal of Educational Psychology, 53, 1–14. doi:10.1037/h0045764
- Chow, S.-M., Ho, M.-h. R., Hamaker, E. L., & Dolan, C. V. (2010). Equivalence and differences between structural equation modeling and state-space modeling techniques. Structural Equation Modeling, 17, 303–332. doi:10.1080/10705511003661553
- Coleman, J. S. (1968). The mathematical study of change. In H. M. Blalock & A. Blalock (Eds.), Methodology in social research (pp. 428–478). New York, NY: McGraw-Hill.
- Duncan, T. E., Duncan, S. C., & Strycker, L. A. (2006). An introduction to latent variable growth curve modeling: Concepts, issues, and applications (2nd ed.). Mahwah, NJ: Erlbaum.
- Du Toit, S., & Browne, M. W. (2001). The covariance structure of a vector ARMA time series. In R. Cudeck, S. du Toit, & D. Sörbom (Eds.), Structural equation modeling: Present and future—A festschrift in honor of Karl Jöreskog (pp. 297–314). Lincolnwood, IL: Scientific Software International.
- Emery, C. F., Finkel, D., & Pedersen, N. L. (2012). Pulmonary function as a cause of cognitive aging. Psychological Science, 23, 1024–1032. doi:10.1177/0956797612439422
- Gerstorf, D., Lövdén, M., Röcke, C., Smith, J., & Lindenberger, U. (2007). Well-being affects changes in perceptual speed in advanced old age: Longitudinal evidence for a dynamic link. Developmental Psychology, 43, 705–718. doi:10.1037/0012-1649.43.3.705
- Ghisletta, P., & Lindenberger, U. (2003). Age-based structural dynamics between perceptual speed and knowledge in the Berlin Aging Study: Direct evidence for ability dedifferentiation in old age. Psychology and Aging, 18, 696–713.
- Ghisletta, P., & Lindenberger, U. (2004). Static and dynamic longitudinal structural analyses of cognitive changes in old age. Gerontology, 50, 12–16.
- Ghisletta, P., & Lindenberger, U. (2005). Exploring structural dynamics within and between sensory and intellectual functioning in old and very old age: Longitudinal evidence from the Berlin Aging Study. Intelligence, 33, 555–587. doi:10.1016/j.inte11.2005.07.002
- Gulliksen, H. (1950). Theory of mental tests. New York, NY: Wiley.
- Halaby, C. N. (2004). Panel models in sociological research: Theory into practice. Annual Review of Sociology, 30, 507–544.
- Hamagami, F., & McArdle, J. J. (2001). Advanced studies of individual differences linear dynamic models for longitudinal data analysis. In G. A. Marcoulides & R. E. Schumacker (Eds.), New developments and techniques in structural equation modeling (pp. 203–246). Mahwah, NJ: Erlbaum.
- Hox, J. (2010). Multilevel analysis: Techniques and applications (2nd ed.). New York, NY: Routledge.
- Jöreskog, K. G. (1970). Estimation and testing of simplex models. British Journal of Mathematical and Statistical Psychology, 23, 121–145. doi:10.1111/j.2044-8317.1970.tb00439.x
- Jöreskog, K. G., & Sörbom, D. (1977). Statistical models and methods for analysis of longitudinal data. In D. J. Aigner & A. S. Goldberger (Eds.), Latent variables in socioeconomic models (pp. 285–325). Amsterdam, The Netherlands: North Holland.
- Lord, F. M., & Novick, M. R. (1968). Statistical theories of mental test scores. Reading, MA: Addison-Wesley.
- McArdle, J. J. (1986). Latent variable growth within behavior genetic models. Behavior Genetics, 16, 163–200.
- McArdle, J. J. (2001). A latent difference score approach to longitudinal dynamic structural analysis. In R. Cudeck, S. Du Toit, & D. Sörbom (Eds.), Structural equation modeling: Present and future (pp. 342–380). Lincolnwood, IL: Scientific Software International.
- McArdle, J. J. (2009). Latent variable modeling of differences and changes with longitudinal data. Annual Review of Psychology, 60, 577–605. doi:10.1146/annurev.psych.60.110707.163612
- McArdle, J. J., & Hamagami, F. (2001). Latent difference score structural models for linear dynamic analyses with incomplete longitudinal data. In L. Collins & A. Sayer (Eds.), New methods for the analysis of change (pp. 139–175). Washington, DC: APA Press.
- McArdle, J. J., & Hamagami, F. (2004). Methods for dynamic change hypotheses. In K. van Montfort, J. H. L. Oud, & A. Satorra (Eds.), Recent developments on structural equation models (pp. 295–335). Dorderecht, The Netherlands: Kluwer.
- McArdle, J. J., Hamagami, F., Meredith, W., & Bradway, K. P. (2000). Modeling the dynamic hypotheses of Gf–Gc theory using longitudinal life-span data. Learning and Individual Differences, 12, 53–79. doi:10.1016/s1041-6080(00)00036-4
- McArdle, J. J., & Woodcock, R. W. (1997). Expanding test–retest designs to include developmental time-lag components. Psychological Methods, 2, 403–435. doi:10.1037/1082-989x.2.4.403
- Mehta, P. D., & Neale, M. C. (2005). People are variables too: Multilevel structural equation modeling. Psychological Methods, 10, 259–284.
- Meredith, W., & Tisak, J. (1990). Latent curve analysis. Psychometrika, 55, 107–122.
- Muthén, L. K., & Muthén, B. O. (1998–2012). Mplus user’s guide (7th ed.). Los Angeles, CA: Muthén & Muthén.
- Neale, M. C., Boker, S. M., Xie, G., & Maes, H. H. (2003). Mx: Statistical modeling (6th ed.). Richmond, VA: Department of Psychiatry, Virginia Commonwealth University.
- Oud, J. H. L. (2007a). Comparison of four procedures to estimate the damped linear differential oscillator for panel data. In K. van Montfort, J. H. L. Oud, & A. Satorra (Eds.), Longitudinal models in the behavioral and related sciences (pp. 19–39). Mahwah, NJ: Erlbaum.
- Oud, J. H. L. (2007b). Continuous time modeling of reciprocal relationships in the cross-lagged panel design. In S. M. Boker & M. J. Wenger (Eds.), Data analytic techniques for dynamical systems (pp. 87–129): Mahwah, NJ: Erlbaum.
- Oud, J. H. L. (2010). Second-order stochastic differential equation model as an alternative for the ALT and CALT models. Advances in Statistical Analysis, 94, 203–215. doi:10.1007/s10182-010-0131-4
- Oud, J. H. L., & Delsing, M. J. M. H. (2010). Continuous time modeling of panel data by means of SEM. In K. van Montfort, J. H. L. Oud, & A. Satorra (Eds.), Longitudinal research with latent variables (pp. 201–244). New York, NY: Springer.
- Oud, J. H. L., & Folmer, H. (2011). Modeling oscillation: Approximately or exactly? Multivariate Behavioral Research, 46, 985–993.
- Oud, J. H. L., & Jansen, R. A. R. G. (2000). Continuous time state space modeling of panel data by means of SEM. Psychometrika, 65, 199–215. doi:10.1007/BF02294374
- Pinheiro, J. C., & Bates, D. M. (2000). Mixed-effects models in S and S-plus. New York, NY: Springer.
- R Development Core Team. (2012). R: A language and environment for statistical computing. Vienna, Austria: R Foundation for Statistical Computing.
- Rindskopf, D. (1984). Using phantom and imaginary latent variables to parameterize constraints in linear structural models. Psychometrika, 49, 37–47. doi:10.1007/bf02294204
- Sargent-Cox, K. A., Anstey, K. J., & Luszcz, M. A. (2012). The relationship between change in self-perceptions of aging and physical functioning in older adults. Psychology and Aging, 27, 750–760. doi:10.1037/a0027578
- Simon, H. A. (1952). A formal theory of interaction in social groups. American Sociological Review, 17, 202–211. doi:10.2307/2087661
- Singer, H. (2012). SEM modeling with singular moment matrices. Part II: ML-estimation of sampled stochastic differential equations. Journal of Mathematical Sociology, 36, 22–43. doi:10.1080/0022250x.2010.532259
- Singer, J. D., & Willett, J. B. (2003). Applied longitudinal data analysis: Modeling change and event occurrence. New York, NY: Oxford University Press.
- Tuma, N. B., & Hannan, M. T. (1984). Social dynamics: Models and methods. Orlando, FL: Academic.
- Voelkle, M. C. (2008). Reconsidering the use of autoregressive latent trajectory (ALT) models. Multivariate Behavioral Research, 43, 564–591. doi:10.1080/00273170802490665
- Voelkle, M. C., & Oud, J. H. L. (2013). Continuous time modelling with individually varying time intervals for oscillating and non-oscillating processes. British Journal of Mathematical and Statistical Psychology, 103–126. doi:10.1111/j.2044-8317.2012.02043.x
- Voelkle, M. C., Oud, J. H. L., Davidov, E., & Schmidt, P. (2012). An SEM approach to continuous time modeling of panel data: Relating authoritarianism and anomia. Psychological Methods, 17, 176–192. doi:10.1037/a0027543
- Zadeh, L. A., & Desoer, C. A. (1963). Linear system theory: The state space approach. New York, NY: McGraw-Hill.