
Article title: Enhanced cytotoxicity of a redox-sensitive hyaluronic acid-based nanomedicine toward different oncocytes via various internalization mechanisms
Authors: Du, Y., Wang, S., Zhang, T., He, D., Tu, J., & Shen, Y.
Journal: Drug Delivery
Bibliometrics: Volume 27, Number 01, pages 128–136
DOI: 10.1080/10717544.2019.1709919
When this article was first published online there were errors in Figures 2 and 7 as detailed below:
1. The WAXRD of PTX and PTX + HA-TOS in Figure 2(D) was misused and the caption of Figure 2(D) should be the WAXRD instead of WARD. The correct Figure 2 and caption are shown below.
Figure 2. (A) TEM image of the HA-ss-TOS-PTX micelles. (B) TEM image of the HA-TOS-PTX micelles. (C) DSC curves of PTX, HA-ss-TOS, the physical mixture of PTX and HA-ss-TOS, and HA-ss-TOS-PTX. (D) WAXRD of PTX, the physical mixture of PTX and HA-ss-TOS, HA-ss-TOS-PTX, the physical mixture of PTX and HA-TOS, HA-TOS-PTX. (E) Fluorescence intensity of pyrene in the presence of different concentrations of GSH: (a) HA-ss-TOS without GSH; (b) HA-ss-TOS with 10 mM GSH; (c) HA-ss-TOS with 20 mM GSH; and (d) HA-TOS with 20 mM GSH.
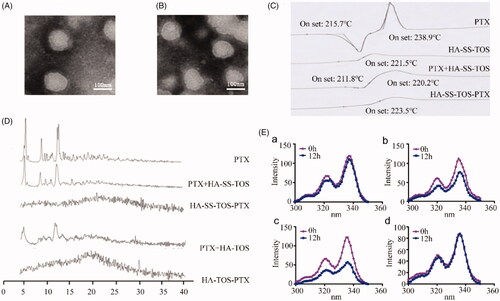
Figure 7. (A) In vivo imaging of DiR-loaded formulations in 4T1 tumor-bearing mice. Tumor sites were marked by pink circles. (B) Ex vivo imaging of the isolated organs in mice. (C) The change of PTX concentration over a period of time (n = 5).
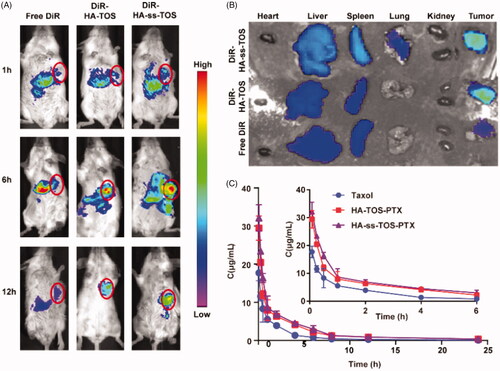
2. Some mistakes were found in the in vivo imaging in Figure 7(A). The correct Figure 7 is presented below.
These figures have been updated in the online article.