
 ?Mathematical formulae have been encoded as MathML and are displayed in this HTML version using MathJax in order to improve their display. Uncheck the box to turn MathJax off. This feature requires Javascript. Click on a formula to zoom.
Abstract
This study aimed to illustrate the use of D-optimal mixture design (DOMD) for optimization of an enhancer containing Dapsone niosomal formula for acne topical treatment. Mixture components (MixCs) studied were: Span 20, Cholesterol, and Cremophor RH. Different responses were measured. Optimized formula (OF) was selected to minimize particle size and maximize absolute zeta potential and entrapment efficiency. Optimized formula gel (OF-gel) was prepared and characterized. OF-gel in vivo skin penetration using confocal laser scanning microscopy and activity against Cutibacterium acnes in acne mouse model were studied. Based on DOMD results analysis, adequate models were derived. Piepel and contour plots were plotted accordingly to explain how alteration in MixCs L-pseudo values affected studied responses and regions for different responses’ values. The OF had suitable predicted responses which were in good correlation with the actually measured ones. The OF-gel showed suitable characterization and in vivo skin penetration up to the dermis layer. In vivo acne mouse-model showed that OF-gel-treated group (OF-gel-T-gp) had significantly better recovery (healing) criteria than untreated (UT-gp) and Aknemycin®-treated (A-T-gp) groups. This was evident in significantly higher reduction of inflammation percent observed in OF-gel-T-gp than both UT-gp and A-T-gp. Better healing in OF-gel-T-gp compared with other groups was also verified by histopathological examination. Moreover, OF-gel-T-gp and A-T-gp bacterial loads were non-significantly different from each other but significantly lower than UT-gp. Thus, DOMD was an adequate statistical tool for optimization of an appropriate enhancer containing Dapsone niosomal formula that proved to be promising for topical treatment of acne.
1. Introduction
Many drugs have metabolic and gastrointestinal problems when taken orally, and therefore other drug delivery routes are taken into consideration to overcome these challenges. Topical drug delivery is a good alternative in which the drug bioavailability to site of action can be improved and its side effects can be decreased. Furthermore, patient acceptance and drug targeting are obviously increased with topical drug application. Physicians nowadays are showing growing interest in prescribing topical delivery systems rather than conventional systems (Master et al., Citation2010).
Using nano-vesicular systems for topical application has gained growing interest over the years. They increase drug solubility and prolong its release and accordingly enable dose reduction with subsequent decrease of drug side effects. Niosomes are nonionic surfactant-based nanovesicles which outweigh the parent liposomes nanovesicular system by being more chemically stable and more economic with higher skin penetrability (Goyal et al., Citation2015; Fetih, Citation2016). Also, niosomes have the ability to improve the drug residence time in the epidermis and stratum corneum and reduce the systemic absorption of the drug at the same time. Moreover, niosomes when applied topically can reduce the loss of trans-epidermal water and replenish the skin lipids and subsequently improve the properties of the horny layer and increase the smoothness (Manconi et al., Citation2006). Budhiraja & Dhingra (Citation2015) proved that gel containing antimicrobial-loaded niosomes is effective for acne vulgaris treatment by enhancing the time and amount of drug retention within the skin and improve the therapeutic efficacy of the drug.
Dapsone (a sulfone class drug) which was discovered in 1908 has a bacteriostatic action and an anti-inflammatory activity in diseases characterized by abnormal accumulation of neutrophils (Sago & Hall, Citation2002). For these reasons, Dapsone can be used in the treatment of acne which affects most of the teenagers. It can alleviate symptoms associated with this skin disease (Draelos et al., Citation2007). Unfortunately, its oral use is limited due to its low water solubility and harmful side effects like hemolytic anemia, headache, and nausea (Pickert & Raimer, Citation2009). Topical delivery of Dapsone removes all barriers that complicate its oral use and at the same time facilitates application to the patients (Schneider-Rauber et al., Citation2020). Although Allergan Company produces Dapsone gel 7.5% (ACZONE® Gel), yet it is expensive enough to trigger researchers for searching for new formulations. Shamma et al. (Citation2019) prepared Dapsone gel after complexation of Dapsone with cyclodextrin. Also, other literature showed formulation of topical Dapsone by different techniques (El-Nabarawi et al., Citation2018, Citation2020).
We think that using a Dapsone niosomal formula especially a one containing an enhancer (Cremophor RH) will lead to intercellular drug accumulation with better treatment outcomes. Also, we think that ordinary statistical designs such as different factorial or response surface designs are inappropriate enough for studying variables which are essentially components of a mixture. Thus, this research aimed at optimization of an enhancer containing Dapsone niosomal formula with predetermined characters using D-optimal mixture design. The activity of this formula would be tested in vivo for topical treatment of Cutibacterium acnes infected BALB/c mice.
2. Theoretical development
Formula optimization based on statistical experimental design and modeling methods conserves much effort and time and leads to more concrete results. Parent factorial designs and successor response surface designs such as: central composite designs and Box–Behnken designs have been used in many researches for multivariable formulations (Habib et al., Citation2008, Citation2014; Said et al., Citation2018; Younes et al., Citation2018). A fact to be considered is that in these designs the change in levels of one independent variable should not affect any other one. In reality, many cases are encountered where the variables needed to be studied are amounts of different ingredients. Here, the alteration in the amount of any variable means an alteration in the relative amounts of other variables in the whole formula. Hence, the importance of mixture designs appears. In this class of designs, the factors are essentially mixture components (MixCs) and the experimental space is all the points for which (
are proportions of the q components of a mixture). Each MixC proportion has a value from zero to one (Cornell, Citation2002; Mason et al., Citation2003; Armstrong, Citation2006). If no limits are imposed on any of the studied MixCs, the experimental space has a regular simplex shape with q vertices and q − 1 dimensions (Cornell, Citation2002; Armstrong, Citation2006). Thus, the experimental space for a three component mixture for example is represented by a ternary diagram. If one or more of the MixCs has lower limits, the experimental space shape does not change. Yet if upper limits or both upper and lower limits are imposed on the studied MixCs, this alters the experimental space shape into a polyhedral (Armstrong, Citation2006; Voinovich et al., Citation2009). A regression polynomial equation is usually elucidated to represent how the MixCs affect each studied dependent variable (response). The most frequently used models for a three component mixture design are (Habib & AbouGhaly, Citation2016):
(1)
(1)
(2)
(2)
(3)
(3)
where
is a certain predicted response, the βi, βij, and β123 are the coefficients representing, respectively, the linear, quadratic, and special-cubic blending properties of the three MixCs (xi).
MixCs can be represented by three different scales: actual, real, and pseudo scales (lower and upper pseudo scales). The original amounts of each MixC represent the actual scale. Real scale is when MixCs are expressed as proportions taking any values between 0 and 1 (summing to 1). The real scale is calculated by dividing the actual amount of each component by the total amount of the mixture. The pseudo scale (upper and lower) is the scale of choice for simplification of calculations, where the range of each MixC is fixed to be from 0 to 1. The L-pseudo components are used in this research and calculated as (Ranpise et al., Citation2014):
(4)
(4)
where
is the L-pseudo value of component i,
is the real value of component i, and Li is the lower bound of component i (i = 1, 2, ……, q).
Data transformation is the application of a mathematical function to all the values of a response and is sometimes needed for better data modeling (Montgomery, Citation2013). George Box and David Cox incubated a technique to identify whether a transformation is needed and what the suitable exponent (λ) to use is (Box and Cox, 1964). The Design Expert® software suggests type and exponent of recommended transformation, if any (Pat & Wayne Citation2014; Nageeb El-Helaly et al., Citation2018).
3. Experimental
3.1. Materials
Dapsone, Cholesterol, Span 20, and Rhodamine B dye were purchased from Sigma-Aldrich Co., St. Louis, MO, USA. Chloroform, methanol, sodium lauryl sulfate, carbopol 945, triethanolamine (TEA), disodium hydrogen phosphate, and potassium dihydrogen phosphate were purchased from Adwic, El Nasr Pharmaceutical Chemicals Co., Abu Zaabal, Egypt. Cremophor RH was purchased from BASF Co. (Florham Park, NJ). Spectra/PoreVR dialysis membrane 12,000–14,000 molecular weight cut off was from Spectrum Laboratories Inc., Rancho Dominguez, CA. Tissue-Tek® O.C.T. Compound gel was from Sakura Finetek, USA. Aknemycin® ointment containing 2% erythromycin manufactured by Medical Union Pharmaceuticals (Ismailia, Egypt under license from Almirall Hermal, Germany) was purchased from a local pharmacy (Cairo, Egypt).
3.2. Application of D-optimal mixture design for niosomes preparation
In this research, Dapsone niosomes containing an enhancer (Cremophor RH) were to be optimized. Different niosomal formulae were to be prepared by film evaporation technique. As the variables to be studied were in fact components of the mixture to be evaporated, using a mixture statistical design seemed to be the suitable choice.
The three components of the film-forming mixture to be investigated as MixCs were: Span 20, Cholesterol, and Cremophor RH. Preliminary experiments were used to identify the suitable ranges of MixCs, amount of drug, and values of other experimental conditions which were kept constant. Upper and lower constraints were put on the MixCs so that each mixture contains all the three MixCs. Equal ranges were designated for each MixC, so the resulting experimental space was a sub-region within a simplex, but keeping a regular simplex shape as shown in . The actual investigated ranges of MixCs with their real, and L-pseudo-coded values and the responses with their required constraints are shown in .
Figure 1. (a) The experimental region of Mixture components defined by the constraints: 160 ≤ A ≤ 220, 40 ≤ B ≤ 100 and 60 ≤ C ≤ 120, where A = Span 20 amount (mg), B = Cholesterol amount (mg), and C = Cremophor RH amount (mg), (b) Design points over the constrained mixture region; where: o single trial, ● replicated trial, and □ optimized formula.
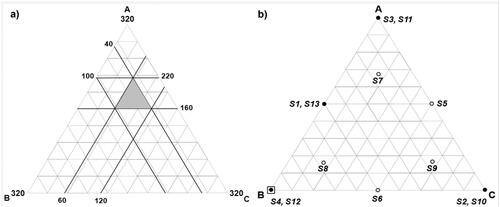
Table 1. (a) Mixture components with their constraints expressed in different values and responses with their targeted constraints.
A D-optimal mixture design minimizing the variance associated with the regression coefficient estimates for the elucidated models was used for design points’ selection (Montgomery, Citation2013). The model was built using Design Expert® software (Version 7.0.0, Stat-Ease Inc., Minneapolis, MN) (DX). A total of 13 trials were to be performed (nine different design points and four replicates). This offers 12 degrees of freedom (df) for elucidation of up to eight terms supporting up to a full quadratic model (five terms) with extra 3 df for lack of fit calculation. DX was used to analyze the resulting data by elucidation of a suitable regression model for each response describing how it is affected by the MixCs. Significance level was set at α = 0.05. The 13 trials (S1–S13) are shown in and listed in . The preparation and characterization of the different trials were done in random order.
3.3. Preparation of dapsone niosomes
Dapsone niosomes were prepared by the conventional thin film hydration sonication method reported by Bangham et al. (Citation1965) with slight modifications. Specific amounts of Span 20, Cholesterol, Cremophor RH, and drug were dissolved in 9 mL of 2:1 methanol: chloroform mixture using bath sonicator (Crest Ultrasonics Corp., Trenton, USA) for 3 min. The resultant solution was then transferred to the 1-L round bottomed flask of a rotary evaporator (Rotary evaporator RE300P, Stuart, Staffordshire, UK) for evaporation of solvents under vacuum. Evaporation under vacuum lasted for 10 min at 60 °C. The residual film was then hydrated to 10 mL using double distilled water containing 0.01% sodium lauryl sulfate by rotation at 60 °C for 20 min under atmospheric pressure. The prepared niosomal suspension was then sonicated for 5 min for size reduction (Habib et al., Citation2018). All the prepared niosomes were then stored in the refrigerator (4 °C) for 24 h before further characterization.
3.4. Characterization of dapsone niosomes
3.4.1. Particle size (PS), polydispersity index, (PDI) and zeta potential (ZP)
PS, PDI, and ZP of the prepared niosomes were determined as described before by El-Helaly et al. (Nageeb El-Helaly et al., Citation2018).
3.4.2. Drug entrapment efficiency percent (EE)
EE was calculated after quantifying the un-entrapped Dapsone amount using the ultracentrifugation technique (Habib et al., Citation2018). The un-entrapped Dapsone was separated from the prepared niosomes by ultracentrifugation at 20,000 rpm for an hour at 4 °C using an ultra-cooling centrifuge (Sigma Laborzentrifugen centrifuge GmbH, Germany). Concentration of Dapsone in the aqueous supernatant was measured – after proper dilution with methanol – spectrophotometrically (Shimadzu, model UV-1601 PC, Kyoto, Japan) at λ = 295 nm. The EE was then calculated according to the following equation:
(5)
(5)
3.4.3. Transmission electron microscopy
The morphological properties of the Dapsone loaded niosomes was examined using transmission electron microscopy (TEM) (Joel JEM 1230, Tokyo, Japan) operated at 80 kV after negative staining using 2% phosphotungstic acid (Habib et al., Citation2021).
3.5. Development of optimized formula
DX was used for exploring the experimental space and selecting an optimized formula with the predetermined characters listed in .
3.6. Preparation of optimized formula gel (OF-gel)
Optimized formula gel (OF-gel) was prepared by dispersing carpobol 945 (1%) in concentrated niosomal suspension.
3.7. Characterization of OF-gel
3.7.1. Physical appearance
Homogeneity of the prepared OF-gel was tested by visual examination after its insertion in the suitable vials for any aggregates or clumps to be detected (El-Ridy et al., Citation2017).
3.7.2. Drug content
A suitable amount (75 mg) of the prepared OF-gel was diluted with methanol in a 10 ml volumetric flask and concentration of Dapsone was determined spectrophotometrically after filtration and sufficient dilution with methanol (Fahmy et al., Citation2018).
3.7.3. pH determination
About 1 ml of the prepared OF-gel was dissolved in 9 mL of distilled water to measure the pH of the gel using pH meter (Fahmy et al., Citation2018).
3.7.4. Particle size (PS), polydispersity index (PDI) and zeta potential (ZP) determination
PS, PDI, and ZP of the prepared OF-gel were determined as described before by Nageeb El-Helaly et al. (Citation2018).
3.7.5. Imaging by transmission electron microscope (TEM)
The morphological properties of the prepared OF-gel formula were examined using TEM (Joel JEM 1230, Tokyo, Japan) operated at 80 kV after suitable dilution and negative staining using 2% phosphotungstic acid (Habib et al., Citation2021).
3.7.6. Rheological study
The viscosity of the prepared OF-gel was measured using rotational cone and plate Brookfield digital viscometer (HBDV-I + CP, Middleboro, MA, USA) equipped with spindle CPE-41 at 25 ± 1 °C. The OF-gel (0.5 g) was placed in the sample holder and the applied cone speed was increased gradually from 0.5 to 100 rotations per minute (rpm) with 20-s interval while keeping the % torque within the acceptable limits of 10–100%. Values of viscosity and % torque were recorded at each rpm. Shear rate was calculated from rpm and shear stress was calculated from % torque. A graph showing changes in viscosity and shear stress with different shear rates was plotted. The power law model equation was used to assess the flow behavior of OF-gel
(6)
(6)
where τ is the shear stress (dyne/cm2), K is the consistency index (dyne/cm2.s), γ is the shear rate (s−1), and n is the flow index. In case of Newtonian systems, n value is one, while it is between zero and one for a shear thinning system and larger than one in case of a dilatant system (Farid et al., Citation2016; Said et al., Citation2017).
3.8. In vivo evaluation
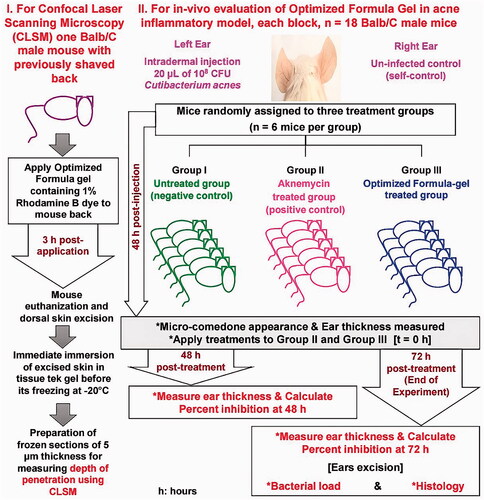
In vivo evaluation is diagrammatically represented in .
3.8.1. In-vivo skin penetration using confocal laser scanning microscopy
The in vivo skin penetration efficiency of the proposed OF-gel hydrogel was tested using Confocal Fluorescence lifetime, and images were acquired using the FLIM system (ALBA v5 from ISS). The OF-gel loaded with 1% Rhodamine B dye was applied to the dorsal previously shaved skin of BALB/c mouse for 3 h. After this period, the excess OF-gel was removed by a thin stream of water, wiped with gauze, and then the mouse were euthanized by cervical dislocation after light anesthesia (Ahmed et al., Citation2020; Sayed et al., Citation2018). Mouse’s skin was excised, washed with normal saline, then frozen immersed in Tissue-Tek® O.C.T. Compound gel. Frozen cross sections in skin of about 5 μm in thickness were obtained using Leica CM1950 cryostat (Leica Biosystems Inc., USA), then examined. The excitation was from the laser diode 650 nm coupled with scanning module (ISS) through 448/561/640/2p nm multiband dichroic filter (Semrock, Rochester, NY, USA) to a microscope (Olympus IX71S) equipped with a U PLan 60× with a NA 1.4 Oil objective (Olympus, Waltham, MA, USA). Emission was observed through bandpass filter 650 and 698/70 (Chroma Technology, Canton, MI, USA) and detected by a GaAs fast PMTs photomultiplier detector H7422-40 (Hamamatsu, Bridgewater, NJ, USA). FLIM data were acquired using ISS A330 Fast FLIM module with n harmonics of 20 MHz laser repetition frequency. FLIM data were analyzed with Vista Vision Suite software (Vista v.204 from ISS).
3.8.2. In-vivo evaluation of OF-gel in acne inflammatory model
3.8.2.1. Animals
Adult male BALB/c mice (six weeks old, 30–35 g of weight) were purchased from Theodor Bilharz Research Institute (Giza, Egypt) and left to acclimate for at least one week prior to the start of the experiment. Mice were housed at Faculty of Pharmacy, Cairo University in a temperature-controlled environment (27 ± 1 °C) with dark/light cycle 12 h and fed ad libitum standard pellet diet and water.
3.8.2.2. Research ethics statement
Research procedures were conducted in compliance with the principles and recommendations of the Guide for the Care and Use of Laboratory Animals Association, A.V.M. All animal experiments were approved by Research Ethics Committee (REC) of the Faculty of Pharmacy, Cairo University, Egypt, protocol identification code PI (1948).
3.8.2.3. Preparation of inoculum
For testing the in vivo effectiveness of the OF-gel, an established inflammatory murine model was used based on Nakatsuji et al. (Citation2008) and our previous studies (Taleb et al., Citation2018; Shamma et al., Citation2019). Standard C. acnes (ATCC 6919) strain was anaerobically cultured on reinforced clostridial medium (RCM) agar (Oxoid Limited, Basingstoke, UK) for 48 h at 37 °C with anaerobic atmosphere generation bags (Sigma–Aldrich, St. Louis, MO, USA). Isolated colonies of C. acnes were sub-cultured in RCM broth for 48 h at 37 °C under anaerobic conditions. The bacterial suspension from the liquid sub-culture optical density at 600 nm wavelength was adjusted to 1 which is equivalent to 1011 colony forming unit (CFU)/mL checked by performing viable count, and this bacterial suspension was used for preparation of the inocula of concentration 1010 CFU/mL.
3.8.2.4. Experimental design
To induce inflammation, the left-side ears of mice were injected with 20 µl of 108 CFU C. acnes intradermally using 27 G × ½ inch needle with Hamilton syringe of 50 µL model 705 RN (Reno, NV) (Nakatsuji et al., Citation2008; Taleb et al., Citation2018). The used inoculum consistently resulted in visible micro-comedone formation and inflammation with ≥10% increase in ear thickness within 48 h of injection as measured by micrometer caliper (0–25 mm/0.001 mm). Appearance of microcomedones and ≥10% increase in ear thickness were considered as indicators of acne induction based on the previously established model (Taleb et al., Citation2018). Two separate in vivo experiments were set up at two different occasions (two blocks) (n = 6 mice/group/experiment, ntotal = 36 mice). In each experiment, mice were randomly divided into three groups; untreated (UT-gp) which acted as negative control, Aknemycin® treated (AT-gp) which acted as positive control, and OF-gel treated (OF-gel-T-gp) (Shamma et al., Citation2019). Each mouse acted as its own control by infecting its left ear, while the right ear was kept as self-control. Amount of gel used for each mouse ear was 40 mg containing either 0.8 mg of Erythromycin (AT-gp) or 0.16 mg of Dapsone (OF-gel-T-gp). After 48 h of injection, AT-gp and OF-gel-T-gp were treated epicutaneously with either Aknemycin® (positive control) or OF-gel, respectively, and observed together with UT-gp for 72 h. Checks on mice were performed where ear thickness and general health of mice were recorded. At the end of the experiment, mice were euthanized, and mice ears were excised for viable bacterial counts and histopathological assay.
3.8.2.5. Follow up of animals
Several studies have assessed the efficacy of anti-acne agents based on reduction in inflammation percent and bacterial load along with evaluation of histopathological changes in acne animal models (Nakatsuji et al., Citation2008; Budhiraja & Dhingra, Citation2015; Ryu et al., Citation2015; Taleb et al., Citation2018; Shamma et al., Citation2019).
3.8.2.5.1. Ear inflammation and micro-comedon size
Changes in ear thickness measured using micrometer caliper (0-25 mm/0.001 mm) were used as an indication of acne-induced inflammation severity. Percent inflammation reduction (Inf-Red %xt) was taken as the response variable where it was calculated for each mouse (x) at time (t) as follows:
(7)
(7)
(8)
(8)
where %Infxt is inflammation % for a certain mouse x at time t,
is the thickness of mouse x left ear at time t,
is the thickness of mouse x right ear at time t, %Infx0 is inflammation % at time of treatment application (48 h post infection). Any negative Inf-Red% was considered zero. Inf-Red%48 and Inf-Red%72 were statistically analyzed using two-way analysis of variance (ANOVA) followed by Tukey’s post hoc test for determination of homogenous groups. Alpha was set at 0.05.
3.8.2.5.2. Bacterial load in mice ears
Excised mice ears were homogenized in sterile saline using DAIHAN Homogenizer, HG-15D (DAIHAN Scientific, Korea). Homogenates were then used for estimating viable bacterial counts using plating serial dilutions method. Homogenates were cultured on RCM agar plates under the bacterial culture conditions as described above in details. Bacterial counts were expressed as CFU/mL. One-way ANOVA was used for analysis of CFU data followed by Tukey’s post hoc test for the determination of homogenous groups. Alpha was set at 0.05.
3.8.2.5.3. Histological examination
Whole excised mice ears were stored in 10% formalin solution before preparing the histological sections using paraffin method technique. All sections in ascending grades of ethanol were dehydrated, cleared in xylene, and then embedded in paraffin wax. Transverse sections (4–5 µm, thickness) were mounted on glass slides and stained with hematoxylin and eosin (H&E) stains. All stained tissue sections were examined for the evaluation of inflammatory response (Olympus BX50 microscope, Tokyo, Japan) at a magnification power of 400× (Taleb et al., Citation2018).
4. Results and discussion
4.1. Statistical design evaluation
Model evaluation showed satisfactory data. Varying all MixCs over the same range preserved the simplex shape. This simplex shape offers a less onerous investigation than in case of polyhedral mixture region (Voinovich et al., Citation2009). The standard error associated with variable coefficients in the selected design was small equal to 0.7 for A, B, and C terms and nearly equal for AB, AC, and BC (4.07, 4.07, and 3.34, respectively). Multiple correlation coefficient (Ri2) for different model terms ranged from 0.301 to 0.4056. This led to variance inflation factors (VIF) of the design points having a range of 1.45 to a maximum of 1.57. The VIF measures how much the variance of that model coefficient increases due to the lack of orthogonality in the design. If a coefficient is orthogonal to the remaining model terms, its VIF is one. VIFs exceeding 10 indicate problems due to multicollinearity. Thus, no problems due to multicollinearity exist in the selected design (Pat & Wayne, Citation2014).
High leverage experimental points, those very close to one or those with values twice that of the average, will unduly influence the model fit. At the extreme, a leverage of one indicates that the model will fit that particular point no matter what its value. Obviously this should be avoided. Leverage of a design point can be reduced by replicating it, or by adding design points. The average leverage equals the number of model terms, including the constant and block coefficients, divided by the number of experiments. In this design, the average leverage is 0.462, which equals 6 terms divided by 13 experiments. None of the design points had a leverage twice that of the average, and thus no more replicates had to be done or more design points be added (Pat & Wayne, Citation2014).
4.2. Characterization and statistical analysis results
shows the characterization results of the niosomes prepared according to the proposed statistical D-optimal mixture design. The tested trials resulted in a range of mean response values (each mean is the average of duplicate measurement of a trial). Mean PS ranged from 95.6 to 320.7 nm, mean ZP ranged from −39.4 to 0.1 mV, and mean EE ranged from 72.5 to 86.3%. Each response was analyzed individually to obtain a polynomial model describing that response as a function of MixCs. The DX statistical program suggests models based on choosing the highest order polynomial with additional significant terms and the model is not aliased. The proposed design in this study allows for the fitting of up to a quadratic model with three df for lack of fit or special cubic with only two df for lack of fit. The initial models suggested by the program were further manually improved case-by-case aiming at increasing the adjusted R2 and the prediction R2 with a non-significant model lack of fit (Gonnissen et al., Citation2008; Pat & Wayne, Citation2014; Habib & AbouGhaly, Citation2016). For each final model, a valid lack of fit test was censured by a four df pure error and a minimum of three df for lack of fit (Pat & Wayne, Citation2014).
For PS, DX initially suggested special cubic model with a very low prediction R2 (predR2) of 0.029. This very low predR2 was in line with that no transformation of data (λ = 1) led to ln residual SS outside the 95% confidence interval of the minimum ln residual SS (Pat & Wayne, Citation2014; Habib et al., Citation2018; Nageeb El-Helaly et al., Citation2018). Lambda (λ) is the power to which the response’s results are raised. Thus, DX suggested a Box-Cox power transformation with λ value of −1 (inverse transformation) (Montgomery, Citation2013). ANOVA was reapplied after this power transformation for all PS data and a special cubic model was re-suggested by DX yet with predR2 of 0.781. This was further manually improved to a reduced cubic model with predR2 of 0.936. As for ZP and EE, DX initially suggested a special cubic model with predR2 of 0.889 and a linear model with predR2 of 0.886 respectively. These models were manually improved to a reduced cubic model for ZP with predR2 of 0.978 and a reduced quadratic model for EE with predR2 of 0.903. All final models for the three responses had non-significant lack of fit. Final predictive models for the studied responses are characterized and evaluated in .
Table 1 (b). Composition and characterization of niosomes prepared according to different design points of D-optimal mixture design. Data are duplicate measurements of each trial (mean ± SD).
Table 2. (a) Coefficient estimates for different model terms appearing in the final equation for each response and their significance, together with each model’s lack of fit, type, and evaluation.
Table 2. (b) Predicted values of different responses for the optimized formula compared with the actual values of its two replicated design points (S4 and S12) together with the prediction intervals and percent deviations.
These final predictive models were used to plot response model graphs, namely Piepel’s response trace plots (Piepel’s plots) and contour plots (). Piepel’s plots and contour plots were used for illustrating the effects of MixCs on each response. The lines in Piepel’s plots represent the effects of changing each L-pseudo MixC on one of the responses, while keeping the other two MixCs’ L-pseudo values in a constant ratio as in the reference blend (Pat & Wayne, Citation2014). Each line is drawn by plotting the predicted values of this response on Y axis upon changing the L-pseudo value of the respective MixC from 0 to 1 on X-axis. The L-pseudo ratios of the other components are kept at 1:1, the same as in the reference blend containing an equal amount of each MixC (1/3, 1/3, 1/3). L-pseudo values of a MixC 0 and 1 correspond to its level at base and vertex of experimental space respectively. For each response, the lines representing the effects of different MixCs intersect at the reference blend (1/3, 1/3, 1/3). A steep slope or curvature in a line indicates a relatively high sensitivity of response to that MixC. As a result of the effects of different MixCs on each response, contour plots were plotted representing lines of equal response over the design space (Habib & AbouGhaly, Citation2016).
Figure 2. Piepel’s response trace plots – for (a) particle size, (c) zeta potential and (e) entrapment efficiency – upon changing each MixC L-pseudo value over its range keeping the ratio of the other two components constant (1:1). Contour plots showing lines of equal responses for: (b) particle size, (d) zeta potential, and (f) entrapment efficiency over the constrained mixture region.
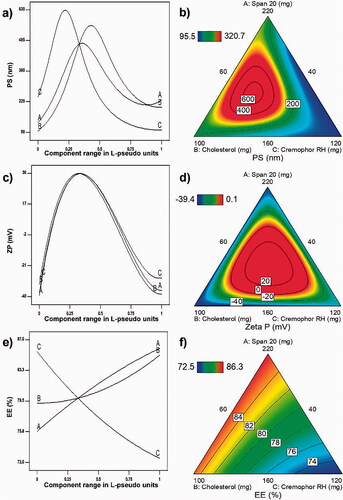
These plots make the interpretation of effects of L-pseudo MixCs more suitable than looking at the coefficients. Each MixC coefficient represents how changes in amount of this MixC will affect the response, yet this effect cannot be practically isolated from subsequent changes in amounts of other MixCs. Hence, comes the importance of the so-called mixture designs. Moreover, presence of significant interactions – even in factorial or different response surface designs where the studied factors should be independent in the sense that the variation in one of them does not affect the others – makes effects interpretation from the main effects coefficients inadequate enough.
4.3. Inference of the statistical analysis results of different MixCs
4.3.1. PS
PS is a critical factor in vesicles skin penetrability. The smaller the PS, the higher the ability of the vesicles – whatever their type – to penetrate skin layers is (Fahmy et al., Citation2019). shows the effects of studied MixCs on PS. As shown in , all MixCs have positive coefficients with respect to inverse PS and also a significant negative interaction AC existed. Yet, all studied MixCs enter in the interaction ABC with the very high negative value compared with other coefficients. This leads to the result that all lines in the Piepel’s plot () have positive parabolic shape. That is the increase in any MixC leads initially to an increase in PS till it reaches its maximum value followed by a decrease in PS with further increment in that MixC. This increase is due to the pronouncing of interaction ABC as we move toward the peak of each line. The decrease that occurs after the peak is due to fading of ABC influence as much increment in one of the MixCs will eventually be accompanied by considerable reduction in the other two. It is to be observed that the three peaks do not exist in the same point of the reference blend. This is due to the different magnitude of each positive coefficient relative to the negative ABC coefficient where MixC C has the highest main coefficient and thus the inflection in C line is the first to occur with increasing its amount; that is fading of ABC effect on MixC C happens earliest. If it was only due to main coefficients this was to be followed by MixC B having the second value in magnitude of main coefficient following MixC C, yet this was not the case. This can be explained by the presence of the other negative interaction AC. Thus, the start of PS reduction with increase in MixC A appears before that with MixC B as a result of fading of the influence of both interactions AC and ABC upon increasing MixC A. This is followed by the appearance of MixC B peak as a result of fading of influence of interaction ABC only. These combined effects of MixCs on PS appear in the contour plot in . It is observed that the highest PS lines are concentric in the experimental space approaching toward the baseline of MixC C. The low PS values are found near the margins especially near the peak of MixC C.
The initial increase in PS with the increase of span 20 amount is in agreement with Badri et al. (Badri et al., Citation2015). However, the reduction in PS with further increase in span 20 can be viewed from the point of its physical state and its HLB, as they play an important role in PS determination. Low value of HLB results in smaller PS (Bangham et al., Citation1965; Khazaeli et al., Citation2007). This is because increase in surfactant's hydrophobicity results in reduction in the surface free energy (Yoshioka et al., Citation1994). Also, surfactants which have liquid nature produce particles with smaller size compared with paste and solid surfactants (Shaker et al., Citation2017). Thus, increasing Span 20 decreases PS as it has HLB value of 8.6 and is found in liquid state. The initial increase in PS with the increase of Cholesterol amount is in agreement with Shaker et al. (Citation2017) who found that combining Cholesterol with surfactants increases significantly liposomal size. This was also in agreement with the study reported by Gugleva et al. (Citation2019) and another by Fetih (Citation2016). This may be attributed to rigidity of Cholesterol molecule and its shape which increase the width of the bilayer (Fetih, Citation2016). The reduction in PS with further increase of this MixC beyond its peak may be due to the concurrent reduction in other niosomal forming components. The initial increase in PS with increasing Cremophor RH was also observed by Abd-Elsalam et al. (Citation2018). Yet the reduction in PS with increasing Cremophor RH beyond the peak is matched with the findings of Elsheikh et al. (Citation2018). Generally, PS decreases by increasing the surfactant concentration may be due to the interfacial tension reduction and diffusion of the surfactant into the aqueous phase which facilitate fine droplets formation (Ostertag et al., Citation2012; Saberi et al., Citation2013; Mehrnia et al., Citation2016). Also, Cremophor RH – as a non-ionic surfactant composed of hydrophilic head (35 units of polyethylene oxide) and hydrophobic tail (ricinoleate) – acts as a stabilizing agent preventing nanovesicles from aggregation and so leading to a net result of decreasing average PS (Madheswaran et al., Citation2014; Elsheikh et al., Citation2018).
4.3.2. ZP
ZP is a very important measure of the colloidal systems stability. When its value is high (around ± 30 mV), the system is considered to be stable as particles have enough charges to repel each other and so there is no tendency for agglomeration (Abdelbary et al., Citation2016). shows effects of studied MixCs on ZP. As shown in , all MixCs had negative coefficients with respect to ZP and also a significant negative interaction BC existed. Yet, all studied MixCs enter in the interaction ABC with very high positive value (ranging from 51 to 85 times) any of the negative coefficients. This leads to the result that all lines in the Piepel’s plot have positive parabolic shape with peaks at reference blend (). That is the increase in any MixC leads initially to an increase in ZP then a decrease. This increase is due to the pronouncing of interaction ABC as we move toward the reference blend. The decrease as we move beyond the reference blend is due to fading of ABC influence as much increment in one of the MixCs will eventually be accompanied by considerable reduction in the other two. This overwhelming interaction ABC between MixCs on ZP appears in the contour plot in . It is observed that as we move to the center of experimental space (reference blend region), the ZP increases and highly negative ZP values are found in the marginal area.
Span 20 as a non-ionic surfactant can produce stable dispersion by its effect on ZP. This could be explained by molecular polarization. The surfactant (span) molecules are absorbed onto the particle or vesicle/water interface which is followed by formation of an electric double layer similar to an ionic layer (Khalil et al., Citation2013). Yet for enhancing this charging of particles and consequently their stability, 0.05% SLS solution was used for hydration of the niosomal films during preparation (Zhang et al., Citation2020). The reduction of ZP with increasing surfactant content was found by Asasutjarit et al. (Citation2007) too. The reduction of ZP with increasing Cholesterol content was found by other researchers too (Asasutjarit et al., Citation2007; Magarkar et al., Citation2014; Zhang et al., Citation2020). Asthana et al. (Citation2016) proved that when hydrophilicity of the surfactant increases, the ZP will increase. Cremophor RH has high hydrophilicity (HLB = 13.5) and so increasing its amount in the formula increased the negativity of ZP (Asthana et al., Citation2016). Yet, Elsheikh et al. (Citation2018) showed that particles produced using Cremophor RH as surfactant have negative value of ZP which is not reduced significantly with increasing Cremophor RH percentage. This is in contrast with our findings where increasing Cremophor RH amount beyond the reference blend led to a significant reduction in ZP.
4.3.3. EE
As the vesicles represent the carrier transferring the drug to skin layers, the higher the amount of drug entrapped within these vesicles, the higher the drug delivery to the skin layers. Thus, EE is a critical factor in the delivery of drug with appropriate amounts to skin layers (Fahmy et al., Citation2019). shows effects of studied MixCs on EE. shows that MixC C (Cremophor RH amount) has the largest effect on EE, where increasing its amount led to a reduction in EE, while increasing either span 20 amount (A) or Cholesterol amount (B) led to an increase in EE. This plot ensures the invalidity of explaining the effects by looking at the coefficients in . In this table, all the three MixCs have positive significant coefficients. Yet being a mixture, there is no practical situation where all the three MixCs can be increased together. Thus, increasing MixC C is accompanied by a reduction in either MixC A or B. Consequently, having a positive coefficient of a less value than that of A or B, the increase in MixC C will practically lead to a reduction in EE in contrast to what may have been predicted from its positive coefficient. These combined effects of MixCs on EE appear in the contour plot in . It is observed that the nearer we move to Cremophor RH (C) baseline near A or B peaks, the higher EE lines we find.
The increase in EE with increasing Span 20 amount is to be predicted with increasing the amount of formed niosomes. Moreover, having a relatively low HLB of 8.6, span 20 can help in increasing drug accommodation within the niosomes. This is in agreement with Ephrem et al. who reported that the use of span 20 gave nanocapsules characterized by smaller size and lower PDI with high resistance to drug leakage (Ephrem et al., Citation2014). Cholesterol is one of the components that are usually added to increase vesicular stability (Fetih, Citation2016). It stabilizes vesicular bilayer and prevents drug leakage; it also facilitates drug partitioning in the vesicular structure (Abdelbary & El-Gendy, Citation2008). The increase in the EE with increasing the amount of Cholesterol is in line with the findings of many researchers. This is thought to be due to Cholesterol intercalation through the bilayers, consequently increasing their hydrophobicity and stability and thus preventing drug's leakage (Balakrishnan et al., Citation2009; Alomrani et al., Citation2015; Asthana et al., Citation2016). The reduction in EE with increasing Cremophor RH amount can be attributed to the concurrent reduction of the other two MixCs which increase EE. This is observed in despite of the positive coefficient of this factor ().
4.4. Formula optimization
The ranges of MixCs used resulted in niosomes with ZP ranging from positive to negative values. For achieving best stability of the optimized formula, the aim was to maximize absolute value of ZP beside low PS and high EE. Thus, formula optimization was done to achieve a particle size below 220 nm and maximize EE twice; with the ZP goal once to maximize and the other to minimize. Optimization results – with criteria of particle size below 220 nm, maximizing EE and ZP – led to a formula with suitable predicted PS and EE but ZP of only 14.64 mV. This ZP is not high enough for creating enough electrostatic repulsion that prevents possible aggregation (Mehnert & Mäder, Citation2001; Mohanraj & Chen, Citation2006). Optimization results – with criteria of particle size below 220 nm, maximizing EE and minimizing ZP – led to a formula with suitable predicted PS, EE, and ZP = −38.4 mV. Thus, this was the one selected as an optimized formula (OF) and it was already prepared twice in the selected design as S4 and S12. The values of different MixCs and responses (PS, EE, and ZP) for S4 and S12 are shown in . The percent deviation of the actual responses values from the predicted values according to the derived models and the 95% prediction intervals (upper and lower) (95%PI) are also shown in . From this table, it is clear that the percent deviations of all actual values – for different responses (measured for the prepared formulae S4 and S12) – from the predicted values had low and acceptable values. Also, all the actual values fell within the 95%PI of the predicted values. This verifies the validity of the derived models (Habib & AbouGhaly, Citation2016).
4.5. Transmission electron microscopy
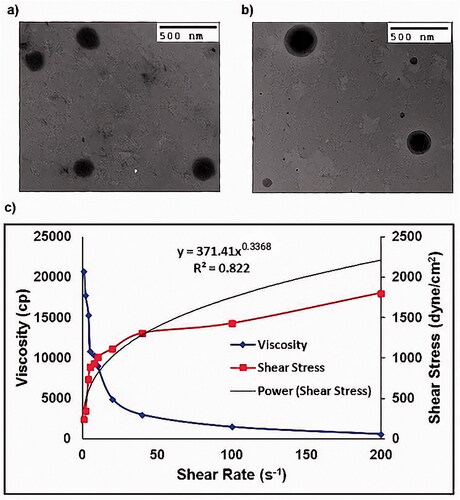
TEM images showed that the prepared OF were spherical, non-aggregated, and with comparable size to that found previously by Zetasizer ().
Figure 3. (a) Transmission electron micrograph of optimized Dapsone niosomal formula after negative staining using 2% phosphotungstic acid, (b) Transmission electron micrograph of optimized formula gel after negative staining using 2% phosphotungstic acid and (c) Optimized formula gel rheological characterization.
4.6. Characterization of of-gel
4.6.1. Physical appearance
The prepared OF-gel was clear and homogenous having no aggregates or clumps. It was soft and easily spread on the skin.
4.6.2. Drug content
The drug content was found to be 0.4%w/w.
4.6.3. pH determination
The pH of the diluted OF-gel was 6.74 revealing that it is safe to the skin and does not produce irritation upon application (Omar et al., Citation2019).
4.6.4. Particle size (PS), polydispersity index (PDI) and zeta potential (ZP) determination
The prepared OF-gel had PS of 325 ± 1.4 nm which is a bit larger than Dapsone niosomes with PDI = 0.402 ± 0.072 and ZP = −25.6 ± 0.2. This slight increment in PS over the OF might be due to carbopol swelling or formation of carbopol layer along the niosomal surface. Low values of PDI and negative ZP suggested increased stability and absence of vesicle aggregation in the OF-gel (Allam et al., Citation2021; Shinde & Kanojiya, Citation2014).
4.6.5. Imaging by transmission electron microscope (TEM)
TEM images showed that the prepared OF-gel vesicles maintained their morphological structures after incorporation within the gel and with comparable size to that found previously by Zetasizer (). The Dapsone niosomes were evenly distributed inside the gel network which might be due to appropriate ZP on the vesicles surfaces (Said et al., Citation2017).
4.6.6. Rheological study
In , it is clear that the viscosity decreases upon increasing the shear rate indicating a shear thinning system. Also, the flow index (n) value of the power law formula was smaller than one (n = 0.3368). Thus, the OF-gel follows a non-Newtonian and shear thinning behavior. A shear thinning formula is highly suitable for topical and transdermal application as viscosity decreases during rubbing the gel on skin, so it is easily spread on skin (Fahmy et al., Citation2018).
4.7. In vivo evaluation
Figure 4. Diagrammatic representation for the in vivo evaluation.
4.7.1. In-vivo skin penetration using confocal laser scanning microscopy
The flourescence photomicrograph is shown in . In this figure, it is clear that the fluorescence of the dye appears to penetrate deep in skin layers that it had reached the dermis layer (up to 84.6 μm) (Azzi et al., Citation2005). This is related to the nature of the optimized enhancer containing niosomes that enables their interaction with the stratum corneum. This ensures the success of the proposed formula in penetrating different skin layers, which suggests its potential in the topical treatment of acne.
Figure 5. (a) The flourescence photomicrograph of mouse skin taken using confocal laser scanning microscopy. (b) Percent inflammation reduction after 48 h and 72 h in UT-gp, A-T-gp, and OF-gel-T-gp. (c) Cutibacterium acnes counts in mice ears (represented as colony forming unit (CFU) per mL) at the end of the experiment for UT-gp, A-T-gp, and OF-gel-T-gp. (d) Digital photographs for histopathological evaluation of mice ears at the end of the experiment; (i) healthy control untreated (right ear) where normal histology of ear tissue is shown with absence of inflammatory infiltrate and edema, (ii) infected untreated ear showing necrotic dermatitis characteristics such as sever dermal necrosis (arrow head), malpighian layer atrophy, and lymphocytic infiltrate (arrow), (iii) infected Aknemycin® treated ear showing contact dermatitis characteristics such as dermal hemorrhage (arrow head) and congested blood vessel (arrow), and (iv) infected OF-gel treated ear showing normal histology of mouse ear tissue with basal layer and congested dermal blood vessel (arrow). Ear tissue sections were stained with hematoxylin and eosin stain and all images are 400× magnification. [UT-gp: untreated group, A-T-gp: Aknemycin® treated group and OF-gel-T-gp: Optimized formula-gel treated group]
![Figure 5. (a) The flourescence photomicrograph of mouse skin taken using confocal laser scanning microscopy. (b) Percent inflammation reduction after 48 h and 72 h in UT-gp, A-T-gp, and OF-gel-T-gp. (c) Cutibacterium acnes counts in mice ears (represented as colony forming unit (CFU) per mL) at the end of the experiment for UT-gp, A-T-gp, and OF-gel-T-gp. (d) Digital photographs for histopathological evaluation of mice ears at the end of the experiment; (i) healthy control untreated (right ear) where normal histology of ear tissue is shown with absence of inflammatory infiltrate and edema, (ii) infected untreated ear showing necrotic dermatitis characteristics such as sever dermal necrosis (arrow head), malpighian layer atrophy, and lymphocytic infiltrate (arrow), (iii) infected Aknemycin® treated ear showing contact dermatitis characteristics such as dermal hemorrhage (arrow head) and congested blood vessel (arrow), and (iv) infected OF-gel treated ear showing normal histology of mouse ear tissue with basal layer and congested dermal blood vessel (arrow). Ear tissue sections were stained with hematoxylin and eosin stain and all images are 400× magnification. [UT-gp: untreated group, A-T-gp: Aknemycin® treated group and OF-gel-T-gp: Optimized formula-gel treated group]](/cms/asset/b295ab73-54a8-4b43-90f4-71869e808172/idrd_a_2048131_f0005_c.jpg)
4.7.2. In-vivo evaluation of OF-gel in acne inflammatory model
4.7.2.1. Ear inflammation and microcomedon size
Acne vulgaris pathogenesis in humans is multifactorial with a strong association with skin (Murillo & Raoult, Citation2013; Platsidaki & Dessinioti, Citation2018). Several animal inflammatory acne models including rat, rabbit, and mouse models have been used as reviewed in Mirshahpanah and Maibach (Citation2007). In mice, inflammatory immune responses have been observed using different mice strains (Nakatsuji et al., Citation2008; An et al., Citation2014; Ryu et al., Citation2015). Many researchers used inflammation percent after a specific time post-treatment compared with control as a final output variable. Others used inflammation percent reduction calculated relative to a control group as a final output variable for inflammation reduction (Budhiraja & Dhingra, Citation2015). Yet, we think this is not representative enough as individual variation will lead to a different inflammation response in each animal at zero time after infection and before treatment starts. Thus, in this current work, the inflammation reduction % (Inf-Red %) was taken as the response variable to be measured. This allows each mouse to act as his self-control as shown in EquationEquations (7)(7)
(7) and Equation(8)
(8)
(8) . Statistical analysis of Inf-Red % results showed that the two performed blocks were non-significantly different from each other. On the other hand, OF-gel-T-gp showed significantly higher Inf-Red % than UT-gp and A-T-gp which were non significantly different from each other (). This proves the capability of the proposed OF-gel to successfully treat the ear infection, as manifested by the higher inflammation reduction than both negative and positive controls. As for time effect, Inf-Red %72 was significantly higher than Inf-Red %48.
4.7.2.2. Bacterial load in mice ears
Statistical analysis showed that bacterial load of C. acnes (expressed as log CFU/mL) in mice ears after 72 h of treatment was reduced in OF-gel-T-gp and A-T-gp (∼104 CFU/mL) compared with UT-gp (∼106 CFU/mL) (). There was no significant difference between OF-gel-T-gp and A-T-gp showing comparable reduction in the bacterial load after 72 h of treatment, and thus OF-gel showed comparable results to an antibiotic of known effectiveness in acne treatment and widely used in the market.
4.7.2.3. Histological examination
shows histopathological evaluation of left ear healing after 72 h in the three groups compared with uninfected right ear. OF-gel seemed to restore the normal histology of mouse ear tissue as the infected OF-gel treated ears showed normal basal layer and dermal blood vessel. The healing effect was superior to the infected Aknemycin®-treated ears that showed contact dermatitis characteristics such as dermal hemorrhage. In comparison, uninfected control group ears showed normal histology of ear tissue with the absence of inflammatory infiltrate and edema, while infected untreated control ears showed necrotic dermatitis characteristics such as: sever dermal necrosis, Malpighian layer atrophy, and lymphocytic infiltrate.
5. Conclusions
The D-optimal mixture design used for the preparation of Dapsone enhancer containing niosomes was a sensible choice. The studied responses could be adequately modeled with non-significant lack of fit and prediction R2 values of 0.936, 0.978, and 0.903 for inverse particle size reduced cubic model, zeta potential reduced cubic model, and entrapment efficiency reduced quadratic model, respectively. Exploring the Piepel’s plots demonstrated the practicality of mixture design for explanation of the simultaneous influences of studied variables on different responses. The optimized formula with components: span 20, Cholesterol, and Cremophor RH of 160, 100, and 60 mg, respectively, had predicted values for PS, ZP, and EE of 201.1 nm, 38.4 mV, and 85.1%, respectively. This optimized formula was already prepared twice as S4 and S12 whose actual values of different responses swerved slightly from predicted ones and this was in accordance with the high prediction R2 values of the final derived models. Optimized formula gel showed suitable in vitro characterization with shear thinning behavior and deep in vivo skin penetration as verified by Confocal Laser Scanning Microscopy. In vivo testing of the optimized formula gel for topical treatment of C. acnes infected BALB/c mice showed superior results in comparison to Aknemycin® treated and untreated groups. It resulted in significantly higher inflammation reduction percent than the other two groups, with lower bacterial count than untreated group and histological examination comparable to uninfected ear. These results showed that using D-Optimal mixture design was a suitable tool for optimization of Dapsone niosomal formula. This optimized formula gel was effective in treating Cutibacterium acnes infected mice. Further investigations will be needed for testing this effectiveness in the treatment of human acne.
Acknowledgment
The authors thank Prof. Dr. Sherein S. Abdelgayed, Department of Pathology, Faculty of Veterinary Medicine, Cairo University for performing the histopathology examination and Dr. Ayman M. Mostafa, Molecular and Fluorescence Lab., Central Laboratories Network, National Research Centre for performing the Confocal Laser Scanning Microscopy Imaging.
Disclosure statement
The authors report no conflict of interest.
References
- Abd-Elsalam WH, El-Zahaby SA, Al-Mahallawi AM. (2018). Formulation and in vivo assessment of terconazole-loaded polymeric mixed micelles enriched with Cremophor EL as dual functioning mediator for augmenting physical stability and skin delivery. Drug Deliv 25:484–92.
- Abdelbary AA, Abd-Elsalam WH, Al-mahallawi AM. (2016). Fabrication of novel ultradeformable bilosomes for enhanced ocular delivery of terconazole: in vitro characterization, ex vivo permeation and in vivo safety assessment. Int J Pharm 513:688–96.
- Abdelbary G, El-Gendy N. (2008). Niosome-Encapsulated gentamicin for ophthalmic controlled delivery. AAPS PharmSciTech 9:740–7.
- Ahmed S, Kassem MA, Sayed S. (2020). Bilosomes as promising nanovesicular carriers for improved transdermal delivery: construction, in vitro optimization, ex vivo permeation and in vivo evaluation. Int J Nanomedicine 15:9783–98.
- Allam A, Elsabahy M, El Badry M, Eleraky NE. (2021). Betaxolol-loaded niosomes integrated within pH-sensitive in situ forming gel for management of glaucoma . Int J Pharm 598:120380.
- Alomrani AH, Al-Agamy MH, Badran MM. (2015). In vitro skin penetration and antimycotic activity of itraconazole loaded niosomes: various non-ionic surfactants. J Drug Deliv Sci Technol 28:37–45.
- An HJ, Lee WR, Kim KH, et al. (2014). Inhibitory effects of bee venom on Propionibacterium acnes-induced inflammatory skin disease in an animal model. Int J Mol Med 34:1341–8.
- Armstrong NA. 2006. Pharmaceutical experimental design and interpretation. Florida: Taylor & Francis Group: Informa Healthcare.
- Asasutjarit R, Lorenzen SI, Sirivichayakul S, et al. (2007). Effect of solid lipid nanoparticles formulation compositions on their size, zeta potential and potential for in vitro pHIS-HIV-hugag transfection. Pharm Res 24:1098–107.
- Asthana GS, Sharma PK, Asthana A. (2016). In vitro and in vivo evaluation of niosomal formulation for controlled delivery of clarithromycin. Scientifica 2016:6492953.
- Azzi L, El-Alfy M, Martel C, Labrie F. (2005). Gender differences in mouse skin morphology and specific effects of sex steroids and dehydroepiandrosterone. J Invest Dermatol 124:22–7.
- Badri W, Miladi K, Eddabra R, et al. (2015). Elaboration of nanoparticles containing indomethacin: argan oil for transdermal local and cosmetic application. J Nanomater 2015:1–9.
- Balakrishnan P, Shanmugam S, Lee WS, et al. (2009). Formulation and in vitro assessment of minoxidil niosomes for enhanced skin delivery. Int J Pharm 377:1–8.
- Bangham A, Standish M, Watkins J. (1965). Diffusion of univalent ions across the lamellae of swollen phospholipids. J Mol Biol 13:238–52.
- Budhiraja A, Dhingra G. (2015). Development and characterization of a novel antiacne niosomal gel of rosmarinic acid. Drug Deliv 22:723–30.
- Cornell JA. 2002. Experiments with mixtures: designs, models, and the analysis of mixture data. 3rd ed. New York: John Wiley & Sons, Inc.
- Draelos ZD, Carter E, Maloney JM, et al. (2007). Two randomized studies demonstrate the efficacy and safety of dapsone gel, 5% for the treatment of acne vulgaris. J Am Acad Dermatol 56:439.e1–439.e10.
- El-Nabarawi MA, Shamma RN, Farouk F, Nasralla SM. (2018). Dapsone-loaded invasomes as a potential treatment of acne: preparation, characterization, and in vivo skin deposition assay. AAPS PharmSciTech 19:2174–84.
- El-Nabarawi MA, Shamma RN, Farouk F, Nasralla SM. (2020). Bilosomes as a novel carrier for the cutaneous delivery for dapsone as a potential treatment of acne: preparation, characterization and in vivo skin deposition assay. J Liposome Res 30:1–11.
- El-Ridy MS, Yehia SA, Mohsen AM, et al. (2017). Formulation of niosomal gel for enhanced transdermal lornoxicam delivery: in-vitro and in-vivo evaluation. Curr Drug Deliv 15:122–33.
- Elsheikh MA, Elnaggar YSR, Hamdy DA, Abdallah OY. (2018). Novel cremochylomicrons for improved oral bioavailability of the antineoplastic phytomedicine berberine chloride: optimization and pharmacokinetics. Int J Pharm 535:316–24.
- Ephrem E, Greige-Gerges H, Fessi H, Charcosset C. (2014). Optimisation of rosemary oil encapsulation in polycaprolactone and scale-up of the process. J Microencapsul 31:746–53.
- Fahmy AM, El-Setouhy DA, Habib BA, Tayel SA. (2019). Enhancement of transdermal delivery of haloperidol via spanlastic dispersions: entrapment efficiency vs. particle size. AAPS PharmSciTech 20:1–13.
- Fahmy AM, El-Setouhy DA, Ibrahim AB, et al. (2018). Penetration enhancer-containing spanlastics (PECSs) for transdermal delivery of haloperidol: in vitro characterization, ex vivo permeation and in vivo biodistribution studies. Drug Deliv 25.
- Farid M, El-Setouhy DA, El-Nabarawi MA, El-Bayomi T. (2016). Particle engineering/different film approaches for earlier absorption of meloxicam. Drug Deliv 23:2309–17.
- Fetih G. (2016). Fluconazole-loaded niosomal gels as a topical ocular drug delivery system for corneal fungal infections. J Drug Deliv Sci Technol 35:8–15.
- Gonnissen Y, Gonçalves SIV, De Geest BG, et al. (2008). Process design applied to optimise a directly compressible powder produced via a continuous manufacturing process. Eur J Pharm Biopharm 68:760–70.
- Goyal G, Garg T, Malik B, et al. (2015). Development and characterization of niosomal gel for topical delivery of benzoyl peroxide. Drug Deliv 22:1027–42.
- Gugleva V, Titeva S, Rangelov S, Momekova D. (2019). Design and in vitro evaluation of doxycycline hyclate niosomes as a potential ocular delivery system. Int J Pharm 567:118431.
- Habib BA, Abd El-Samiae AS, El-Houssieny BM, Tag R. (2021). Formulation, characterization, optimization, and in-vivo performance of febuxostat self-nano-emulsifying system loaded sublingual films. Drug Deliv 28:1321–33.
- Habib BA, AbouGhaly MHH. (2016). Combined mixture-process variable approach: a suitable statistical tool for nanovesicular systems optimization. Expert Opin Drug Deliv 13:1–12.
- Habib BA, Rehim RTAE, Nour SA. (2014). Feasibility of optimizing trimetazidine dihydrochloride release from controlled porosity osmotic pump tablets of directly compressed cores. J Adv Res 5:347–56.
- Habib BA, Sayed S, Elsayed GM. (2018). Enhanced transdermal delivery of ondansetron using nanovesicular systems: fabrication, characterization, optimization and ex-vivo permeation study-Box-Cox transformation practical example. Eur J Pharm Sci 115:352–61.
- Habib BA, Tag R, Nour SA. (2008). Factorial design approach for optimization of a gel formulation for in vitro iontophoretic transdermal delivery of granisetron. Bull Fac Pharm 49:305–13.
- Khalil RM, El-Bary AA, Kassem MA, et al. (2013). Influence of formulation parameters on the physicochemical properties of meloxicam-loaded solid lipid nanoparticles. Pharm J 12:63–72.
- Khazaeli P, Pardakhty A, Shoorabi H. (2007). Caffeine-loaded niosomes: characterization and in vitro release studies. Drug Deliv 14:447–52.
- Madheswaran T, Baskaran R, Yong CS, Yoo BK. (2014). Enhanced topical delivery of finasteride using glyceryl monooleate-based liquid crystalline nanoparticles stabilized by cremophor surfactants. AAPS PharmSciTech 15:44–51.
- Magarkar A, Dhawan V, Kallinteri P, et al. (2014). Cholesterol level affects surface charge of lipid membranes in saline solution. Sci Rep 4:5005.
- Manconi M, Sinico C, Valenti D, et al. (2006). Niosomes as carriers for tretinoin. III. A study into the in vitro cutaneous delivery of vesicle-incorporated tretinoin. Int J Pharm 311:11–19.
- Mason RL, Gunst RF, Hess JL. (2003). Statistical design and analysis of experiments with applications to engineering and science. 2nd ed. Hoboken, New Jersey: John Wiley & Sons, Inc.
- Master AM, Rodriguez ME, Kenney ME, et al. (2010). Delivery of the photosensitizer Pc 4 in PEG-PCL micelles for in vitro PDT studies. J Pharm Sci 99:2386–2398.
- Mehnert W, Mäder K. (2001). Solid lipid nanoparticles: production, characterization and applications. Adv Drug Deliv Rev 47:165–196.
- Mehrnia MA, Jafari SM, Makhmal-Zadeh BS, Maghsoudlou Y. (2016). Crocin loaded nano-emulsions: factors affecting emulsion properties in spontaneous emulsification. Int J Biol Macromol 84:261–267.
- Mirshahpanah P, Maibach HI. (2007). Models in acnegenesis. Cutan Ocul Toxicol 26:195–202.
- Mohanraj VJ, Chen Y. (2006). Nanoparticles – a review. Trop J Pharm Res 5:561–573.
- Montgomery DC. 2013. Design and analysis of experiments. 8th ed., New York, NY: John Wiley & Sons, Inc.
- Murillo N, Raoult D. (2013). Skin microbiota: overview and role in the skin diseases acne vulgaris and rosacea. Future Microbiol 8:209–222.
- Nageeb El-Helaly S, Habib BA, Abd El-Rahman MK. (2018). Resolution V fractional factorial design for screening of factors affecting weakly basic drugs liposomal systems. Eur J Pharm Sci 119:249–258.
- Nakatsuji T, Liu Y-T, Huang C-P, et al. (2008). Antibodies elicited by inactivated Propionibacterium acnes-based vaccines exert protective immunity and attenuate the IL-8 production in human sebocytes: relevance to therapy for acne vulgaris. J Invest Dermatol 128:2451–2457.
- Omar MM, Hasan OA, El Sisi AM. (2019). Preparation and optimization of lidocaine transferosomal gel containing permeation enhancers: a promising approach for enhancement of skin permeation. Int J Nanomedicine 14:1551–1562.
- Ostertag F, Weiss J, McClements DJ. (2012). Low-energy formation of edible nanoemulsions: factors influencing droplet size produced by emulsion phase inversion. J. Colloid Interface Sci 388:95–102.
- Pat MS, Wayne B. (2014). Handbook for experimenters. Version 09.01.03, Stat-Ease, Inc., Minnesota, USA.
- Pickert A, Raimer S. (2009). An evaluation of dapsone gel 5% in the treatment of acne vulgaris. Expert Opin Pharmacother 10:1515–1521.
- Platsidaki E, Dessinioti C. (2018). Recent advances in understanding Propionibacterium acnes (Cutibacterium acnes) in acne. F1000Res 7:1953–12.
- Ranpise NS, Korabu SS, Ghodake VN. (2014). Second generation lipid nanoparticles (NLC) as an oral drug carrier for delivery of lercanidipine hydrochloride. Colloids Surf B Biointerfaces 116:81–87.
- Ryu S, Han HM, Song PI, et al. (2015). Suppression of propionibacterium acnes infection and the associated inflammatory response by the antimicrobial peptide P5 in mice. PLoS One 10:e0132619–18.
- Saberi AH, Fang Y, McClements DJ. (2013). Fabrication of vitamin E-enriched nanoemulsions: factors affecting particle size using spontaneous emulsification. J Colloid Interface Sci 391:95–102.
- Said M, Elsayed I, Aboelwafa A, Elshafeey A. (2018). A novel concept of overcoming the skin barrier using augmented liquid nanocrystals: Box-Behnken optimization, ex vivo and in vivo evaluation. Colloids Surf B Biointerfaces 170:258–265.
- Said M, Elsayed I, Aboelwafa AA, Elshafeey AH. (2017). Transdermal agomelatine microemulsion gel: Pyramidal screening, statistical optimization and in vivo bioavailability. Drug Deliv 24:1159–1169.
- Sago J, Hall RP. (2002). Dapsone. Dermatol Ther 15:340–351.
- Sayed S, Elsayed I, Ismail MM. (2018). Optimization of β-cyclodextrin consolidated micellar dispersion for promoting the transcorneal permeation of a practically insoluble drug. Int J Pharm 549:249–260.
- Schneider-Rauber G, Argenta DF, Caon T. (2020). Emerging technologies to target drug delivery to the skin – the role of crystals and carrier-based systems in the case study of dapsone. Pharm Res 37:6–10.
- Shaker S, Gardouh A, Ghorab M. (2017). Factors affecting liposomes particle size prepared by ethanol injection method. Res Pharm Sci 12:346–352.
- Shamma RN, Salah Ad-din I, Abdeltawab NF. (2019). Dapsone- gel as a novel platform for acne treatment: in vitro evaluation and In vivo performance and histopathological studies in acne infected mice. J Drug Deliv Sci Technol 54:101238.
- Shinde UA, Kanojiya SS. (2014). Serratiopeptidase niosomal gel with potential in topical delivery. J. Pharm 2014:1–9.
- Taleb MH, Abdeltawab NF, Shamma RN, et al. (2018). Origanum vulgare L. Essential oil as a potential anti-acne topical nanoemulsion—in vitro and in vivo study. Molecules 23:2164.
- Voinovich D, Campisi B, Phan-Tan-Luu R. 2009. Experimental design for mixture studies. In: Brown S, Tauler R, Walczak B eds. Comprehensive chemometrics: chemical and biochemical data analysis. Amsterdam: Elsevier B.V. 391–452 pp.
- Yoshioka T, Sternberg B, Florence A. (1994). Preparation and properties of vesicles (niosomes) of sorbitan monoesters (Span 20,40,60 and 80) and a sorbitan triester (Span 85). Int J Pharm 105:1–6.
- Younes NF, Abdel-Halim SA, Elassasy AI. (2018). Corneal targeted sertaconazole nitrate loaded cubosomes: preparation, statistical optimization, in vitro characterization, ex vivo permeation and in vivo studies. Int J Pharm 553:386–397.
- Zhang Y, Jing Q, Hu H, et al. (2020). Sodium dodecyl sulfate improved stability and transdermal delivery of salidroside-encapsulated niosomes via effects on zeta potential. Int J Pharm 580:119183.