
 ?Mathematical formulae have been encoded as MathML and are displayed in this HTML version using MathJax in order to improve their display. Uncheck the box to turn MathJax off. This feature requires Javascript. Click on a formula to zoom.
Abstract
Sorafenib (SRB), a multikinase inhibitor, is effective in reducing experimental corneal neovascularization (CNV) after oral administration; however, its therapeutic use in ocular surface disorders is restricted due to poor solubility and limited bioavailability. This study aimed to develop and optimize SRB-loaded nanostructured lipid carriers (SRB-NLCs) for topical ocular delivery by a central composite design response surface methodology (CCD-RSM). It was spherical and uniform in morphology with an average particle size of 111.87 ± 0.93 nm and a narrow size distribution. The in vitro drug release from the released SRB-NLC formulation was well fitted to Korsmeyer Peppas release kinetics. The cell counting kit-8 (CCK-8) cell viability assay demonstrated that SRB-NLC was not obviously cytotoxic to human corneal epithelial cells (HCECs). An in vivo ocular irritation test showed that SRB-NLC was well tolerated by rabbit eyes. Ocular pharmacokinetics revealed 6.79-fold and 1.24-fold increase in the area under concentration-time curves (AUC0-12h) over 12 h in rabbit cornea and conjunctiva, respectively, treated with one dose of SRB-NLC compared with those treated with SRB suspension. Moreover, SRB-NLC (0.05% SRB) and dexamethasone (0.025%) similarly suppressed corneal neovascularization in mice. In conclusion, the optimized SRB-NLC formulation demonstrated excellent physicochemical properties and good tolerance, sustained release, and enhanced ocular bioavailability. It is safe and potentially effective for the treatment of corneal neovascularization.
1. Introduction
The cornea is a unique avascular tissue that is essential for clear and optimal vision under healthy conditions. Corneal neovascularization (CNV) can result from a variety of etiologies, such as contact lens use, infection, inflammation, chemical or physical damage, autoimmune diseases, and corneal transplantation, including limbal stem cell deficiency, and can result in decreased visual acuity as a sequelae of blood vessels invade the cornea and cause stroma opacification or corneal surface irregularities (Zhang & Ma, Citation2007; Roshandel et al., Citation2018). The exact incidence and prevalence of CNV are unknown, but it is estimated that 1.4 million people in the United States develop CNV per year, 12% of whom suffer a subsequent loss of vision (Lee et al., Citation1998). CNV is the main cause of vision loss worldwide (Nicholas & Mysore, Citation2021). The avascularity of the cornea is also due to the balance between proangiogenic stimuli and antiangiogenic factors. Some proangiogenic cytokines, such as vascular endothelial growth factor (VEGF), play an important role in angiogenesis. VEGF expression was higher in both animal models and human corneal neovascularization than in the normal group. VEGF-A acts are the predominant VEGF member involved in multiple steps that stimulate pathologic corneal neovascularization (Han et al., Citation2016).
CNV management includes medical and surgical options. Surgical options, including vessel occlusion and ocular surface reconstruction, are selected depending on etiology and response to medical therapy. Although surgical methods are the most effective treatment of established CNV, they can also be combined with anti-VEGF agents to treat active vascularization (Roshandel et al., Citation2018). The main medical treatment for CNV is to suppress the inflammatory response by applying topical glucocorticoids such as dexamethasone. Steroids actively suppress proliferating corneal vessels through their anti-inflammatory properties, which include inhibition of cell chemotaxis, proinflammatory cytokines, and prostaglandin synthesis. However, glucocorticoids incompletely suppress CNV and may cause major side effects such as corneal thinning, ocular hypertension, cataracts, and increased risk of infection in susceptible individuals (Hsu et al., Citation2015; Barry et al., Citation2020). Another medical treatment is to use anti-VEGF antibodies such as bevacizumab, which has shown promising results in treating CNV. However, partial efficacy, resistance, and side effects consisting of corneal thinning and reduced epithelial healing have limited its use. CNV has a multifactorial etiology; when the homeostasis between angiogenic factors and antiangiogenic factors is disrupted, abnormal blood vessel growth occurs (Siedlecki et al., Citation2017), and VEGF and platelet-derived growth factor (PDGF) are involved in this process. However, the use of anti-VEGF drugs alone, such as monoclonal antibodies, ribonucleic acid aptamers, and VEGF traps, has been shown to have limited or partial inhibitory effects on CNV in animal studies and clinical trials (Mabry et al., Citation2010). In addition, PDGF transcription is stimulated by tyrosine kinase PDGF receptors (PDGFRs) (Robbie et al., Citation2013). Therefore, inhibiting VEGFRs and PDGFRs can significantly improve the antiangiogenic effect. For these reasons, the evaluation of novel treatment strategies is of great medical and socioeconomic interest.
Sorafenib (SRB) is an in vitro multikinase inhibitor that mainly targets VEGFR1-3 and PDGFR (Kernt et al., Citation2008). It has been proven to be effective in the treatment of renal cell carcinoma, liver cancer, and thyroid cancer (Wilhelm et al., Citation2006). Due to its dual effects on the VEGF and PDGF signaling pathways, SRB may be able to effectively inhibit CNV. In addition, studies have confirmed that SRB has an inhibitory effect on CNV; for example, the systemic administration of SRB inhibited rat CNV (Seo et al., Citation2012). In these studies, oral administration of the multikinase inhibitor SRB significantly reduced the development of experimental CNV in a dose-dependent manner. In vitro studies of SRB (0.1–100 µg/mL) showed no toxic effects on endothelial cells at a dose of 7.5 µg/mL (Thiele et al., Citation2013).
In addition to drug selection, the drug delivery challenges for eye diseases should also be considered ((a) Li et al., Citation2021). Drug molecules that have a good effect in vitro may be ineffective in vivo due to inefficiency and insufficiency after topical administration. Eye drops are the most convenient and widely accepted form of administration for the treatment of ocular surface diseases (Seyfoddin et al., Citation2010); however, eye drops suffer from low ocular bioavailability (<5%), and negligible levels of drugs can reach intraocular target sites for the following two major reasons: ocular tissue static barriers, especially the cornea, which consists of lipophilic epithelium, hydrophilic stroma, and lipophilic endothelium, limit drug molecule access into the eye; and the dynamic barrier, in which eye drops are diluted and washed away instantaneously from the precorneal area due to reflex lachrymation and nasolacrimal drainage (Yu et al., Citation2020). Ocular drug delivery is not only an interesting topic but also one of the most challenging issues in the pharmaceutical sciences due to the unique anatomical structure of the eye. Nanotechnology-based ophthalmic formulations are receiving increasing attention, and several nanocarriers have been developed to overcome these problems, including nanosuspensions, liposomes, dendrimers, and micelles (Liu et al., Citation2020; González-Fernández et al., Citation2021; Kumari et al., Citation2021). Solid lipid nanoparticles (SLNs) and NLCs are considered effective ocular drug delivery systems because of their abilities to enhance drug absorption by the cornea, increase ocular bioavailability, prolong ocular retention time, and provide a controlled drug release profile for both hydrophilic and lipophilic drugs (Sánchez-López et al., Citation2017). Nanostructured lipid carriers (NLCs), a kind of lipid nanoparticle, exhibit outstanding properties for drug delivery, such as increased drug payload, controlled drug release, and improved stability. Furthermore, NLCs facilitate the corneal penetration of drugs.
One study previously encapsulated SRB in NLCs. The lipid nanocarriers containing SRB inhibited colony formation by human liver cancer cells, but organic solvents were added (Bondì et al., Citation2015). The aim of this study was to develop sorafenib-loaded nanostructured lipid carriers (SRB-NLCs), optimize formulations by using central composite design response surface methodology (CCD-RSM), and evaluate both the in vitro and in vivo performances of SRB-NLCs as a topical ophthalmic delivery system for the treatment of corneal neovascularization in a mouse animal model and ocular pharmacokinetics in rabbits.
2. Materials and methods
2.1. Materials
SRB, Isopropyi myristate, Monoolein, Olive oil, and Corn oil were purchased from Macklin (Shanghai, China). Monolaurin (ML), Palmitin, and Glyceryl tripalmitate were acquired from TCI Co., Ltd. (Shanghai, China). Monostearin, ethyl oleate, and triacetin were obtained from J&K Scientific Technology Co., Ltd. (Beijing, China). Glyceryl stearate was obtained from Dermofeel® (Germany). Ricinoleic acid and Oleic acid were obtained from Tokyo Chemical Industries Co., Ltd. (Japan), propylene glycol dicaprylate and castor oil were purchased from Hunan Er-Kang Pharmaceutical Co., Ltd. (China). Medium-chain triglyceride (MTC) was obtained from Yunhong Chemical Preparation Excipients Technology Co., Ltd. (Shanghai, China). Glycerol Monooleate was obtained from Riken Vitamin Co., Ltd. (Tokyo, Japan). Cremophor®RH40 (CRH 40), Crempophor EL35 (EL 35), and Kolliphor®HS 15 (HS 15) were purchased from BASF SE (Germany). Tween 80 was purchased from Sichuan Jinshan Pharmaceutical Co., Ltd. (China), and PEG 400 and Triton X 100 were obtained from Solarbio Life Science (China). Transcutol®P, Capryol-90, Lauroglycol FCC, and Lauroglycol 90 were kindly provided by Gattefossé. (Saint-Priest, France). Glycerin was acquired from Huikang Pharmaceutical Co., Ltd. (Zhejiang, China). Dexamethasone sodium phosphate eye drops were purchased from Huaqing Pharmaceutical (Xinxiang, China). Cell Counting Kit-8 (CCK-8) was purchased from Beyotime (China). Mouse PDGF-AB and VEGF-A ELISA kits were purchased from Elabscience Biotechnology (Wuhan, China). High-performance liquid chromatography (HPLC)-grade methanol was purchased from Merck (Darmstadt, Germany). Acetonitrile (HPLC grade) was purchased from Tedia (Ohio, USA.). All other reagents were of analytic grade, and water was purified.
2.2. Animals
New Zealand White rabbits weighing 2.0–2.5 kg were obtained from Huaxing Experimental Animal Farm (Zhengzhou, China). Six- to eight-week-old male BALB/c mice weighing 18–22 g were purchased from the same place. All animals had free access to a standard diet and drinking water and were housed in a room maintained at 22.0 °C ± 3 °C and with a 12-h on:12-h off lighting schedule. All animal experiments conformed with the principal of ARVO (Association for Research in Vision and Ophthalmology) statements. All animal procedures were approved by the Experimental Animal Ethics Committee of Henan Institute of Ophthalmology.
2.3. HPLC analysis of SRB
SRB content was assayed by HPLC (Luo et al., Citation2013). The chromatographic conditions were as follows: an X-Bridge C18 column (150 mm × 3.0 mm, 3.5 μm, XTerra®MS, Water, Ireland) with a column temperature of 35 °C was used in a Waters 2695 liquid chromatograph system (Milford, MA, USA). The mobile phase consisted of a mixture of water/acetonitrile (43/57, v/v) with a flow rate of 0.5 mL/min. Detection was performed at a wavelength of 265 nm, and the injection volume was 10 μL. The SRB concentration was obtained from standard curve. Stock solutions of SRB were prepared by dissolving accurately weighed standard SRB in methanol, and serially diluted working solutions were obtained through stepwise dilutions of the stock solution with mobile phase. Then, the standard curve was obtained.
2.4. Screening of solid lipids, liquid oils, surfactants, and cosurfactants
2.4.1. Screening of solid lipids
The solubility of SRB in the selected solid and liquid lipids is crucial to obtain lipid nanoparticles with high drug encapsulation efficiency (EE) and loading capacity (LC). This study was based on previous studies (Kelidari et al., Citation2017; Alam et al., Citation2018; Kesharwani et al., Citation2020). One gram of each solid lipid () was accurately weighed and heated to 80 °C in a bottle with a stopper. A batch of 1 mg SRB was added to a glass bottle and continuously stirred (1000 times/min) by using mixer (ZNCL-B, Ketai Experimental Equipment Co., Ltd., Zhengzhou, China) until the drug was no longer dissolved. The solubility of SRB in each system was evaluated by visual observation of the disappearance of drug crystals and the formation of a transparent homogeneous system.
2.4.2. Screening of liquid oils, surfactants, and cosurfactants
This study was based on a previous method (Zhu et al., 2008; Zakkula et al., Citation2020; Zeng et al., 2021). The solubility of SRB in various liquid oils, surfactants, and cosurfactants () was determined by adding excess amount of drug to 2 g of each selected oils, surfactants or cosurfactants in 20 mL stopper vials and vortexed the vials in a shaking water bath at 1000 rpm at 37 °C for 4 h. The mixtures were then shaken for 48 h at 37 °C in a constant temperature shaker (JBQ-ZD, Changzhou Putian Instrument Manufacturing Co. Ltd, Jiangsu, China). The equilibrated samples were centrifuged with a centrifuge (MiniSpin ® Plus, Eppendorf, Germany) at 12,000 rpm for 10 min. Approximately 0.2 g of supernatant was taken out and diluted with methanol, and the solubility of sorafenib was subsequently quantified by HPLC (Section 2.3). All measurements were done in triplicate.
2.4.3. Screening of the ratios of solid lipid and liquid lipid
To assess the optimal solid/liquid lipid ratio for the NLC formulation, the differences in the melting points of different solid/liquid lipid mixtures were assessed using differential scanning calorimetry (DSC) (Savić et al., Citation2019). Samples of mixtures with different ratios of monolaurin and Capryol-90 (3:2, 2:1, 7:3, 3:1) were heated from 30 °C to 90 °C at a heating rate of 10 °C/min using a Q200 DSC system (TA Instruments, New Castle). Measurements were conducted under a constant nitrogen flow of 20 mL/min.
2.4.4. Screening of surfactants for emulsification ability
The selected surfactants based on solubility test results were screened for their ability to emulsify the mixed lipid. Briefly, 300 mg of each surfactant (CRH 40 or HS-15) were added to 300 mg of the mixed lipid, and the mixtures were then homogenized by heating at 50 °C for 15 min. Each mixture, 100 mg, was accurately weighed and diluted to 50 mL of double-distilled water at the same temperature in a stoppered glass bottle and turned upside down 100 times to yield a homogenous emulsion. The emulsions were allowed to stand for 2 h, and then the % transmittance was measured at 650 nm by a UV spectrophotometer (UV1800SPC, Shanghai Meixi Instrument Manufacturing Co. Ltd., Shanghai, China), using double-distilled water as a blank. All experiments were conducted in triplicate, and % transmittance was recorded as the mean value ± standard deviation (SD) (Date & Nagarsenker, Citation2007; Farghaly et al., Citation2018).
2.5. Construction of pseudoternary phase diagrams
From the pseudoternary phase diagrams, the concentration of the mixed lipid, surfactant, and cosurfactant was selected (Patel et al., Citation2013; Kaur et al., Citation2018; Lin et al., Citation2021). Briefly, the surfactant/cosurfactant mixture ratios (Km) were 3:1, 4:1, 5:1, 6:1, 7:1, and 8:1, the lipid phase and Km were prepared at ratios (w/w) of 1:9, 2:8, 3:7, 4:6, 5:5, 6:4, 7:3, 8:2, and 9:1 in pre-weighed beakers. The lipid phase was melted, and the required quantity of Km was gently mixed to form a monophasic mixture that was slowly titrated dropwise with distilled water under constant stirring at 37 °C until equilibrium was reached. The system with low viscosity and clear appearance was considered to be a microemulsion. The critical points between the microemulsion region and other phase regions were identified when the appearance of the system changed from clear to turbid and vice versa. The amount of water consumed was recorded and used to calculate the final weight percentages of water, oil, and Km to complete the pseudoternary phase diagrams. Finally, Origin Pro software (Version 9.1, USA) was used for the construction of pseudoternary phase diagrams.
2.6. Screening of drug-to-lipid ratios
The solubility of the drug in the mixed lipids was investigated according to the above method of determining the solubility of the drug in mixed lipid. According to the solubility of the drug in the mixed lipid at doses of 0.8%, 1.6%, 2.5%, 3.2%, and 5% in the mixed lipid (Km = 6, Km: mixed lipid = 7:3), three parallel replicates were prepared for each dose, and the range of drug-to-lipid ratios was screened.
2.7. Experimental design
Formulation factors including Km (the weight ratio of CRH 40 and Transcutol®P, X1), the amount of mixed lipid (the weight ratio of monolaurin and Capryol-90, 2:1, X2), and the weight ratio of SRB and the mixed lipid (X3) could significantly affect the drug concent (Y1) and particle size (PS)(Y2) of NLCs (Shahab et al., Citation2020; Selvaraj et al., Citation2020; Zafar et al., Citation2021). Therefore, a central composite design-response surface methodology (CCD-RSM) was utilized to evaluate the formulation factors and to optimize the formulations. The experimental range of each variable was selected based on the results of the preliminary experiments. shows the independent factors and their design levels in this study. The experiments were designed using Design-Expert ® software (Stat-Ease, Inc. Minneapolis, MN).
Table 1. Independent variables and the correspondent values in coded and physical form.
Table 2. Solubility of SRB in solid lipids, liquid oils, surfactants, and cosurfactants (mean ± SD, n = 3).
2.8. Preparation of SRB-NLC
Based on the CCD-RSM screening results, the optimal SRB-NLC formulation was selected. SRB-loaded formulations (0.05% SRB) were prepared by a spontaneous emulsion method (Li et al., Citation2016b). Briefly, a lipid mixture of monolaurin and Capryol-90 (2:1, w/w) was chosen as the lipid phase, CRH 40 and Transcutol®P were selected as the surfactant and the cosurfactant, respectively. The lipid phase was melted, and the required quantity of surfactant was gently mixed to form a monophasic mixture. SRB was dissolved in the mixtures. Finally, distilled water was added dropwise to the mixture and vortexed for 1–2 min to obtain a homogeneous mixture. No precipitate was observed in the final drug-loaded formulations. The transparent light blue emulsion was cooled to room temperature to form the SRB-NLCs, and the volume was fixed to the prescribed amount.
2.9. Characterization of SRB-NLC
2.9.1. Determination of PS, polydispersity index (PDI), zeta potential (ZP)
The average PS, PDI, and ZP of SRB-NLC formulations were performed by dynamic light scattering method (Zetasizer, NanoZS90, Malvern Instruments, Worcestershire, UK) where light scattering was monitored at 25 °C and an angle of 90°. Each sample was diluted with purified water (1:20, v/v) and filtered with 0.22 μm filters (Jain et al., Citation2015).
2.9.2. Encapsulation efficiency (EE) and drug loading (DL) assessments
The encapsulation efficiency (EE) of SRB was determined according to the procedure described previously (Chen et al., Citation2007; Vieira et al., Citation2020). Centrifuge filters (Amiccon@Ultra4, Ireland Regenerated Celluloses, MWCO: 10 kD) were used to separate the unentrapped SRB in NLCs by centrifugation (Centrifuge 5810 R, Eppendorf, Germany) (4000 rpm, 10 min, at 25 °C). The filtrate was assayed by HPLC (2.3 HPLC analysis of SRB), and the amount of unentrapped SRB was calculated. The EE was calculated from this value with respect to the initial SRB-NLC. The EE and DL were determined with the following equations:
(1)
(1)
(2)
(2)
where Wa is the initial amount of the SRB to be added to the SRB-NLC system, Wf is the amount of free SRB in the filtrate, and WL is the weight of mixed lipid added to the system.
2.9.3. Morphological observation of SRB-NLCs
The morphology of the optimized SRB-NLC dispersion was characterized by transmission electron microscopy (TEM) (JEM-F200, Tokyo, Japan) with an accelerating voltage of 200 kV. A drop of SRB-NLC dispersion that was diluted 100-fold with purified water onto a 400-mesh copper grid was allowed to air-dry under room temperature before TEM observation. Bright-field imaging at an increasing magnification coupled with diffraction modes was used to explore the form and size of the NLC formulation.
2.9.4. Differential scanning calorimetry (DSC)
DSC analysis was used to determine whether the SRB in the formed NLCs were crystalline or amorphous based on a previous study (Khan et al., Citation2016). Briefly, the liquid form of SRB-NLCs and blank NLCs was lyophilized using a freeze dryer (RLPART-2LD, CHRIST, Germany) at −50 °C for 72 h. For the DSC study, 2 mg of samples (sorafenib, freeze-dried blank NLCs and freeze-dried SRB-NLCs) were placed in aluminum pans sealed with a lid. Another empty aluminum pan was used as a reference. The temperature of the instrument was varied from 0 °C to 260 °C and was controlled under a nitrogen flow of 20 mL/min. The thermograms of samples were obtained at a scanning rate of 10 °C/min.
2.9.5. pH and osmolality measurements
To ensure that the instillation of ophthalmic formulations does not cause any damage to the ocular tissues (Almeida et al., Citation2017), the pH values of the SRB-NLC dispersions were determined using a calibrated pH meter (pHS-3C, Precision & Scientific instrument Co., Ltd. Shanghai, China) and were adjusted to 5.0–6.5 by adding 1 M NaOH solution. The isotonicity of the ophthalmic formations was ensured by adding appropriate amounts of glycerin. The osmolality values of the formulations must be identical to those of physiological fluids (Bhalerao et al., Citation2019; Shen et al., Citation2010). The osmolality value of the SRB-NLC solution was adjusted to 270–300 mOsm/kg by adding glycerin and determined using a freezing point osmometer (STY-1A, Tianjin, China). All measurements were carried out in triplicate.
2.10. Short-term storage stability
It is important to evaluate the stability of the developed NLC formulations. The stability of the optimized SRB-NLCs after storage at 25 °C and 4 °C was evaluated for three months. The optimized SRB-NLCs were evaluated for the changes in their physical and chemical characteristics, such as PS, PDI, pH, drug content, EE, and DL (Elmowafy et al., Citation2017). The experiments were carried out in triplicate for each sample, and the results were presented as a mean ± SD.
2.11. In vitro release
An in vitro drug release study from NLCs was performed under sink conditions according to the dialysis bag method with a molecular weight cut off (10 KD) (Liu et al., Citation2014; Ammar et al., Citation2020; Maria et al., Citation2017). A total of 0.5 mL of each 0.05% of freshly prepared sorafenib suspension (SRB-Susp) or NLC dispersion (W0=0.25 mg) was placed in treated dialysis bags immersed in 100 mL of freshly prepared dissolution medium (0.25% Tween 80 artificial tear solution, pH = 7.4) at 37 °C in an incubator (JBQ-ZD, Changzhou Putian Instrument Manufacturing Co. Ltd., Jiangsu, China) at 100 rpm. Aliquots of 0.5 mL medium were collected at predetermined times and the same volume aliquots of fresh medium were added at the same time. Drug content of the samples was analyzed by HPLC. The analysis was performed in triplicate, and the results are expressed as the mean ± SD. The accumulative release percentage (Q%) of SRB released from the SRB-NLC was calculated by the following EquationEquation (3)(3)
(3) . The kinetic analysis of the release data was fitted to various kinetic models, such as zero order, first order, Higuchi’s equation, and Korsmeyer-Peppas.
(3)
(3)
where W0 is the total weight of the drug in the SRB-NLCs added in the dialysis bag, Cn is the SRB concentration in the released medium at tn, V is the total volume of the released medium, Vi is the sample volume at ti, Ci is the sample concentration at ti, and tn is sampling at the Nth time (Li et al., Citation2016c).
2.12. In vitro cytotoxicity test
Human corneal epithelial cell lines were used to evaluate the toxicity of SRB-NLC by the CCK-8 method in vitro (Li et al., Citation2014; Shi et al., Citation2019). HCECs were seeded in 96-well plates at 1 × 10⁴ cells per well in 100 μL of DMEM/F12 medium containing 10% fetal bovine serum (FBS) and 1% double anti-solution (penicillin and streptomycin solution). HCECs were cultured in an incubator (37 °C, 5% CO2) for 24 h. One hundred microliters of a series of blank NLCs and SRB-NLCs at different concentrations (5, 10, 50, 250 μg/mL) were added to the human corneal epithelial cell culture wells for 0.25, 1, 2 or 4 h. A 10% CCK-8 solution (100 μL) was added, and after 4 h of incubation, the absorbance was measured at 450 nm in a microplate reader (PerkinElmer 2104 Multilabel Reader, Shanghai, China). The cell viability was calculated as follows: cell survival rate = (experimental absorbance/control absorbance) ×100%.
2.13. Ocular irritation test
An ocular irritation test was performed with the SRB-NLC formulation in six New Zealand White rabbits according to the modified Draize test (Wang et al., Citation2019). Before the test, both eyes of the rabbits were checked and verified to be without lesions or inflammation. For single-dose administration, 0.1 mL of SRB-NLC eye drops (0.05%) was administered into the conjunctival sac of the left eyes, the eyes were gently closed for 15 s, and 0.1 mL of normal saline solution was administered in the contralateral eye to serve as a control. The rabbit eyes were inspected with a slit lamp microscope (SL-14, Kowa, Japan) for ocular irritation (such as redness, discharge, chemosis of the conjunctiva, and status of the cornea and iris) under visible light and Cobalt blue light at different time points (1, 2, 4, 24, 48, and 72 h). The irritation score was the mean value of the sum score from six treated eyes, and the irritation level was evaluated according to the Draize rule. According to the observed irritation, a score at each time in the range of 0 to 3 was considered no irritation, and a total score of more than 4 for the ocular irritation index or a score of 2 or 3 for any item was considered a significant irritant (Kalam et al., Citation2016; Zhou et al., Citation2017;Jain et al., Citation2020).
2.14. Ocular pharmacokinetics in rabbit eyes
2.14.1. Rabbits and treatments
Forty-two male New Zealand White rabbits weighing 2.0–2.5 kg that were free of eye diseases were used and randomly divided into two groups. The SRB-NLC solution was administered to the bilateral eyes of each animal in the experimental group, while animals in the control group were administered with SRB-Susp. A dose of 50 μL was instilled into the lower conjunctival sacs of both eyes of every rabbit. The eyelids were kept closed for 15 s after administration. Tear fluid samples were collected by placing a sterile filter paper disk 7 mm in diameter under the lower eyelid of the rabbit’s eye for only 30 s at the predetermined time (0.0833 h, 0.5 h, 1 h, 2 h, 4 h, 8 h, 12 h). The eyelids were kept closed for 15 s after administration. The rabbits were sacrificed by a lethal dose of phenobarbital sodium solution (4%, w/v) intravenously administered through a marginal ear vein at the predetermined time after administration. The aqueous humor (AH) was collected by a disposable sterile syringe with a 26-G needle from the limbus after the ocular surface of the eye was rinsed with saline. Then, corneal and conjunctivas samples were harvested with surgical scissors and forceps. All corneas and conjunctivas were rinsed with saline, blotted with filter paper and weighed. All samples were stored at −80 °C until they were used for extraction (Li et al., Citation2018).
2.14.2. Analysis of ocular tissues and aqueous humor and tear fluids
The previously reported method used to determine SRB levels in biological samples (Luo et al., Citation2013) was modified and validated. The extraction of drug from tissues was conducted according to a previously described method (Zhou et al., Citation2017). Briefly, each aliquot of cornea and conjunctiva tissues was cut into small pieces; 400 μL of methanol was added to each tissue aliquot, and each sample was sealed and immersed for 24 h. Then, 100 μL of methanol was mixed with AH, and 400 μL of methanol was added to tear samples and vortexed for 1 min (Patel et al., Citation2016). All methanol mixture samples were centrifuged with centrifuge (MiniSpin ® Plus, Eppendorf, Germany) at 10,000 rpm for 10 min, and the supernatants were used for HPLC analysis. The pharmacokinetic parameters were calculated by DAS2.1.1 software (Bio Guider Medicinal Technology Co., Ltd, Shanghai, China).
2.15. In vivo anti-corneal neovascularization efficacy
2.15.1. Alkali burn injury induced CNV in mice and treatments
Eighty male BALB/c mice weighing 20–25 g free of eye diseases were chosen. Corneal neovascularization model in mice was established by alkali injury following the reported method (Zhou et al., Citation2010). Briefly, all animals were anesthetized by intraperitoneal injections of 1% sodium pentobarbital (80 mg/kg) and additional topical anesthesia with 0.4% oxybuprocaine hydrochloride eye drops. Next, a filter paper with 2 μL NaOH (0.1 M) solution was placed on the right central cornea for 20 s and then immediately rinsed with 20 mL of 0.9% saline solution along the conjunctival sac. The mice were randomly divided into five groups (16 subjects per group) after receiving alkali burns, which are negative control group (Saline), high-dose group (H), medium-dose group (M), low-dose group (L), and positive control group (DEX), and they were treated with saline, SRB-NLC at concentrations of 0.05%, 0.025%, and 0.0125%, and dexamethasone eye drops, respectively. Each group was treated with a single dose of 5 μL twice a day for seven consecutive days.
2.15.2. Quantification of corneal neovascularization and measurement of corneal epithelial defects
On days 0, 1, 2, and 3 after treatment, the corneal epithelial damage in each group was observed via a slit-lamp microscope (SLM-8E, Chongqing Kanghua, China) with cobalt blue light examination (after fluorescein staining). On days 1, 3, and 7 after treatment, the development of mouse corneal neovascularization was observed and photographed using a digital camera on the slit-lamp microscope. On day 7, a flat-mount-based method was used for the quantification of corneal neovascularization (Irani et al., Citation2017). Three mice from each group were injected with four units of heparin (Zhuhai BesoBio Co., Ltd., China) per 10 g of body weight and subjected to general anesthesia by intraperitoneal injection of 1% pentobarbital sodium solution. The thoracic and abdominal cavities were opened, and the inferior vena cava and descending aorta were clamped close to the heart. An infusion needle was inserted into the cavity of the left ventricle. The mice were perfused with 20 mL warm heparinized saline, followed by 20 mL hematoxylin solution (1:3 hematoxylin: saline) perfusion via the aorta. The right eyes were enucleated and placed in buffered formalin for 15 min at room temperature and then placed in PBS. The cornea was dissected and flat-mounted. The areas of CNV were calculated with ImageJ software (version 1.41, National Institutes of Health, USA) (Yoon et al., Citation2006; Li et al., Citation2016a).
2.15.3. Histopathological observation
Mice were euthanized on day 7 after treatment. Three mice from each group were sacrificed by intraperitoneal injection of an overdose of 1% sodium pentobarbital solution, and the whole eyeball was collected. After the cornea was trimmed, it was fixed in 4% paraformaldehyde for 48 h. Then, the cornea was subjected to tissue dehydration-transparent-dip wax-tissue embedding, tissue sectioning, and rehydration-staining-dehydration-sealing. Sagittal sections (5 µm) were stained with hematoxylin and eosin. Images of H&E-stained sections were captured using a fluorescence microscope (Nikon 80i, Japan) (Xiao et al., Citation2012).
2.15.4. Enzyme-linked immunosorbent assay
On day 3 and day 7 after treatment, five mice in each group were sacrificed by intraperitoneal injection of an overdose of 1% sodium pentobarbital solution. Corneal tissues were collected and weighed, and then frozen at −80 °C until analysis. Before analysis, the corneas were rewarmed at 4 °C for half an hour and cut into small pieces with ophthalmic tissue scissors. Then, 100 μL of ristocetin-induced platelet agglutination (RIPA) was added to submerge the tissue, the samples were placed in an ice bath for 1.5 h and then centrifuged at 12,000 rpm at 4 °C for 5 min, and the supernatant was transferred to another EP tube for later use (Xiao et., al Citation2012). The protein levels of VEGF-A and PDGF-AB in the cornea were normalized to the total protein content, as determined by a bicinchoninic acid (BCA) kit, following the manufacturers’ instructions. Absorbance at 450 nm was measured by a microplate reader (PerkinElmer 2104 Multilabel Reader, Shanghai, China).
2.16. Statistical analysis
All experimental data were statistically analyzed with SPSS statistical software (Version 21.0) and expressed as the mean ± standard deviation (X ± SD). One-way analysis of variance was used for comparisons among groups, and an independent sample t test was used for pairwise comparisons. When P < 0.05, the difference was considered statistically significant.
3. Results
3.1. Screening of solid lipids, liquid oils, surfactants, and cosurfactants
The optimal liquid and solid lipids were screened according to the capacity of the liquid and solid lipid dissolved drugs to prepare NLCs (Negi et al., Citation2014). SRB had good solubility in monolaurin, Capryol-90, and Transcutol®P (). Therefore, these lipids were used as ingredients in the NLC formulations. The results demonstrated that the solubility of sorafenib in CRH 40 and HS-15 (71.81 ± 1.05 mg/g and 74.36 ± 1.53 mg/g, respectively) had no significant difference. The emulsifying ability of CRH 40 and HS-15 was compared to select the better one for preparing NLCs.
3.2. Selection of solid–liquid lipid ratio
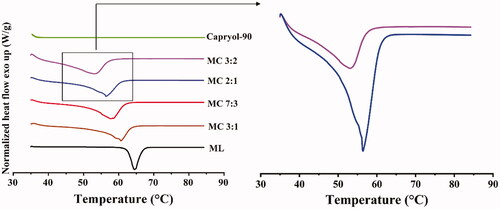
DSC studies are often first employed to assess the crystalline behavior of the lipid phase (Beloqui et al., Citation2016; Montenegro et al., Citation2016). On the one hand, considering that the solubilization of SRB is significantly greater in monolaurin than in Capryol-90, NLCs with higher amounts of monolaurin are preferred, and the addition of Capryol-90 increases the number of imperfections in the crystalline structure of solid lipids. On the other hand, a prerequisite for the production of NLCs is that the mixture of solid and liquid lipid has to be solid at room temperature. DSC thermograms () of monolaurin and Capryol-90 mixtures in different blending ratios reveal thermograms of lipid mixtures with the lowest monolaurin/Capryol-90 (MC) ratios (MC 3:2, MC 2:1, , right). Therefore, 2:1 was selected as the ratio for the solid–liquid mixture.
Figure 1. Left: DSC melting curves of the different ratios of monolaurin and Capryol-90 ratios. Right: Detailed DSC thermograms of MC mixtures.
3.3. Emulsification ability of CRH 40 and HS 15
The percentage transmittance values of the dispersions were 82.97 ± 1.98% and 73.97 ± 3.98%, as shown in . The data indicated that CRH 40 had the better ability to emulsify the mixed lipid; thus, CRH 40 was selected for further investigation.
Table 3. Emulsification efficiency of CRH 40 and HS 15 (mean ± SD, n = 3).
3.4. Construction of pseudoternary phase diagrams
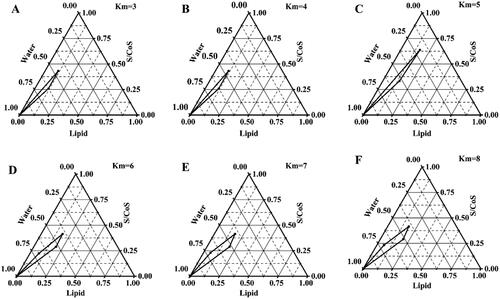
Pseudoternary phase diagrams were plotted to identify the microemulsion regions by the water titration method, and the area where a mixture of mixed lipids, CRH 40 (surfactant) and Transcutol®P (cosurfactant) at a certain ratio existed as a clear and uniform microemulsion. The pseudoternary phase diagrams with different Km values (3:1, 4:1, 5:1, 6:1, 7:1, and 8:1) of CRH 40 to Transcutol®P are shown in . The phase study suggested that the area of the microemulsion region did not increase as the km increased from 7:1 to 8:1, indicating that the optimum emulsification was achieved at a Km of 7:1. Thus, the selected range of Km value was 3– 7.
Figure 2. Pseudo ternary phase diagrams prepared with mixed lipid (solid lipid to liquid oil is 2:1), CRH 40 (surfactant) and Transcutol®P (cosurfactant).
3.5. Experimental design
The SRB-NLC formulations were optimized using CCD-RSM to achieve better drug content and particle size (Lakhani et al., Citation2018). illustrates the 20 experimental runs obtained from design with their observed predicted responses. The R2 of Y1 (drug content) was 0.99, Y2 (particle size) was 0.98, and the P value of the model was less than 0.05, indicating that the model was significant and could accurately analyze the changes in dependent variables. The ‘predicted R2’ was in reasonable agreement with the ‘Actual R2’ values (). Equations for responses containing significant terms were as follows:
Figure 3. Actual versus predicted value.
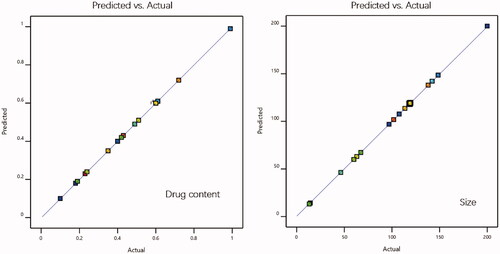
Table 4. Experimental design for SRB-NLC.
3.6. Preparation of the optimized SRB-NLCs
According to the optimized CCD-RSM prescription, the optimized NLC formulation was composed of drug/mixed lipid ratio at 0.02 and the ratio of mixed lipid to Km (CRH40: Transcutol®P = 3:1, w/w) was fixed at approximately 1:3; 0.05% (w/v) SRB was soluble and could be incorporated into the final NLC system, and the optical appearance of the formulation was transparent, with excellent physical stability. About 0.05% (w/v) SRB-NLC was prepared by the microemulsion method (Section 2.8). The samples were diluted to 20 mL, and a light blue uniform solution was obtained. Glycerin (0.13 g) and 1 M NaOH were added to adjust the solution osmolality and pH values of SRB-NLCs, respectively, which demonstrated the suitability of this simple process for further industrialization.
3.7. Characterization of the SRB-NLCs
3.7.1. Physicochemical characterization of the SRB-NLCs
The results of the PS, PDI, ZP, pH, osmolarity, and EE are shown in . The PS of SRB-NLC particles were 111.87 ± 0.93 nm with a PDI of less than 0.25, which was appropriate and met the requirements for nanosystem NLCs (100–200 nm) as previously defined (Kovács et al., Citation2017). The PDI data suggested that the SRB-NLCs had good homogeneity (Gönüllü et al., Citation2015). The optimized SRB-NLCs had a high EE (99.20 ± 0.86%), which also showed the advantages of the NLCs. The TEM images () of the SRB-NLCs showed that the particles were spherical in shape and separated from each other, which was consistent with the PS distribution data (). DSC thermograms () were recorded for sorafenib, blank NLC lyophilized powder, and lyophilized SRB-NLCs. The DSC curve of sorafenib showed a single sharp endothermic peak at 211.25 °C, while the thermograms of SRB-NLC did not show the melting peak of SRB crystals. Moreover, the curve of SRB-NLC was similar to that of blank NLC, indicating that the drug was encapsulated in NLC. The pH value of the ophthalmic formulations was 5.67 ± 0.14, and the osmolality of the ophthalmic formulations was 296.89 ± 2.54 mOsm/kg, which met the requirements of eye drops.
Figure 4. The TEM images of blank NLC (left) and SRB-NLC (right).
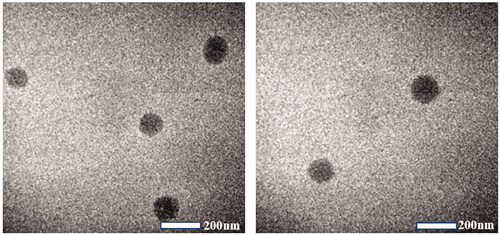
Figure 5. The particle size distribution of optimized SRB-NLC.
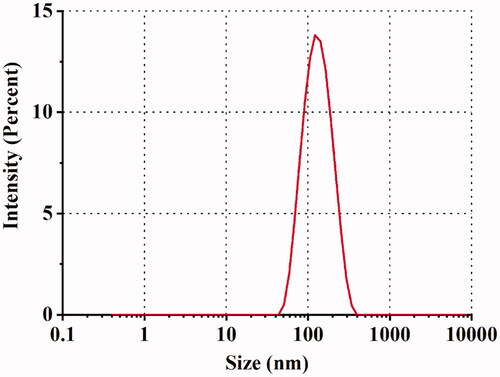
Figure 6. DSC diagrams of the SRB, SRB-NLC and Blank NLC samples.
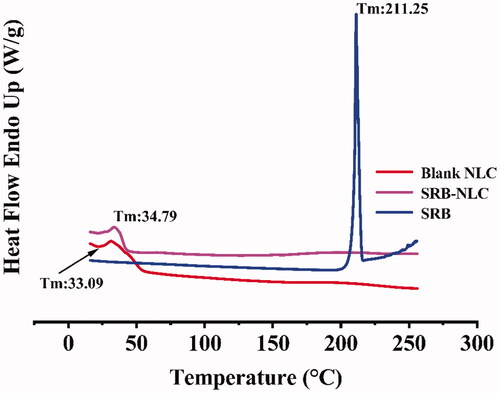
Table 5. Characterization of optimized SRB-NLC (n = 3, Mean ± SD).
3.8. Short-term storage stability
The short-term stability under different storage conditions (4 °C and 25 °C) on PS, PDI, pH, EE and drug content is shown in . There were significant changes in PS, PDI, and EE at 4 °C, which were resulted from the instability of monolaurin in the system at 4 °C. The formulation showed no precipitation or crystallization during the three months at 25 °C, and there was almost no change in the values of PS, EE, and drug content, which indicated that SRB-NLC was relatively stable at 25 °C.
Table 6. Short-term stability study of SRB-NLC (n = 3, mean ± SD).
3.9. In vitro release
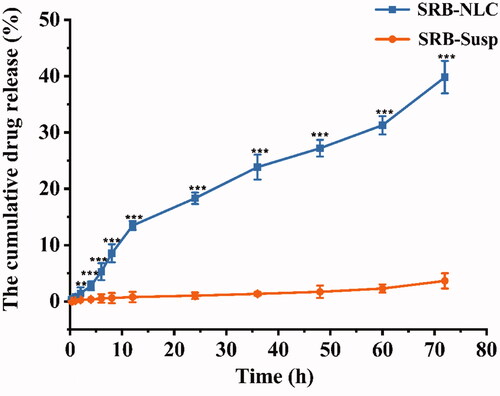
The dialysis bag diffusion technique was used to investigate SRB release from NLCs. The in vitro release behavior of SRB-NLCs is shown in . The release data obtained showed that the SRB release rate from NLCs was significantly faster than that from the SRB-Susp (P < 0.001). The release data obtained showed that up to 0.97% of SRB from NLCs was released over the initial stages of 1 h followed by a sustained release pattern and reached 39.82% after 72 h. The results from in vitro release studies demonstrated that the NLC formulation released SRB in a sustained release pattern, which was caused by the lipid nature of the lipid nanoparticles and was due to the high drug EE (Chen et al., Citation2010). The R2 value indicated that drug release followed zero-order kinetics in the case of SRB-Susp and Korsmeyer-Peppas kinetics in the case of SRB-NLC (). Based on the model, the value of n was 0.44 (0.43 < n < 1.0), which suggests that SRB release from NLCs was attributed to drug diffusion and lipid matrix erosion (Almeida et al., Citation2017).
Figure 7. Comparative drug in vitro release profile of optimized SRB-NLC and SRB-Susp. Data represented as mean ± SD, n = 3. (*P < 0.05, **P < 0.01, ***P < 0.001 vs. SRB-Susp).
3.10. Ocular irritation test
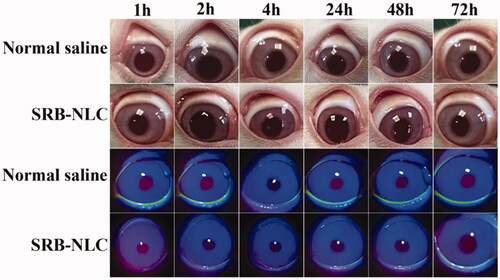
The Draize test was carried out to investigate the irritation potency of SRB-NLCs, with physiological saline as a control. As shown in , no sign of damage was observed to the cornea or conjunctivae. The total irritation scores from the Draize analysis were 0 for the cornea, conjunctiva, and iris. The results suggested that SRB-NLCs do not cause irritation.
Figure 8. Results of rabbit eye irritation after single instillation of SRB-NLC (0.05%) and saline. The ocular conditions of each group were observed at different time points.
3.11. In vitro cytotoxicity test
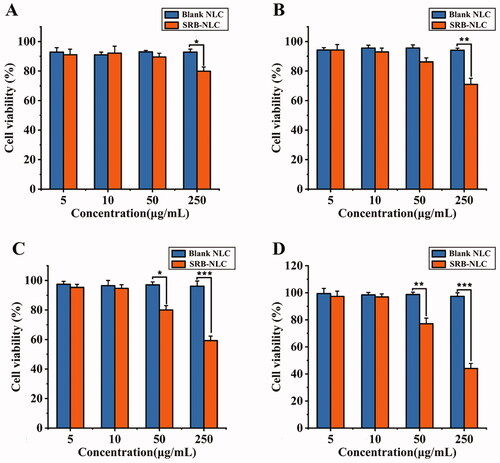
Cellular viability was evaluated using the CCK-8 assay. The results indicated that the cytotoxicity of SRB was dependent on its concentration, as shown in . SRB-NLC did not show any cytotoxicity against HCECs at concentrations of 5 μg/mL and 10 μg/mL. The cell viability of HCECs at SRB-NLC concentrations of 50 μg/mL was decreased after 2-h incubation period. At a concentration of 250 μg/mL, the cell viability in the SRB-NLC-treated groups was less than 60%, representing remarkable toxicity after a 0.25-h incubation period. Taken together, these results suggested that NLCs have good cytocompatibility and that the viability of these cells was not affected by SRB-NLCs at a suitable concentration.
Figure 9. Results of CCK8 evaluation (n = 6). Cell viabilities of human corneal epithelial cells under (a) 0.25 h, (b) 1 h, (c) 2 h, and (d) 4 h cultivation with a series of Blank NLC and SRB-NLC solution (5 μg/mL, 10 μg/mL, 50 μg/mL, 250 μg/mL) (*P < 0.05, **P < 0.01, ***P < 0.001 vs. blank NLC).
3.12. Ocular pharmacokinetics studies in rabbit
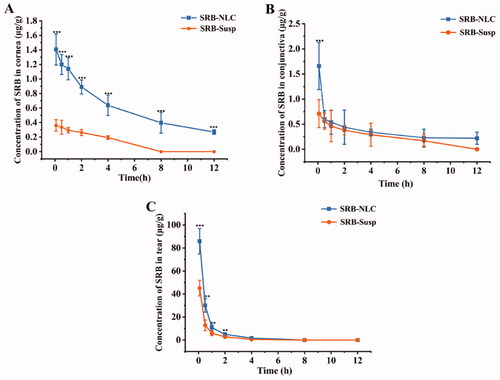
The profiles of the concentration-time course of SRB concentrations in the corneas, tears and conjunctivas are displayed in after single topical administrations of SRB-NLCs and SRB-Susp. Significantly higher concentrations of SRB were observed in the cornea following treatment with SRB-NLC compared with treatment with SRB-Susp after administration at the corresponding time points. The observed SRB levels in the cornea 0.083-, 0.5-, 1-, 2-, 4-, and 8-h after a single topical administration of SRB-NLC were 3.90-, 3.63-, 3.87-, 3.39-, and 3.29-fold higher (P < 0.01), respectively, than those observed after a single topical administration of SRB-Susp. The observed SRB levels in the conjunctiva 0.083, 0.5, 1, 2, 4, and 8 h following SRB-NLC administration were 2.34, 1.07, 1.17, 1.16, 1.17, and 1.35-fold higher, respectively, than those observed after SRB-Susp administration (P < 0.01). Additionally, in the tears, the SRB levels in the SRB-NLC group were 1.90, 2.35, 1.80, 1.77, and 2.80-fold higher than those in the SRB-Susp group (P < 0.01) at 0.083, 0.5, 1, 2, and 4 h, respectively. The SRB levels in the AH were below the limit of quantitation (0.01 μg/mL). Ocular pharmacokinetics also showed a 6.79-fold, 1.24-fold, and 1.90-fold increase in the area under concentration-time curves (AUC0-12h) over the 12 h in the cornea, conjunctiva and tears, respectively, with a single SRB-NLC treatment compared with a single SRB-Susp treatment in rabbits (Table 8).
Figure 10. Concentration-time profiles of SRB in rabbit corneas (a), conjunctivas (b), and tear (c) following the single topical instillation of SRB-NLC and SRB-Susp (mean ± SD, n = 6). (*P < 0.05, **P < 0.01, ***P < 0.001 vs. SRB-Susp).
3.13. In vivo anti-corneal neovascularization efficacy
3.13.1. Quantification of corneal neovascularization and measurement of corneal epithelial defects
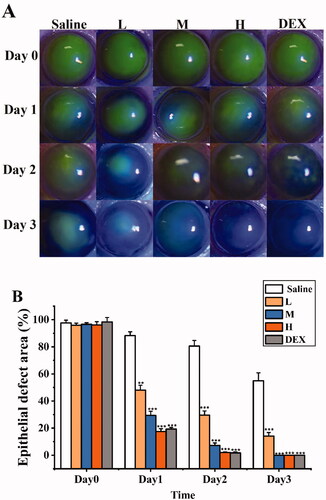
To investigate the anti-CNV effects of SRB-NLC, an alkaline-induced CNV mouse model was established. As shown in , corneal epithelial defects were evaluated by fluorescein staining. Fluorescent sodium staining of the corneal epithelium showed that the defect area of the corneal epithelium was similar in each group on day 0, with no significant differences among the groups, which indicated that the model was successfully established. There were significant differences in the improvement of epithelial defects among the three groups (L, M, H) on day 1 after treatment (p < 0.05, ). The results showed that SRB could effectively promote the recovery of corneal epithelial defects after alkali burn injury.
Figure 11. SRB promoted corneal epithelial recovery after treatment. (a) Representative images of the mice corneas with fluorescein staining. (b) The area of epithelial defect. (L: 0.0125% SRB-NLC, M: 0.025% SRB-NLC, H: 0.05% SRB-NLC) (*P < 0.05, **P < 0.01, ***P < 0.001 vs saline).
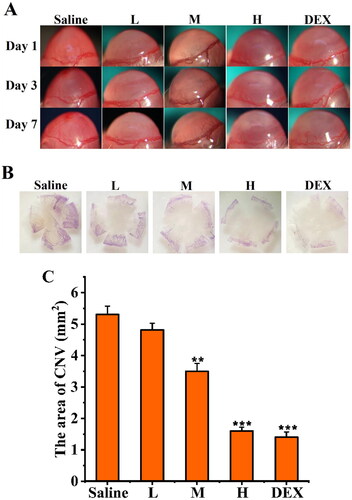
Shorter and fewer new corneal vessels, associated with CNV, were observed in the high dose and positive control group than in the other treatment groups and the blank control group on days 1, 3, and 7 (). There were significant differences in the area of CNV among the three groups (L, M and H) on days 1, 3, and 7 after treatments (all P < 0.05; ). The area of CNV in the high-dose group was reduced significantly compared with that in the control group, and the effect of this treatment was similar to that of dexamethasone. Therefore, after treatment with SRB-NLC, the development of CNV was inhibited. The inhibitory effect on CNV was dose dependent.
Figure 12. Inhibitory effect of SRB-NLC on corneal neovascularization (CNV). (a) Representative images of CNV on days 1, 3, and 7 after treatment. (b) Representative images of corneal flat-mounts are displayed under each group. (c) The area of CNV in the five groups at different checkpoints. The area of CNV in the high-dosage group reduced significantly compared with the control group. (L: 0.0125% SRB-NLC, M: 0.025% SRB-NLC, H:0.05% SRB-NLC) (n = 3, *P < 0.05, **P < 0.01, ***P < 0.001 vs. saline).
3.13.2. Histopathological examination
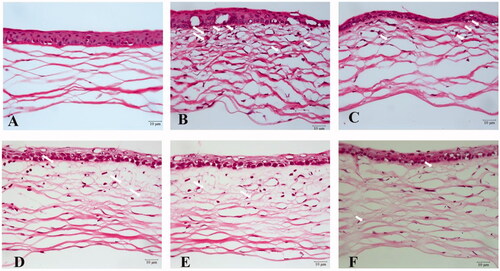
The corneal structure of the normal group was uniform and clear with neatly arranged epithelial cells and regularly and orderly arrayed collagen fibers in the stroma (). The cornea from the saline treatment group showed disordered corneal epithelium, irregular epithelial cell arrangement, thickened collagen fiber spaces, disordered collagen fiber arrangement in the stroma, and obvious angiogenesis, as shown in . In contrast, corneas from the H and DEX treatment groups exhibited some improvements in corneal structure, and there was less angiogenesis in throughout the corneal tissue (). These results were in agreement with the results of the CNV area analysis. These results indicated that high-dose SRB-NLC therapy has strong inhibitory effect on CNV.
Figure 13. Histopathological examination of mice cornea. (a) Hematoxylin and eosin (HE) staining of corneal sections in the normal group (400×); (b) HE staining of corneal sections in the saline group (400 ×); (c) HE staining of corneal sections in the 0.0125% (L group) (400 ×); (d) HE staining of corneal sections in the 0.025% SRB-NLC group (M group) (400×); (e) HE staining of corneal sections in the 0.05% SRB-NLC group (H group) (400×); (f) HE staining of corneal sections in the glucocorticoid group (DEX group) (400×). The arrow indicates corneal neovascularization.
3.13.3. Enzyme-linked immunosorbent assay
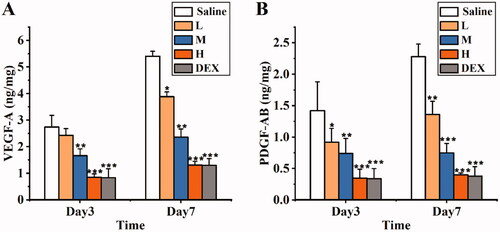
The levels of VEGF-A and PDGF-AB were measured by ELISA (). The results revealed that the VEGF-A and PDGF-AB levels in corneal tissues from the SRB-NLC treatment groups (M and H) and DEX group were significantly lower than those in the corneal tissues from the saline group (P < 0.05) on days 3 and 7 after treatment. Further analysis showed that there were significant differences among the three SRB-NLC treatment groups (L, M, and H) (P < 0.05). There were no significant differences in the expression of the above proteins between the high-dose group and the DEX group (P > 0.05). These results indicated that the inhibitory effect of SRB-NLC on corneal neovascularization was dose dependent, and the effect observed in the high-dose group was similar to that observed in the dexamethasone group.
Figure 14. Protein expression in cornea on the day 3 and day 7 after treatment: the levels of VEGF-A (a) and PDGF-AB (b) were determined by Elisa in the cornea tissue respectively. (L: 0.0125% SRB-NLC, M: 0.025% SRB-NLC, H:0.05% SRB-NLC) (*P < 0.05, **P < 0.01, ***P < 0.001 vs. saline).
4. Discussion
CNV is an important cause of decreased corneal transparency and poor vision. Previous studies have shown that VEGF is essential to induce CNV in the human cornea and in animal models (Sharif & Sharif, Citation2019). Therefore, the current antiangiogenic therapy involving anti-VEGF and VEGF-related molecules provides a promising method for alleviating CNV. In multiple angiogenesis models, blocking both VEGF and PDGF signals is more effective than blocking VEGF alone (Pérez-Santonja et al., Citation2010). As elucidated previously, due to its multitarget tyrosine kinase- and PDGFR-inhibiting capability, sorafenib is a potential candidate for CNV therapy. Ocular drug delivery remains a challenge for researchers due to the anatomical and physiological barriers of the eye, which result in poor drug bioavailability and rapid drug clearance (Barry et al., Citation2020). NLC formulations have been reported to be preferred among ocular drug delivery systems as they increase transport through the ocular epithelial layer and prolong residence in the precorneal area (Seyfoddin et al., Citation2010). Compared with other extensively studied nanocarriers based on polymers, NLC production methods usually do not include residues from organic solvents and allow for easy scale-up manufacturing.
Monolaurin and Capryol-90 were selected as the lipid phase, and CRH 40 and Transcutol®P were used as the surfactant and cosurfactant due to the high solubility of SRB. Notably, these lipids are already approved by European and US regulatory authorities for topical application, due to their well-established usage in various dosage forms, and are generally recognized as safe status (Sánchez-López et al., Citation2017). The selection of surfactants is limited to compounds that cause minimal or no ocular irritation and that are not ionic. Generally, the larger the area of the microemulsion area of the pseudoternary phase diagram, the stronger the microemulsion-forming ability of the formula (Zakkula et al., Citation2020). Pseudoternary phase diagrams can be used to determine the ratio of surfactant/cosurfactant: shows that the Km is 3–7, and the mixed lipid is 0.2–1 g. With the application of a 20 full factorial design, information about the interactions of factors can also be identified. Three formulation parameters of SRB-NLC were chosen as independent factors (the concentration of the emulsifier, the drug, and the total lipid). The particle size and drug content of the NLC systems were chosen as the optimization parameters (dependent factors). CCD-RSM uses a nonlinear mathematical model to fit the experimental results. In this manner, the optimized formulation of SRB-NLC with low particle size within the scope of increasing drug content was obtained. shows that the drug content increased as the surfactant and lipid concentrations increased. shows that the particle size decreased as the concentration of the surfactant increased. SRB-NLCs have an EE of 99.20 ± 0.86% and a particle size of 111.87 ± 0.93 nm. Morphological evaluation showed that the NLCs have a spherical structure ( and ).
Figure 15. Three-dimensional surface plot for showing effect of the interaction of (a) Km and total lipid on drug content, (b) Km and total lipid on size.
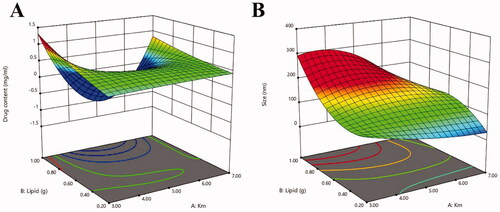
Table 7. Correlation coefficients (R2) and constant values for the different mathematical models applied to the release of SRB.
Table 8. Ocular pharmacokinetic parameters of SRB-NLC and SRB-Susp.
The pH of the SRB-NLCs was found to be in the range of 5.0–6.5, which is acceptable for ophthalmic delivery and well tolerated by the human eye. The osmolarity of the formulation for ocular delivery is also an important parameter that determines the irritability of the formulation, and ideally, it should be less than 290 mOsm/kg (Patel et al., Citation2013). All the formulations had osmolarity values in the range of 270–300 mOsm/kg. The drug content of all the formulations was also within an acceptable range. In this study, the pH of the SRB-NLC solution was adjusted to approximately 7.0, and it was found that the pH of the solution decreased to 5.0 within one month. This was likely resulted from the breakdown of the ester linkage in the molar structure of monolaurin and Capryol-90 into glycerol or propyl glycol and lauric acid or octoic acid, respectively. When the pH of the solution was adjusted to below 6.5, the pH remained stable for at least three months. Additionally, a controlled and prolonged release profile was observed for the SRB-NLC formulations. This behavior can be related to the SRB loaded into the lipid matrix and SRB-enriched lipid core decreasing the drug release rate (Khezri et al., Citation2021, Yildirim et al., Citation2020) showed that the percentage of the neovascular corneal area was significantly lower after the topical treatment of a solution with 0.05 mg/mL SRB and 0.07 mg/mL dimethyl sulfoxide (DMSO) than after the treatment with DMSO alone. It was reported that the IC50 values of sorafenib against the kinases VEGFR1, VEGFR2, and VEGFR3 ranged from 3.25 μg/L to 0.013 μg/mL and those against the kinases PDGFRα and PDGFRβ ranged from 2.3 μg/L to 52 μg/mL (Kumar et al., Citation2009). To achieve an anti-CNV effect with SRB, 5 mg/mL SRB was added to the NLCs due to the sustained release from the NLCs. NLCs were used to encapsulate SRB, which could allow easy scale-up manufacturing, as their production methods usually avoid the presence of residues from organic solvents (González-Fernández et al., Citation2021). The optimized SRB-NLCs showed sustained release.
When developing ophthalmic drug delivery systems, eye safety has always been a major issue. Studies have shown that rabbits are more sensitive to eye irritants than humans; thus, the safety to human eyes can be estimated based on the results of animal experiments ((a) Li et al., Citation2021). Next, the Draize irritation test scoring standard was used to evaluate the irritation caused by SRB-NLC eye drops in rabbit eyes. The results of the study showed that the eye irritation scores of the rabbits in the SRB-NLC group and control group were all 0 points, which demonstrated that SRB-NLC did not irritate the eyes and has good corneal biocompatibility and ocular tolerance (Diebold et al., Citation2007). In this study, HCECs were used to assess cytotoxicity (CCK-8 assay), and the results suggested that NLCs have good cytocompatibility and that the viability of these cells was not affected by SRB-NLCs at the suitable concentration.
An in vivo pharmacokinetics study was performed with New Zealand White rabbits. As shown in , the drug was immediately absorbed into the cornea, and the peak concentration was reached 0.083 h after the ocular application of SRB-NLC and SRB-Susp. After that, the drug concentration remarkably decreased. Finally, a slow elimination phase was observed. However, the drug concentrations were much higher after SRB-NLC administration than after SRB-Susp administration up to 12 h. The area under the curve (AUC0–12 h) of NLC formulations in the cornea was significantly higher than that of the SRB-Susp (P < 0.05). The NLC increased the drug permanence and bioavailability of sorafenib in the cornea and could reduce dosing frequency. The advantages were due to the NLC delivery system (González-Fernández et al., Citation2021). Interestingly, another observation from is that 0.083 h after the instillation of the different preparations, the drug concentration in the conjunctiva tissue was higher than that found in the cornea. The drug concentration remarkably decreasing after 0.083 h can be explained by the following factors. Compared with the cornea, the conjunctiva is more permeable to drugs (Moiseev et al., Citation2019), and the measured drug concentration is affected by individual absorption (Zhou et al., Citation2020). Despite this, conjunctival drug absorption is considered ineffective because the blood capillaries and lymphatics present in the conjunctiva could dissipate the drug into the systemic circulation (Liu et al., Citation2017). However, in our study, SRB was not detected in the aqueous humor at the different time points after administration of SRB-NLCs, which maybe the result from the charge and size of the drug molecule influence the permeation of the drug across eye barriers (Moiseev et al., Citation2019). Therefore, the detailed mechanism underlying corneal penetration needs to be further investigated.
In this study, a CNV model was established by alkali burn injury and used to investigate the antiangiogenic effect of SRB-NLCs. In this study, by assessing the area of neovascularization (), the antiangiogenic effects of SRB-NLCs were confirmed. Additionally, based on the analysis of the HE-stained sections at each time point, the SRB-NLC treatment can reduce the number of new blood vessels (). At the molecular level, topical administration of 0.05% SRB-NLC inhibited the protein expression of VEGF-A and PDGF-AB. VEGFRs were demonstrated to be the predominant mediator of VEGF-stimulated endothelial cell migration, proliferation, survival, and enhanced vascular permeability (Pérez-Santonja et al., Citation2010). PDGF is another major angiogenic factor, and SRB has a more potent effect on the inhibition of PDGF than VEGF at the same dosage. The group that was treated with a 0.05% SRB-NLC had no difference with the DEX group, suggesting that SRB represents an alternative to DEX as an anti-corneal neovascularization agent.
Conclusion
In this work, SRB-NLCs were successfully prepared using the CCD approach and characterized. The formulation was nontoxic in HCECs and nonirritant in rabbit eyes. The developed SRB-NLCs had good dilution stability and storage stability. In vitro release studies revealed that the NLC formulations exhibited sustained release unlike SRB-Susp. Pharmacokinetic studies in rabbits revealed a significantly higher concentration of drug in the cornea that was maintained up to 12 h due to slower release of the drug from the SRB-NLC formulation compared with that from the SRB-Susp. SRB-NLCs significantly inhibited CNV development in vivo and the expression and activation of VEGF-A and PDGF-AB protein in an alkaline burn injury model. Thus, SRB-NLCs exhibit potential as a novel pharmacotherapy in the management of CNV.
Disclosure statement
No potential conflict of interest was reported by the author(s).
Additional information
Funding
References
- Alam T, Khan S, Gaba B, et al. (2018). Adaptation of quality by design-based development of isradipine nanostructured-lipid carrier and its evaluation for in vitro gut permeation and in vivo solubilization fate. J Pharm Sci 107:2914–26.
- Almeida H, Lobão P, Frigerio C, et al. (2017). Preparation, characterization and biocompatibility studies of thermoresponsive eyedrops based on the combination of nanostructured lipid carriers (NLC) and the polymer Pluronic F-127 for controlled delivery of ibuprofen. Pharm Dev Technol 22:336–49.
- Ammar HO, Ghorab MM, Mostafa DM, et al. (2020). Development of folic acid-loaded nanostructured lipid carriers for topical delivery: preparation, characterisation and ex vivo investigation. J Microencapsul 37:366–83.
- Barry Z, Park B, Corson TW. (2020). Pharmacological potential of small molecules for treating corneal neovascularization. Molecules 25:3468.
- Beloqui A, Solinis MA, Rodriguez-Gascon A, et al. (2016). Nanostructured lipid carriers: promising drug delivery systems for future clinics. Nanomedicine 12:143–61.
- Bhalerao H, Koteshwara KB, Chandran S. (2019). Levofloxacin hemihydrate in situ gelling ophthalmic solution: formulation optimization and in vitro and in vivo evaluation. AAPS Pharm SciTech 20:272.
- Bondì ML, Botto C, Amore E, et al. (2015). Lipid nanocarriers containing sorafenib inhibit colonies formation in human hepatocarcinoma cells. Int J Pharm 493:75–85.
- Chen H, Gao J, Wang F, et al. (2007). Preparation, characterization and pharmacokinetics of liposomes-encapsulated cyclodextrins inclusion complexes for hydrophobic drugs. Drug Deliv 14:201–8.
- Chen CC, Tsai TH, Huang ZR, et al. (2010). Effects of lipophilic emulsifiers on the oral administration of lovastatin from nanostructured lipid carriers: physicochemical characterization and pharmacokinetics. Eur J Pharm Biopharm 74:474–82.
- Date AA, Nagarsenker MS. (2007). Design and evaluation of self-nanoemulsifying drug delivery systems (SNEDDS) for cefpodoxime proxetil. Int J Pharm 329:166–72.
- Diebold Y, Jarrín M, Sáez V, et al. (2007). Ocular drug delivery by liposome-chitosan nanoparticle complexes (LCS-NP). Biomaterials 28:1553–64.
- Elmowafy M, Ibrahim HM, Ahmed MA, et al. (2017). Atorvastatin-loaded nanostructured lipid carriers (NLCs): strategy to overcome oral delivery drawbacks. Drug Deliv 24:932–41.
- Farghaly DA, Aboelwafa AA, Hamza MY, et al. (2018). Microemulsion for topical delivery of fenoprofen calcium: in vitro and in vivo evaluation. J Liposome Res 28:126–36.
- Gönüllü Ü, Üner M, Yener G, et al. (2015). Formulation and characterization of solid lipidnanoparticles, nanostructured lipid carriers and nanoemulsion of lornoxicam for transdermal delivery. Acta Pharmaceutica 65:1–13.
- González-Fernández FM, Bianchera A, Gasco P, et al. (2021). Lipid-based nanocarriers for ophthalmic administration: towards experimental design implementation. Pharmaceutics 13:447.
- Han KY, Chang JH, Lee H, et al. (2016). Proangiogenic interactions of vascular endothelial MMP14 with VEGF receptor 1 in VEGFA-mediated corneal angiogenesis. Invest Ophthalmol Vis Sci 57:3313–22.
- Hsu CC, Chang HM, Lin TC, et al. (2015). Corneal neovascularization and contemporary antiangiogenic therapeutics. J Chin Med Assoc 78:323–30.
- Irani YD, Scotney PD, Klebe S, et al. (2017). An anti-VEGF-B antibody fragment induces regression of pre-existing blood vessels in the rat cornea. Invest Ophthalmol Vis Sci 58:3404–13.
- Jain K, Sood S, Gowthamarajan K. (2015). Optimization of artemether-loaded NLC for intranasal delivery using central composite design. Drug Deliv 22:940–54.
- Jain N, Verma A, Jain N. (2020). Formulation and investigation of pilocarpine hydrochloride niosomal gels for the treatment of glaucoma: intraocular pressure measurement in white albino rabbits. Drug Deliv 27:888–99.
- Kalam MA, Alshamsan A, Aljuffali IA, et al. (2016). Delivery of gatifloxacin using microemulsion as vehicle: formulation, evaluation, transcorneal permeation and aqueous humor drug determination. Drug Deliv 23:896–907.
- Kaur N, Sharma K, Bedi N. (2018). Topical nanostructured lipid carrier based hydrogel of mometasone furoate for the treatment of psoriasis. Pharm Nanotechnol 6:133–43.
- Kelidari HR, Saeedi M, Akbari J, et al. (2017). Development and optimisation of spironolactone nanoparticles for enhanced dissolution rates and stability. AAPS PharmSciTech 18:1469–74.
- Kernt M, Staehler M, Stief C, et al. (2008). Resolution of macular oedema in occult choroidal neovascularization under oral sorafenib treatment. Acta Ophthalmol 86:456–8.
- Kesharwani P, Jain A, Srivastava A, et al. (2020). Systematic development and characterization of curcumin-loaded nanogel for topical application. Drug Dev Ind Pharm 46:1443–57.
- Khan S, Baboota S, Ali J, et al. (2016). Chlorogenic acid stabilized nanostructured lipid carriers (NLC) of atorvastatin: formulation, design and in vivo evaluation. Drug Dev Ind Pharm 42:209–20.
- Khan S, Shaharyar M, Fazil M, et al. (2016). Tacrolimus-loaded nanostructured lipid carriers for oral delivery Optimization of production and characterization. Eur J Pharm Biopharm 108:277–88.
- Khezri K, Saeedi M, Morteza-Semnani K, et al. (2021). A promising and effective platform for delivering hydrophilic depigmenting agents in the treatment of cutaneous hyperpigmentation: kojic acid nanostructured lipid carrier. Artif Cells Nanomed Biotechnol 49:38–47.
- Kovács A, Berkó S, Csányi E, et al. (2017). Development of nanostructured lipid carriers containing salicyclic acid for dermal use based on the quality by design method. Eur J Pharm Sci 99:246–57.
- Kumar R, Crouthamel MC, Rominger DH, et al. (2009). Myelosuppression and kinase selectivity of multikinase angiogenesis inhibitors. Br J Cancer 101:1717–23.
- Kumari S, Dandamudi M, Rani S, et al. (2021). Dexamethasone-loaded nanostructured lipid carriers for the treatment of dry eye disease. Pharmaceutics 13:905.
- Lakhani P, Patil A, Taskar P, et al. (2018). Curcumin-loaded nanostructured lipid carriers for ocular drug delivery: design optimization and characterization. J Drug Deliv Sci Technol 47:159–66.
- Lee P, Wang CC, Adamis AP. (1998). Ocular neovascularization: an epidemiologic review. Surv Ophthalmol 43:245–69.
- Li J, Guo X, Liu Z, et al. (2014). Preparation and evaluation of charged solid lipid nanoparticles of tetrandrine for ocular drug delivery system: pharmacokinetics, cytotoxicity and cellular uptake studies. Drug Dev Ind Pharm 40:980–7.
- Li J, Li Z, Liang Z, et al. (2018). Fabrication of a drug delivery system that enhances antifungal drug corneal penetration. Drug Deliv 25:938–49.
- Li Q, Li Z, Zeng W, et al. (2014). Proniosome-derived niosomes for tacrolimus topical ocular delivery: in vitro cornea permeation, ocular irritation, and in vivo anti-allograft rejection. Eur J Pharm Sci 62:115–23.
- Li Z, Li J, Zhu L, et al. (2016a). Celastrol nanomicelles attenuate cytokine secretion in macrophages and inhibit macrophage-induced corneal neovascularization in rats. Int J Nanomed 11:6135–48.
- Li J, Liu D, Tan G, et al. (2016b). A comparative study on the efficiency of chitosan-N-acetylcysteine, chitosan oligosaccharides or carboxymethyl chitosan surface modified nanostructured lipid carrier for ophthalmic delivery of curcumin. Carbohydr Polym 146:435–44.
- Li H, Pan T, Cui Y, et al. (2016c). Improved oral bioavailability of poorly water-soluble glimepiride by utilizing microemulsion technique. Int J Nanomed 11:3777–88.
- Li Q, Yang X, Zhang P, et al. (2021). Dasatinib loaded nanostructured lipid carriers for effective treatment of corneal neovascularization. Biomater Sci 9:2571–83.
- Lin L, Asghar S, Huang L, et al. (2021). Preparation and evaluation of oral self-microemulsifying drug delivery system of chlorophyll. Drug Dev Ind Pharm 47:857–66.
- Liu D, Li J, Cheng B, et al. (2017). Ex vivo and in vivo evaluation of the effect of coating a coumarin-6-labeled nanostructured lipid carrier with chitosan-n-acetylcysteine on rabbit ocular distribution. Mol Pharm 14:2639–48.
- Liu YC, Lin MT, Ng AHC, et al. (2020). Nanotechnology for the treatment of allergic conjunctival diseases. Pharmaceuticals 13:351.
- Liu J, Wang Q, Omari-Siaw E, et al. (2020). Enhanced oral bioavailability of Bisdemethoxycurcumin-loaded self-microemulsifying drug delivery system: formulation design, in vitro and in vivo evaluation. Int J Pharm 590:119887.
- Liu Y, Wang L, Zhao Y, et al. (2014). Nanostructured lipid carriers versus microemulsions for delivery of the poorly water-soluble drug luteolin. Int J Pharm 476:169–77.
- Luo X, Li S, Xie Y, et al. (2013). Pharmacokinetic studies of a novel multikinase inhibitor for treating cancer by HPLC-UV. J Chromatogr Sci 51:17–20.
- Mabry R, Gilbertson DG, Frank A, et al. (2010). A dual-targeting PDGFRbeta/VEGF-A molecule assembled from stable antibody fragments demonstrates anti-angiogenic activity in vitro and in vivo. MAbs 2:20–34.
- Maria DN, Mishra SR, Wang L, et al. (2017). Water-soluble complex of curcumin with cyclodextrins: enhanced physical properties for ocular drug delivery. Curr Drug Deliv 14:875–86.
- Moiseev RV, Morrison P, Steele F, et al. (2019). Penetration enhancers in ocular drug delivery. Pharmaceutics 11:321.
- Montenegro L, Lai F, Offerta A, et al. (2016). From nanoemulsions to nanostructured lipid carriers: a relevant development in dermal delivery of drugs and cosmetics. J Drug Deliv Sci Technol 32:100–12.
- Negi LM, Jaggi M, Talegaonkar S. (2014). Development of protocol for screening the formulation components and the assessment of common quality problems of nano-structured lipid carriers. Int J Pharm 461:403–10.
- Nicholas MP, Mysore N. (2021). Corneal neovascularization. Exp Eye Res 202:108363.
- Patel N, Nakrani H, Raval M, et al. (2016). Development of loteprednol etabonate-loaded cationic nanoemulsified in-situ ophthalmic gel for sustained delivery and enhanced ocular bioavailability. Drug Deliv 23:3712–23.
- Patel PA, Patil SC, Kalaria DR, et al. (2013). Comparative in vitro and in vivo evaluation of lipid based nanocarriers of Huperzine A. Int J Pharm 446:16–23.
- Pérez-Santonja JJ, Campos-Mollo E, Lledó-Riquelme M, et al. (2010). Inhibition of corneal neovascularization by topical bevacizumab (Anti-VEGF) and Sunitinib (Anti-VEGF and Anti-PDGF) in an animal model. Am J Ophthalmol 150:519–28.
- Robbie SJ, Lundh von Leithner P, Ju M, et al. (2013). Assessing a novel depot delivery strategy for noninvasive administration of VEGF/PDGF RTK inhibitors for ocular neovascular disease. Invest Ophthalmol Vis Sci 54:1490–500.
- Roshandel D, Eslani M, Baradaran-Rafii A, et al. (2018). Current and emerging therapies for corneal neovascularization. Ocul Surf 16:398–414.
- Sánchez-López E, Espina M, Doktorovova S, et al. (2017). Lipid nanoparticles (SLN, NLC): overcoming the anatomical and physiological barriers of the eye –– part II – ocular drug-loaded lipid nanoparticles. Eur J Pharm Biopharm 110:58–69.
- Savić V, Ilić T, Nikolić I, et al. (2019). Tacrolimus-loaded lecithin-based nanostructured lipid carrier and nanoemulsion with propylene glycol monocaprylate as a liquid lipid: formulation characterization and assessment of dermal delivery compared to referent ointment. Int J Pharm 569:118624.
- Selvaraj BR, Sridhar SK, Kesavan BR, et al. (2020). Application of statistical tooling techniques for designing of carvedilol nanolipid transferosomes and its dermatopharmacokinetic and pharmacodynamic studies. PNT 8:452–70.
- Seo JW, Chung SH, Choi JS, et al. (2012). Inhibition of corneal neovascularization in rats by systemic administration of sorafenib. Cornea 31:907–12.
- Seyfoddin A, Shaw J, Al-Kassas R. (2010). Solid lipid nanoparticles for ocular drug delivery. Drug Deliv 17:467–89.
- Shahab M, , Rizwanullah M, Alshehri S, Imam S. (2020). Optimization to development of chitosan decorated polycaprolactone nanoparticles for improved ocular delivery of dorzolamide: in vitro, ex vivo and toxicity assessments. Int J Biol Macromol 163:2392–404.
- Sharif Z, Sharif W. (2019). Corneal neovascularization: updates on pathophysiology, investigations & management. Rom J Ophthalmol 63:15–22.
- Shen J, Deng Y, Jin X, et al. (2010). Thiolated nanostructured lipid carriers as a potential ocular drug delivery system for cyclosporine A: improving in vivo ocular distribution. Int J Pharm 402:248–53.
- Shi S, Peng F, Zheng Q, et al. (2019). Micelle-solubilized axitinib for ocular administration in anti-neovascularization. Int J Pharm 560:19–26.
- Siedlecki J, Wertheimer C, Wolf A, et al. (2017). Combined VEGF and PDGF inhibition for neovascular AMD: anti-angiogenic properties of axitinib on human endothelial cells and pericytes in vitro. Graefes Arch Clin Exp Ophthalmol 255:963–72.
- Thiele S, Liegl RG, König S, et al. (2013). Multikinase inhibitors as a new approach in neovascular age-related macular degeneration (AMD) treatment: in vitro safety Accepted Manuscriptevaluations of axitinib, pazopanib and sorafenib for intraocular use. Klin Monbl Augenheilkd 230:247–54.
- Vieira R, Severino P, Nalone LA, et al. (2020). Sucupira oil-loaded nanostructured lipid carriers (NLC): lipid screening, factorial design, release profile, and cytotoxicity. Molecules 25:685.
- Wang X, Zhang Y, Huang J, et al. (2019). Self-assembled hexagonal liquid crystalline gels as novel ocular formulation with enhanced topical delivery of pilocarpine nitrate. Int J Pharm 562:31–41.
- Wilhelm S, Carter C, Lynch M, et al. (2006). Discovery and development of sorafenib: a multikinase inhibitor for treating cancer. Nat Rev Drug Discov 5:835–44.
- Xiao O, Xie ZL, Lin BW, et al. (2012). Minocycline inhibits alkali burn-induced corneal neovascularization in mice. PLoS One 7:e41858.
- Yildirim H, Aydemir O, Balbaba M, et al. (2020). Comparison of the effect of topical bevacizumab and sorafenib in experimental corneal neovascularization. Cutan Ocul Toxicol 39:223–8.
- Yoon KC, Ahn KY, Lee SE, et al. (2006). Experimental inhibition of corneal neovascularization by photodynamic therapy with verteporfin. Curr Eye Res 31:215–24.
- Yu Y, Xu S, Yu S, et al. (2020). A hybrid genipin-cross-linked hydrogel/nanostructured lipid carrier for ocular drug delivery: cellular, ex vivo, and in vivo evaluation. ACS Biomater Sci Eng 6:1543–52.
- Zafar A, Alruwaili N, Imam S, et al. (2021). Formulation of carteolol chitosomes for ocular delivery: formulation optimization, ex-vivo permeation, and ocular toxicity examination. Cutan Ocul Toxicol 40:38–349.
- Zakkula A, Gabani BB, Jairam RK, et al. (2020). Preparation and optimization of nilotinib self-micro-emulsifying drug delivery systems to enhance oral bioavailability. Drug Dev Ind Pharm 46:498–504.
- Zeng F, Wang D, Tian Y, et al. (2021). Nanoemulsion for improving the oral bioavailability of hesperetin: formulation optimization and absorption mechanism. J Pharm Sci 110:2555–61.
- Zhang SX, Ma JX. (2007). Ocular neovascularization: implication of endogenous angiogenic inhibitors and potential therapy. Prog Retin Eye Res 26:1–37.
- Zhou T, Miao Y, Li Z, et al. (2020). A comparative ocular pharmacokinetics study of preservative-free latanoprost unit-dose eye drops and a benzalkonium chloride-preserved branded product following topical application to rabbits . J Ocul Pharmacol Ther 36:522–8.
- Zhou SY, Xie ZL, Xiao O, et al. (2010). Inhibition of mouse alkali burn induced-corneal neovascularization by recombinant adenovirus encoding human vasohibin-1. Mol Vis 16:1389–98.
- Zhou T, Zhu L, Xia H, et al. (2017). Micelle carriers based on macrogol 15 hydroxystearate for ocular delivery of terbinafine hydrochloride: in vitro characterization and in vivo permeation. Eur J Pharm Sci 109:288–96.
- Zhu W, Yu A, Wang W, et al. (2008). Formulation design of microemulsion for dermal delivery of penciclovir. Int J Pharm 360:184–90.