
 ?Mathematical formulae have been encoded as MathML and are displayed in this HTML version using MathJax in order to improve their display. Uncheck the box to turn MathJax off. This feature requires Javascript. Click on a formula to zoom.
Abstract
Insulin is the peptide hormone used to treat the diabetes patient. The hormone is normally taken by injection. The transdermal drug delivery system (TDDS) is an alternative route. The silk fibroin (SF) hydrogels were fabricated via solution casting as the insulin matrix. The release and release-permeation experiments of the insulin loaded SF hydrogels were carried out using a modified Franz-diffusion cell at 37 °C for 36 h, under the effects of SF concentrations, pH, and electric field. The release-permeation mechanism through the pig skin was from the Case-II transport with the constant release rate. The diffusion coefficient (D) increased with decreasing SF concentration due to a larger mesh size, and with increasing electric field due to the electroreplusive forces between the insulin and the SF hydrogels against the negatively-charged electrode, and the induced SF hydrogel expansion. The rate and amount of insulin release-permeation became relatively lower as it required a longer time to generate aqueous pathways through the pig skin. The present SF hydrogels are demonstrated here deliver insulin with the required constant release rate, and the suitable amount within a prescribed duration.
1. Introduction
In recent decades, diabetes mellitus has become one of the most common noncommunicable diseases in the world. In 2018, the International Diabetes Federation reported that the number of diabetes patients of around 425 millions (Mallawarachchi et al., Citation2019). It is expected to rise to 552 millions by 2030 (Shah et al., Citation2016). Diabetes is a condition in which blood sugar levels are too high (hyperglycemia). Blood glucose levels above 7.0 mmol/L during fasting and 11.1 mmol/L after lunch or dinner are indicative of diabetes (Mansoor et al., Citation2019). Diabetes mellitus can be classified into 2 types; type 1 is the failure of insulin secretion by the pancreas (T1DM): type 2 is the defective response of the body to insulin (T2DM) (Zhang et al., Citation2018). Insulin is a peptide hormone that can be used in the insulin deficiency treatment for both T1DM and T2DM (Shah et al., Citation2016). However, insulin can be degraded or metabolized in the gastrointestinal tract if taken orally. The self-injection is a common route for insulin delivery, but it introduces a pain and an infectious risk near the injection area. Therefore, the transdermal drug delivery (TDDS) is an alternative route for the controllable insulin administration (Tokumoto et al., Citation2006).
TDDS is an attractive drug administration as it can avoid the metabolization and the first-pass effect through a painless administration route. This method can provide a proper and prolonged drug delivery with a steady state drug profile (Alexander et al., Citation2012). The suitable drug characteristics are low molecular weight (500 Da), high lipophilicity, and low therapeutic dose (Murthy, Citation2012). The limitation of TDDS is the stratum corneum (SC) which acts as a barrier to prevent the drug permeation (Alkilani et al., Citation2015). To overcome this limitation, several active methods (ultrasound, iontophoresis, microneedle) are applied in TDDS. Iontophoresis is a popular technique as it uses a low electrical current (0.1–1.0 mA/cm2) without harming the human skin to drive the drug across SC and to enhance the skin permeation resistance (Chen et al., Citation2009). The iontophoresis approach can control the drug release rate, amount and duration with a predetermined electric current (Szunerits & Boukherroub, Citation2018).
Hydrogel is a three-dimensional porous structure with a water swollen polymeric network attained via physical or chemical crosslinks (Huang et al., Citation2019). The interconnected porous structures of hydrogels provide channels for the transportations of water and drugs (Kuang et al., Citation2019). Examples of biobased polymeric hydrogels are gelatin, agarose, sodium alginate, and silk fibroin (Schacht, Citation2004).
Several hydrogels have been utilized as the matrices for the controlled TDDS. Poly(acrylamide/maleic acid) hydrogels were used as the matrix for the controlled release of terbinafine hydrochloride (TER-HCl) (Sen et al., Citation2000). Chitosan-polyvinyl alcohol (CS-PVA) hydrogels were used as the matrix for the controlled release of alprazolam (Maji et al., Citation2013). Pectin hydrogels were used as the matrix for the controlled release of asiatic acid (AA) (Mavondo & Tagumirwa, Citation2016). Gelatin methacryloyl (GelMA) hydrogels were used as the matrix for the controlled release of 5-fluorouracil (Oktay & Alemdar, Citation2018). Polyvinyl alcohol and polyvinyl pyrrolidone (PVA-PVP) blended hydrogels were used as the matrix for the controlled release of donepezil hydrochloride (DH) (Bashyal et al., Citation2020).
Silk Fibroin (SF) is a protein polymer which can be extracted from the cocoons of silkworms (Bombyx mori) consisting of fibroin and sericin (Kapoor & Kundu, Citation2015). SF is of excellent biocompatibility, superior mechanical property, very useful in biomedical material functions (tissue and scaffold engineering, drug carrier). SF can be fabricated into various forms such as film, nanofiber, sponge, and hydrogel (Kim & Park, Citation2016). SF hydrogels can be formed by either a physical or chemical crosslink. The physical crosslink is preferred in TDDS because of the concern on human skin toxicity through toxic crosslinkers (Lim, Citation2015). The physical crosslink of SF occurs from the transformation from the random coil (silk I) to the β-sheet (silk II) (Wu et al., Citation2019). SF can form a gel by itself but it requires about 30 days for a complete gelation (Lim, Citation2015). Therefore, the external stimuli have been applied to accelerate the physical crosslinking such as ultrasonication, temperature, and electric field (Wu et al., Citation2019).
The motivation of the work was the initiative to employ SF and insulin as the matrix and model drug, respectively. The tasks of this work were: to investigate the insulin release behaviors from SF hydrogels under the effects of SF concentrations, pH values, and electric field; to investigate the insulin release-permeation behaviors from the SF hydrogels under the effect of electric field; to compare the insulin release and release-permeation behaviors from the SF hydrogels under the effect of electric field with other animal skins. The unique feature of the present hydrophilic TDDS system under iontophoresis is the controllable constant release rate, required dosage amount and duration suitable for diabetes patients requiring the insulin basal release.
2. Materials and methods
2.1. Materials
Silk cocoon (Bombyx Mori; 99.0%, grade B, diameters between 1.8 and 2.0 cm, Chul Thai Silk Co., Ltd) was used as the matrix starting material. Sodium carbonate (Na2CO3; ≥ 99.8%, ACS grade, Riedel-de Haen) was used to extract sericin from SF. Calcium chloride (CaCl2; AR grade Ajax Finechem), ethanol (C2H5OH; AR grade, Burdick & Jackson), and de-ionized water were used in dissolving the degummed silk cocoon. Snakeskin dialysis tubing (Thermo Scientific, MWCO 3500) was used in the dialysis process. Insulin human (recombinant, expressed in yeast, Sigma Aldrich) was used as the model drug. Sodium hydrogen carbonate (NaHCO3; ACS grade, Merck) was used to dissolve insulin. Sodium phosphate monobasic dihydrate (NaH2PO4·2H2O; 99.0%, Sigma Aldrich) and sodium phosphate dibasic dihydrate (Na2H2PO4·2H2O; 99.0%, Sigma Aldrich) were used in the preparation of the phosphate buffer solutions (PBS, pH of 5.5 and 7.4).
2.2. Preparation of silk (SF) solution
To remove sericin, 2 g silk cocoon was boiled in a 0.5 g Na2CO3 solution for 30 min and then the solution was rinsed with distilled water (Hu et al., Citation2012). The process was repeated three times. After that, the degummed silk was dried at room temperature (27 ± 1 ° C) to obtain a silk fibroin (SF) fiber. The 20 g degummed silk fiber was slowly added (1 g at a time) and it was dissolved in a ternary solvent of the CaCl2: H2O: C2H5OH 1: 8: 2 mole ratio at 80 ° C for 4 hours (Kim & Park, Citation2016). The solution was dialyzed in distilled water with a snakeskin dialysis tubing for 3 days. The solution was centrifuged at 8000 rpm to remove impurities (Kuang et al., Citation2018) to obtain the SF solution. The degumming process (removal of sericin) was confirmed by the FTIR technique.
2.3. Preparation of insulin-loaded SF hydrogels
Insulin powder (0.0011 g) was dissolved in 125 mM of NaHCO3 (Lougheed et al., Citation1981) under stirring for 30 minutes. The SF solutions were prepared at various concentrations of 0.5, 1.0 and 2.0%w/v (Degummed SF fiber: ternary solvent at the CaCl2: H2O: C2H5OH 1: 8: 2 mole ratio at 80 ° C for 4 hours), respectively. After that, the insulin solution was added into the SF solution under stirring at 60 ° C for 1 hour (Zhang et al., Citation2008). The solution was casted onto a petri dish (10 cm) and dried at 70 ° C for 7 hours. The insulin loaded SF films were obtained with a thickness 0.1 ± 0.02 mm and a radius of 1 cm.
2.4. Preparation of phosphate buffer saline (PBS buffer)
Phosphate buffer saline solutions (0.1 M PBS buffer, pH 7.4, and 0.067 M PBS buffer, pH 5.5) were prepared by dissolving 2.34 g NaH2PO4·2H2O and 15.13 g Na2H2PO4·2H2O into 1000 ml of distilled water for the pH of 7.4, and by dissolving 9.12 g NaH2PO4·2H2O and 23.99 g Na2H2PO4·2H2O into 1000 ml of distilled water for the pH of 5.5. The PBS solutions were stirred continuously at room temperature until homogeneous solutions were obtained. The PBS buffers were used as the mediums in the receptor part of the modified-Franz diffusion cell.
2.5. Characterization
The functional groups and the interactions of the SF hydrogels and insulin loaded SF hydrogels were identified by a Fourier transformed infrared spectrometer (Nicolet, iS 5, ID 7) in the absorbance mode, in the wavenumber range of 650–4000 cm−1, 64 scans, and with a resolution of 4 cm−1.
The thermal behaviors of the SF hydrogels and insulin loaded SF hydrogels were determined by a simultaneous thermal analyzer (STA; Netzsch, STA 449F3), in the temperature range from 30 to 780 °C with a heating rate 10°Cmin−1 under a nitrogen flow. Each sample was weighted in between 4 to 8 mg into a platinum pan.
The morphology of SF hydrogel was investigated by a field emission scanning electron microscope (Hitachi, S-4800), at the 2 kV voltage and 10 µA current. Each SF hydrogel was soaked in the PBS buffer (pH 7.4) for 48 hours. After that, it was rapidly frozen with liquid nitrogen (−40 °C) and lyophilized in a freeze-drier (Biobase, BK-FD 10) at −40 °C for 20 hours. Each sample was placed on a holder with a carbon adhesive tape and coated with a platinum layer.
The mesh sizes and total pore volumes of the SF hydrogels with various concentrations were measured by a surface area analyzer (BET; Quantrachome, Autosorb IQC). 0.1–0.2 g of samples were outgassed for 30 h at 50° C before the absorption measurement under helium atmosphere. The mesh sizes and total pore volumes were determined under the nitrogen atmosphere.
The cytotoxicity of SF hydrogels was determined via the MTT cytotoxicity assay (ISO 10993-5) using human skin fibroblast cells. A cell suspension of 1 × 10⁵ cells/ml CRL-2522 in a DMEM completed medium was seeded into the 96-well plate. It was incubated at 37 ± 1 °C, 5 ± 0.1% CO2 and 95 ± 5 relative humidity for 24 ± 2 h to obtain confluent monolayers of cells prior to testing.
The SF hydrogel (a circular shape, diameter of 2 cm, thickness of 0.1 mm) was immersed in the 0.1 M PBS buffer (15 ml, pH 7.4) for 48 h at 27 °C. The degree of swelling (%) and the weight loss (%) of the SF hydrogels were calculated from EquationEqs. (1)(1)
(1) and Equation(2)
(2)
(2) (Darge et al., Citation2019; Patarroyo et al., Citation2020):
(1)
(1)
and
(2)
(2)
which Md is the weight of the swollen sample after drying at 27 °C (g), Ms is the weight of a swollen sample (g), and Mi is the initial weight of the sample (g).
To determine the molecular weight between crosslinks (M–c), the mesh size (ξ), and the crosslinking density (ρ), each sample was weighed in air and heptane. The sample was immersed in the PBS buffer (pH 7.4) under the electric field of E = 3 V, applied on the sample with the cathode electrode attached on the sample and connected to a power supply (Tektronix, PS 280). Next, the sample was allowed to swell to equilibrium for 48 h at 27 °C. The sample was weighed in air and heptane. After that, the sample was dried overnight at 27 °C and weighed in air and heptane again. The M–c was converted from the swelling data by using EquationEq. (3)(3)
(3) (Peppas & Merril, Citation1977):
(3)
(3)
which
is the molecular weight between crosslinking (g/mol),
is the number-average molecular weight of the polymer before crosslinking (79000 g/mol (Radu et al., Citation2019)),
is the specific volume of SF (0.7037 cm3/g (Whittaker et al., Citation2014)),
is the molar volume of water (18.1 cm3/mole), χ is the Flory interaction parameter of SF and water (0.95 (Whittaker et al., Citation2014)),
is the polymer volume fraction in gel in the relaxed state, and
is the polymer volume fraction in gel in the swollen state.
The hydrogel mesh size, ξ, was calculated by using EquationEq. (4)(4)
(4) (Peppas & Wright, Citation1996):
(4)
(4)
which Cn is the Flory characteristic ratio for SF (1.8 (Whittaker et al., Citation2014)), is the carbon-carbon bond length of the monomer unit (1.54 Å (Peppas & Wright, Citation1996)), and
r is the molecular weight of the repeating units (400 g/mol).
The crosslinking density () of the hydrogel was calculated by using EquationEq. (5)
(5)
(5) (Peppas & Wright, Citation1996):
(5)
(5)
In vitro Drug Release Study
The modified Franz diffusion cells were used to investigate the insulin release at 37 ± 0.5 °C. The modified Franz diffusion cell was composed of two parts; the receptor and donor parts. The receptor part contained the PBS buffer (pH of 5.5 or 7.4) which was stirred with a magnetic stirrer during the release experiment period (36 h). A donor part consisted of the insulin loaded SF film. The sample was placed over a nylon net on top of the receptor part. The electric field of various voltages (0, 3, 6 V) was applied to the SF film matrices by the cathode electrode connected to a power supply (Tektronix, PS 280) attached on top of the sample. The resultant currents and intensities were between 0.06 and 0.63 μA and 1.91 × 1 0 −5–2.00 × 1 0 −4 mA/cm2, respectively. The insulin diffused from the SF film into the PBS buffer (pH of 5.5 or 7.4). A sample (0.1 ml) was taken out from the receptor part at various times and replaced with an equal volume of the fresh PBS buffer (pH of 5.5 or 7.4).
The characteristic peaks and the amounts of insulin released and permeated at various times were determined by a UV-Visible spectrometer (TECAN, Infinite M200). The insulin absorbance peak was located at 274 nm (Zhang et al., Citation2008). The measured absorbance intensities were converted to the insulin concentrations by the calibration curves (pH 5.5 and 7.4).
The initial amounts of insulin in the insulin loaded SF hydrogels were determined by dissolving each sample (diameter 2 cm, thickness 0.1 mm) in 125 mM NaHCO3 (0.042 g NaHCO3 in 4 ml H2O). After that, 0.5 ml of the solution was added into 8 ml of the PBS buffer (pH 7.4). The amounts of insulin in the solution were determined by the UV-Visible spectrometer at the 274 nm (Zhang et al., Citation2008).
In vitro Drug Release-Permeation Study
The drug release-permeation of the insulin loaded SF hydrogel was studied by using the belly pig skin as the membrane on the donor part. The belly pig skin was used instead of the nylon net. The hairs on the pig skin surface and subcutaneous fat were first removed. The belly pig skin was cut into a circular shape (diameter of 2 cm and thickness of 0.2 cm). After that, the belly pig skins were immersed in the PBS buffer (pH 7.4) overnight and kept in the refrigerator at 7 °C, prior to use. The resultant currents and intensities were between 1.20 − 2.00 μA and 3.82 × 1 0 −4–6.36 × 1 0 −4 mA/cm2, respectively.
Release characteristic of insulin from insulin loaded SF hydrogel
The power law model was used to study the drug release mechanism from the SF films. The accumulative drug release amounts vs. time were fitted with the Korsmeyer and Peppas model (Korsmeyer et al., Citation1983) as in EquationEq. (6)(6)
(6) :
(6)
(6)
where
is the fraction of accumulative drug released at time t,
is the kinetic constant (with the unit of T-n), and –n is the apparent diffusional scaling exponent indicative of the drug release mechanism. From EquationEq. (6)
(6)
(6) , the apparent diffusional scaling exponent (n) and kinetic constant (k) were calculated from the log-log plot of
versus time.
When the diffusional scaling exponent (n) is equal to 0.5, the Higuchi model can be used to determine the drug release rate as shown in EquationEq. (7)(7)
(7) (Higuchi, Citation1961):
(7)
(7)
where
is the Higuchi constant (with the unit of T-n). From EquationEq. (7)
(7)
(7) , the Higuchi constant
) was calculated from the slope of
versus the square root of time (h) on a log-log plot.
The diffusion coefficient (D) was calculated from the slope of amount of drug released versus the square root of time according to Higuchi’s equation of EquationEq. (8)(8)
(8) (Higuchi, Citation1961):
(8)
(8)
where
is the amount of drug released (g), A is the diffusion coefficient area (cm2),
is the initial drug concentration in the matrix (g/cm3), and D is the diffusion coefficient of the drug (cm2/s).
3. Results and discussion
3.1. Chemical structure of silk fibroin and characterization
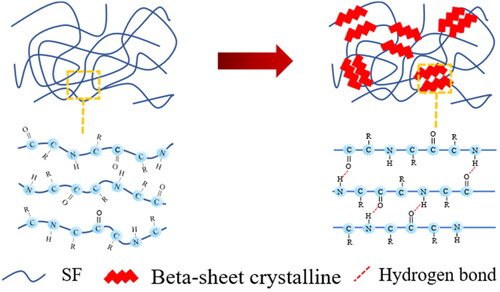
The SF hydrogel is formed via physical crosslinking under increasing temperature in which the SF chains transform from the random coil (silk I) to the beta-sheet structure (silk II) as shown in . The SF chains possess the hydrophilic and hydrophobic chain segments arranged alternately (Johari et al., Citation2020). At a high temperature (70° C), the SF chains transform to the beta-sheet conformation from the hydrogen bonds between adjacent chains or intermolecular hydrogen bonding resulting in silk II (Wu et al., Citation2019).
Figure 1. Schematic transformation of SF from random coil to beta-sheet crystalline.
The cytotoxicity of SF hydrogel matrices was determined via the MTT cytotoxicity assay using human skin fibroblast cells. The %viability of 0.5%w/v and 2.0%w/v SF matrices were 79% and 79%, respectively. If %viability is less than 70% of the blank, it has a cytotoxic potential, so the SF hydrogel matrices were not toxic to the human skin (Magos et al., Citation2020).
The interactions of the beta-sheet SF and insulin loaded SF were determined by the FTIR spectroscopy as shown in . The FTIR spectrum of the silk cocoon, in a), shows the sericin peaks at 1525 cm−1 and 1155 cm−1 (Correa et al., Citation2020). The FTIR spectrum of the degummed SF, in b), shows the main characteristic peaks of: the amide I (C = O stretching) at 1650 cm−1, the amide II (N-H bending) at 1540 cm−1, and the amide III (C-N stretching) at 1259 cm−1, respectively. These peaks represent the random coil of the degummed SF (Zhang et al., Citation2012). The FTIR spectrum of the degummed SF confirms the successful degumming process as it does not show the sericin peaks at 1525 cm−1 and 1155 cm−1 (Correa et al., Citation2020). The FTIR spectrum of the transformed SF (SF hydrogel), in c), illustrates the main characteristic peaks: the amide I (C = O stretching) at 1635 cm−1, the amide II (N-H bending) at 1515 cm−1, and the amide III (C-N stretching) at 1231 cm−1, respectively. These peaks represent the characteristic peaks of the beta-sheets in the transformed SF due to the distinct hydrogen bond and rearrangement of SF (Narita et al., Citation2021). From the FTIR spectra, the results confirm that the random coil transformed to the beta-sheet structure as shown in (Park et al., Citation2014). In d), the FTIR spectrum of insulin demonstrates the amide I at 1644 cm−1, the amide II at 1534 cm−1, and the amide III at 1238 cm−1, respectively (Dwivedi et al., Citation2010). In e), the FTIR spectrum of insulin loaded SF shows the characteristic peaks both the transformed SF and insulin. There appear the shiftings of the SF amide I from 1635 to 1637 cm−1, the SF amide II from 1515 to 1512 cm−1, and the SF amide III from 1231 to 1234 cm−1. The shiftings represent the hydrogen bonding between insulin and the SF matrix. The findings suggest that insulin was successfully incorporated into SF.
Figure 2. (A) FTIR spectra of: (a) Silk Cocoon; (b) Degummed SF; (c) Transformed SF (SF hydrogel); (d) Insulin; and (e) Insulin loaded SF. (B) TGA thermograms of: (a) Degummed SF; (b) Transformed SF (SF hydrogel); (c) Insulin; and (d) Insulin loaded SF.
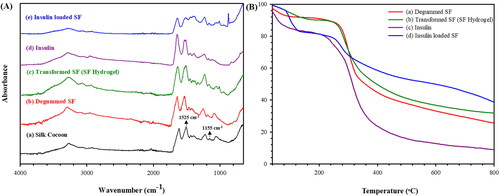
The thermal stability of the degummed SF, transformed SF (SF hydrogel), insulin, insulin loaded SF was investigated by the STA technique as shown in . The TGA thermogram of the degummed SF in a) shows 2 decomposition stages; the evaporation of water around 40–160° C, and the decomposition of SF chain at 160–800 ° C. The Td,onset of the degummed SF is 267 ° C (Quicenoa et al., Citation2017). The TGA thermogram of the transformed SF (SF hydrogel) in b) demonstrates 2 decomposition stages similar to the degummed SF but the Td,onset of the transformed SF is 264 ° C (Varkey et al., Citation2015). The T d,onset shifting from 267 to 264° C suggests that the random coil of the degummed SF transforming to the beta-sheet as shown in (Narita et al., Citation2021). The insulin thermogram as shown in c) exhibits 2 decomposition stages at 40–140 ° C and 140–800 ° C due to the decomposition of water and insulin, respectively. The Td,onset of insulin is 272 ° C (Chwedoruk et al., Citation2014). The insulin loaded SF thermogram, d), exhibits 2 decomposition stages same as insulin but the insulin Td,onset is 252 ° C. The insulin T d,onset shifting from 272° C to 252° C suggests that insulin was successfully incorporated in the transformed SF via hydrogen bonding. Thus, the TGA and FTIR data are consistent with each other.
The characteristics of SF hydrogels namely the degree of swelling, the weight loss, the molecular weight between crosslink (Mc), the mesh size (ξ), and the crosslinking density were investigated under the effects of SF concentrations and electric fields under cathode electrode; the data are tabulated in and . Under the effect of SF concentrations, the mesh sizes of the transformed SF 0.5%w/v, 1.0%w/v, and 2.0%w/v are 264 ± 2.8 Å, 95.9 ± 6.6 Å, and 22.5 ± 4.3 Å, respectively. At a higher SF concentration, the degree of swelling and the weight lose decrease due to a higher entanglement resulting in a smaller mesh size and a lower free volume limiting the water absorption and swelling ability (Mongkolkitikul et al., Citation2017). Under the electric field, the mesh sizes of SF 0.5%w/v at 0 V and 3 V are 264 ± 2.8 Å and 332.4 ± 17.2 Å, respectively. At a higher electric field, the degree of swelling and the weight loss increase due to the electro-repulsive force between the negatively charged cathode electrode and the negative charge the SF hydrogel structure (isoelectric point (pI) of SF 4.53) resulting in the silk hydrogel matrix expansion (Lammel et al., Citation2010; Zheng et al., Citation2020). These results are further confirmed by the SEM images of the SF hydrogel after swelling.
Figure 3. The cross-section morphology of SF hydrogels after swelling without electric fields: (a) 0.5% w/v; (b) 1.0% w/v; (c) 2.0% w/v; (d) the morphology of SF hydrogels at 0.5% w/v under electric field of 3 V.
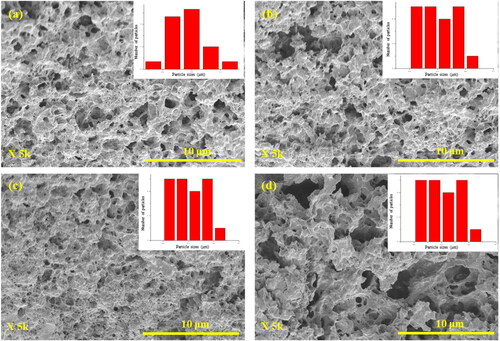
Table 1. The weight loss, the degree of swelling, the molecular weight between crosslinks, the mesh size, and the crosslinking density of SF hydrogels of various concentrations with and without electric fields.
The cross-section morphologies of the SF hydrogels after swelling with and without electric field are shown in . All samples show some porous structures. Under the effect of SF concentrations (), the as measured pore sizes of SF 0.5%w/v, 1.0%w/v, and 2.0%w/v are 0.87 ± 0.19 μm, 0.50 ± 0.16 μm, and 0.33 ± 0.05 μm, respectively. The pore size decreases with increasing SF concentrations. Under the effect of electric field (), the pore sizes of SF 0.5%w/v at 0 V and 3 V are 0.87 ± 0.19 μm and 1.10 ± 0.17 μm. Under electric field, the pore size increases due to the electro-repulsive force between the negatively charged cathode electrode and the negative charge the SF hydrogel structure (pI of SF 4.53) (Lammel et al., Citation2010; Zheng et al., Citation2020). The results are consistent with the mesh size results as shown in .
From the BET data, the mesh sizes of 0.5%w/v SF, 1.0%w/vSF, and 2.0%w/vSF are 15.58 nm, 9.77, and 9.41 nm, respectively. The pore volumes of 0.5%w/v SF, 1.0%w/vSF, and 2.0%w/vSF are 1.55 × 1 0 −1 cm3/g, 5.47 × 1 0 −2 cm3/g, 5.73 × 1 0 −2 cm3/g, respectively. At a higher SF concentration, the mesh size and pore volume decrease because of a higher entanglement leading to a smaller mesh size and a lower free volume (Mongkolkitikul et al., Citation2017). The results show that the mesh sizes and the pore volumes are consistent. The mesh sizes of BET data, and calculation shown in are consistent.
3.2. Release behavior
3.2.1. Release kinetics of insulin from SF hydrogels
For the sample area of 3.14 cm2 (diameter 2 cm, thickness 0.1 ± 0.01 mm), the actual amount of insulin loaded in the 0.5%w/vSF, 1.0%w/vSF, and 2.0%w/vSF matrices were 1.06 ± 0.03 mg, 1.09 ± 0.02 mg, and 1.05 ± 0.11 mg, respectively.
The apparent diffusional scaling exponents (n) from EquationEq. (6)(6)
(6) were determined from the slopes of the log-log plot of
versus time under the effect of SF concentrations, pHs, and the electric field, as shown in , respectively. The data are tabulated in . The n value can classified into 4 modes of release mechanisms: (i) n ≤ 0.5, the Fickian diffusion, the drug release is controlled by the concentration gradient; (ii) 0.5 < n < 1, the anomalous transport or non-Fickian diffusion, the drug release is due to the concentration gradient and swelling; (iii) n ∼ 1, the Case-II transport and zero-order release (time-independence), the drug release is controlled by the polymer swelling; and (iv) n > 1, the Super Case II transport, the drug release is controlled by the matrix erosion (Langer & Peppas, Citation1981; Korsmeyer et al., Citation1983).
Figure 4. Amounts of Insulin released from Insulin loaded silk fibroin hydrogels under the effects of: (A) SF concentrations; (B) pHs with the 0.5%w/vSF; (C) and electric fields with the 0.5%w/vSF. In (a), (c) and (e) are the amounts versus time in the log-log plots; in (b), (d) and (f) are the amounts versus time1/2.
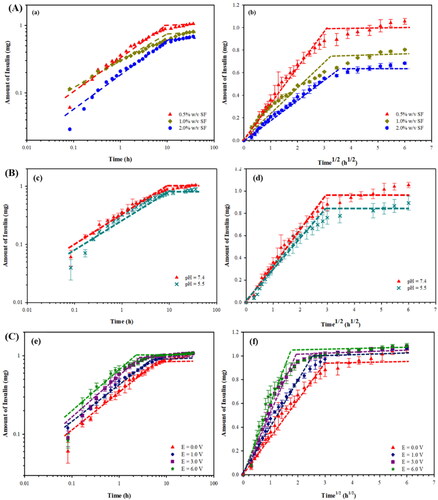
Table 2. Kinetic factors and diffusion coefficients of Insulin released from the SF matrix, at different pH and electric voltages, with the matrix thickness of 0.1 ± 0.07 mm and area of 3.14 cm2.
For the effect of SF concentrations at the pH of 7.4, the n values of 0.5%w/vSF, 1.0%w/vSF, and 2.0%w/v SF are 1.0, 0.32, and 0.47, respectively. At the high SF concentrations, the n values are below 0.5 and they can be classified to the Fickian diffusion as driven by the concentration gradient. For the 0.5%w/vSF, the n value of ∼1.0 is classified to the Case-II transport and zero-order release because of the polymer swelling. The polymer swelling occurs from the loose entanglements at the low SF concentration.
For the effect of pH, the n values of 0.5%w/vSF at the pH values of 7.4 and 5.5 are 1.0, 0.96, respectively. At the pH of 5.5, the n value is less than 1, the release can also be classified as the anomalous transport or non-Fickian diffusion as related to the concentration gradient and polymer swelling.
For the effect of electric field, the n values of 0.5%w/vSF at 0, 1, 3, and 6 V are of the same value namely ∼ 1.0. This condition is then classified as the Case-II transport and zero-order release due the polymer swelling.
The significance of the n value equal to or close to 1 demonstrated here is that the insulin release rate can be controlled to be constant with time, a favorable condition for the transdermal drug delivery. The resultant n value equal to one may stem from the declining concentration gradient with time as compensated by the polymer swelling or the silk expansion effect.
3.2.2. Effect of SF concentrations
The amounts of insulin released from insulin loaded SF hydrogels at various SF concentrations versus time and square root of time are shown in a) and A(b), respectively. For the 0.5%w/vSF, 1.0%w/vSF, and 2.0%w/vSF matrices, the amounts of insulin released are 95.9%, 73.1%, and 62.2%, respectively. The diffusion coefficient of the insulin from insulin loaded SF hydrogels decreases from 4.99 × 1 0 −10 cm2/s to 2.76 × 1 0 −10 cm2/s as shown in . The time to equilibrium increases from 9 h to 14 h. At the high SF concentrations, they possess the lower mesh sizes and higher crosslinking densities resulting in longer times to equilibrium and the lower insulin diffusion coefficients (Li & Mooney, Citation2016).
3.2.3. Effect of pH
The amounts of insulin released from the insulin loaded SF hydrogels at various pH versus time and square root of time are shown in c) and B(d), respectively. For the 0.5%w/vSF at the pHs of 7.4 and the pH of 5.5, the amount of insulin released decreases from 95.9% to 81.2%. The diffusion coefficients of the insulin at the pHs of 7.4 and pH of 5.5 are 4.99 × 1 0 −10 cm2/s, and 4.26 × 1 0 −10 cm2/s as shown in , respectively. The times to equilibrium are nearly equal namely 9 h. At the pH of 5.5, the amount of insulin released is lower due the lower electro-repulsive force between the lower amount of negatively charged insulin molecules (pI of insulin is 5.4) (Nadendla & Friedman, Citation2017; Zhang et al., Citation2019) and the lower amount negatively charged SF hydrogel structures (pI of SF is 4.53) (Ye et al., Citation2006; Lammel et al., Citation2010; Zheng et al., Citation2020; Tari et al., Citation2021). The lower pH condition possibly induces the insulin to become self-aggregated as well as the insulin absorption onto the SF structure (Lougheed et al., Citation1980; Manno et al., Citation2006).
3.2.4. Effect of electric field
The amounts of insulin released from insulin loaded SF hydrogels at various voltages versus time and square root of time are shown in e) and C(f), respectively. Under electric fields from 0 V to 6 V, the amount of insulin released increases from 95.9% to 98.9% for the 0.5% w/v SF matrix. The diffusion coefficient of the insulin increases from 4.99 × 1 0 −10 cm2/s to 5.93 × 1 0 −10 cm2/s as shown in . The time to equilibrium decreases from 9 h to 3 h. Under electric field, it provides 2 main mechanisms: 1) the electro-repulsive force between the negative charge of insulin (pI of insulin 5.4) (Nadendla & Friedman, Citation2017; Zhang et al., Citation2019) and the negatively charged electrode (Paradee et al., Citation2021); and 2) the electro-repulsive force between negative charge of SF hydrogels and the negatively charged electrode inducing matrix expansion known as the ‘silk-expansion effect’ (Mongkolkitikul et al., Citation2017).
3.3. Release-permeation behavior
3.3.1. Release-permeation kinetics of insulin from SF hydrogels
The apparent diffusional scaling exponent (n) values from EquationEq. (6)(6)
(6) were calculated from the slopes between the log-log plots of
versus time under the effect of electric field, as shown in , respectively. The data are tabulated in . the n values of 0.5%w/vSF at 0, 3, and 6 V are of the same value namely ∼ 1.0, indicating the constant release rate. The mechanism can be classified as the Case-II transport and zero-order release due to the polymer swelling.
Figure 5. Amounts of Insulin released and permeated from Insulin loaded silk fibroin hydrogels (0.5% w/v SF) at various electric fields: (a) versus time in a log-log plot; (b) versus time1/2.
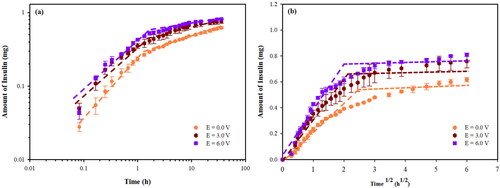
Table 3. Kinetic factors and diffusion coefficients of Insulin released and permeated from the SF matrix, at different electric voltages, with the pH of 7.4, matrix thickness of 0.1 ± 0.07 mm and area of 3.14 cm2.
3.3.2. Effect of electric field
The 0.5%w/v SF was used as the matrix for the release-permeation experiment at various electric fields. The amounts of insulin release-permeation from the insulin loaded SF hydrogels at various voltages versus time and square root of time are shown in , respectively. At 0 V, 3 V, and 6 V, the amounts of insulin release-permeation are 56.1%, 69.0%, and 73.6%, respectively. The diffusion coefficient of the insulin increases from 1.90 × 1 0 −10 cm2/s to 2.78 × 1 0 −10 cm2/s as shown in . The time to equilibrium decreases from 8 h to 5 h. The amounts of insulin release-permeation are relatively low when compared to the release experiments under the same conditions. This was due to a longer time required to generate aqueous pathways or pores in the fluid lipid bilayer membrane during the ‘the pore formation period’ (Ruangmak et al., Citation2021). At a higher electric field, the amount of insulin released-permeation increases due to the ‘electro-repulsive force’ between the anionic drug (pI of insulin 5.4) (Nadendla & Friedman, Citation2017; Zhang et al., Citation2019) and the negatively charge electrode (Paradee et al., Citation2021), and the ‘silk-expansion effect’ (Mongkolkitikul et al., Citation2017).
For other insulin release works, Srinivasan et al. (1987) studied the insulin release via the transdermal iontophoretic drug delivery. At 0.125, 0.250, and 0.500 V, the permeability coefficients through the hairless mouse skin were (5.3 ± 1.7) × 1 0 −8, (2.8 ± 0.3) × 1 0 −7, (2.0 ± 1.7) × 1 0 −7 cm/s, respectively (Srinivasan et al., Citation1987). Pillai et al. (Citation2003) studied the effects of pH and electrode on rat skin for controlled insulin release. At the pH of 7.4, the cumulative amount permeated after 48 h without electrode and under the cathode electrode were 7.54 μg and 56.30 μg, respectively. The fluxes without electrode and under cathode electrode were 0.86 μg/cm2/h and 1.84 μg/cm2/h, respectively (Pillai et al., Citation2003). Pillai et al. (Citation2004) studied the transdermal iontophoresis of insulin by using the female rat skin as the matrix. The fluxes with and without iontophoresis technique (current strength of 0.5 mA/cm2 for 6 h) were 3.74 μg/cm2/h and 1.57 μg/cm2/h, respectively. The amount of permeated insulin increased from 40.53 to 94.50 μg (Pillai & Panchagnula, Citation2004). Yang et al. (Citation2020) studied insulin released by using an iontophoresis-microneedle array patch. The cumulative permeations of insulin with and without electric field (1 mA) for 5 h were 4.85 ± 0.57 and 3.10 ± 0.02 μg, respectively (Yang et al., Citation2020).
The normal dosage for an average diabetes mellitus patient (98.9 ± 1.5 kg (Chaudhry et al., Citation2006)) is 54.4 units or 1.89 mg (1 unit of insulin is 0.0347 mg (Knopp et al., Citation2019)) during a period of 24 hr (Chowdhury et al., Citation2017). In the release experiment, the operating windows are 0.68–1.09 mg during 3–14 hrs from the 0.5% w/v SF, 1.0%w/v SF, and 2.0%w/v SF hydrogels and at the electric fields between 0 and 6 volts. In the release-permeation, the operating windows are 0.62- 0.81 mg during 5–8 hrs for the 0.5% w/v SF at various electric fields (0–6 V). Thus, the suitable SF matrix recommended is the 0.5%w/v SF matrix at the operating electric field of 6 V applied consecutively three times during the period of 24 hrs. This can be referred to the basal insulin secretion, the constant ‘flat-line’ secretion of insulin at a lower rate, which is continuously released at low levels (Niswender, Citation2011).
4. Conclusions
The insulin loaded SF hydrogels were fabricated via solution casting at various SF concentrations for the controllable insulin release. The release and release-permeation behaviors and the diffusion coefficient were investigated under the effects of SF concentrations and electric fields. The % swelling, the weight loss, and the mesh size increased with decreasing SF concentrations due to the lower chain entanglement. The release mechanism of insulin from the SF hydrogels was the Fickian diffusion, the anomalous transport or non-Fickian diffusion, and the Case-II transport or zero-order release depending on SF concentrations and pH values. Under the effect of SF concentrations, the diffusion coefficient increased with a lower SF concentration due to a lower chain entanglement leading to a larger mesh size. Under the effect of pH, the diffusion coefficient decreased with decreasing pH possibly because of the induced insulin self-aggregation and the insulin absorption on to the SF structure. Under the effect of electric field, the diffusion coefficient increased with increasing electric field due to the electroreplusive force and the silk expansion.
For the release-permeation experiments of the insulin loaded SF hydrogels through the pig skin, the release-permeation mechanism was the Case-II transport or zero-order release, or the constant release rate. The amount of insulin release-permeation was relatively low when compared to the release experiment under the same conditions, due to the longer time required to generate aqueous pathways. Under electric field, the diffusion coefficient increased with increasing electric field due to electroreplusive force and the SF matrix expansion. Therefore, the present results suggest that the matrix SF concentration and electric field can be used individually or in combination to control the rate, amount, and duration in the transdermal iontophoresis insulin delivery.
Disclosure statement
No potential conflict of interest was reported by the authors.
Data availability statement
The data presented in this study are available on request from the corresponding author. The data are not publicly available due to the author’s readiness to provide it on request.
Additional information
Funding
References
- Alexander A, Dwivedi S, Giri TK, et al. (2012). Approaches for breaking the barriers of drug permeation through transdermal drug delivery. J Control Release 164:26–40.
- Alkilani AZ, McCrudden MTC, Donnelly RF. (2015). Transdermal drug delivery: innovative pharmaceutical developments based on disruption of the barrier properties of the stratum corneum. Pharmaceutics 7:438–70.
- Bashyal S, Shin CY, Hyun SM, et al. (2020). Preparation, characterization, and in vivo pharmacokinetic evaluation of polyvinyl alcohol and polyvinyl pyrrolidone blended hydrogels for transdermal delivery of donepezil HCl. Pharmaceutics 12:270.
- Chaudhry ZW, Gannon MC, Nuttall FQ. (2006). Stability of body weight in type 2 diabetes. Diabete Care 29:493–7.
- Chen H, Zhu H, Zheng J, et al. (2009). Iontophoresis-driven penetration of nanovesicles through microneedle-induced skin microchannels for enhancing transdermal delivery of insulin. J Control Release 139:63–72.
- Chowdhury AM, Khan RI, NirzhorJabin SSR, et al. (2017). A novel approach in adjustment of total daily insulin dosage for type 2 diabetes patients using a fuzzy logic based system. J Innov Pharm Biol Sci 4:65–72.
- Chwedoruk W, Malka I, Bozycki L, et al. (2014). On the heat stability of amyloid-based biological activity: insights from thermal degradation of insulin fibrils. PLoS ONE 9:e86320.
- Correa EE, Lopera DOG, Restrepo SG, et al. (2020). Effective sericin fibroin separation from Bombyx mori silkworms fibers and low cost salt removal from fibroin solution. Rev Fac Ing. Univ Antioquia 94:97–101.
- Darge HF, Andrgie AT, Hanurry EY, et al. (2019). Localized controlled release of bevacizumab and doxorubicin by thermosensitive hydrogel for normalization of tumor vasculature and to enhance the efficacy of chemotherapy. Int J Pharm 572:118799.
- Dwivedi N, Arunagirinathan MA, Sharma S, Bellare J. (2010). Silica-coated liposomes for insulin delivery. J Nanomater 2010:652048.
- Higuchi T. (1961). Rate of release of medicaments from ointment bases containing drugs in suspension. J Pharm Sci 50:874–5.
- Hu Y, Zhang Q, You R, et al. (2012). The relationship between secondary structure. Adv Mater Sci Eng 2012:1–5.
- Huang D, Sun M, Bu Y, et al. (2019). Microcapsule- embedded hydrogel patches for ultrasound responsive and enhanced transdermal delivery of diclofenac sodium. J Mater Chem B 7:2330–7.
- Johari N, Moroni L, Samadikuchaksaraei A. (2020). Tuning the conformation and mechanical properties of silk fibroin hydrogels. Eur Polym J 134:109842.
- Kapoor S, Kundu SC. (2015). Silk protein-based hydrogels: Promising advanced materials for biomedical applications. Acta Biomater 31:17–32.
- Kim MH, Park WH. (2016). Chemically cross-linked silk fibroin hydrogel with enhanced elastic properties, biodegradability, and biocompatibility. Int J Nanomed 11:2978.
- Knopp JL, Pearson LH, Chase JG. (2019). Insulin units and conversion factors: a story of truth, boots, and faster half-truths. J Diabetes Sci Technol 13:597–600.
- Korsmeyer RW, Gurny R, Doelker E, et al. (1983). Mechanisms of solute release from porous hydrophilic polymers. Int J Pharm 15:25–35.
- Kuang D, Jiang F, Wu F, et al. (2019). Highly elastomeric photocurable silk hydrogels. Int J Biol Macromol 134:838–45.
- Kuang D, Wu F, Yin Z, et al. (2018). Silk fibroin/polyvinyl pyrrolidone interpenetrating polymer network hydrogels. Polymers 10:153.
- Lammel A, Hu X, Park SH, et al. (2010). Controlling silk fibroin particle features for drug delivery. Biomaterials 31:4583–91.
- Langer RS, Peppas NA. (1981). Present and future applications of biomaterials in controlled drug release systems. Biomaterials 2:201–14.
- Li J, Mooney DJ. (2016). Designing hydrogels for controlled drug delivery. Nat Rev Mater 1:1–37.
- Lim KS. (2015). Silk hydrogels for tissue engineering. Winter Solstic 21:1–7.
- Lougheed WD, Fischer U, Perlman K, et al. (1981). A physiological solvent for crystalline insulin. Diabetologia 20:51–3.
- Lougheed WD, Woulfe-Flanagan H, Clement JR, Albisser AM. (1980). Insulin aggregation in artificial delivery systems. Diabetologia 19:1–19.
- Magos M, Tapia J, López M, et al. (2020). Cytotoxicity and UV light absorption in biopolymeric membranes from native vegetation of mexico. Appl Sci 10:4995.
- Maji P, Gandhi A, J S, Maji N. (2013). Preparation and characterization of maleic anhydride cross-linked chitosan-polyvinyl alcohol hydrogel matrix transdermal patch. J PharmaSciTech 2:62–7.
- Mallawarachchi S, Mahadevan A, Gejji V, Fernando S. (2019). Mechanics of controlled release of insulin entrapped in polyacrylic acid gels via variable electrical stimuli. Drug Deliv Transl Res 9:783–94.
- Manno M, Craparo EF, Martorana V, et al. (2006). Kinetics of insulin aggregation: disentanglement of amyloid fibrillation from large-size cluster formation. Biophys J 90:4585–91.
- Mansoor S, Kondiah PPD, Choonara YE, Pillay V. (2019). Polymer-based nanoparticle strategies. Polymers 11:1380.
- Mavondo GAA, Tagumirwa MC. (2016). Asiatic acid-pectin hydrogel matrix patch transdermal delivery system influences parasitaemia suppression and inflammation reduction in P. berghei murine malaria infected sprague–dawley rats. Asian Pac J Trop Med 9:1172–1180.
- Mongkolkitikul S, Paradee N, Sirivat A. (2017). Electrically controlled release of ibuprofen from conductive poly(3-methoxydiphenylamine)/crosslinked pectin hydrogel. Eur J Pharm Sci 112:20–7.
- Murthy SN. (2012). Transdermal drug delivery: approaches and significance. RRTD 1:1–2.
- Nadendla K, Friedman SH. (2017). Light control of protein solubility through isoelectric point modulation. J Am Chem Soc 49:17861–9.
- Narita C, Okahisa Y, Wataoka I, Yamada K. (2021). Characterization of ground silk fibroin through comparison of nanofibroin and higher order structures. ACS Omega 5:22786–−92.
- Niswender KD. (2011). Basal insulin: physiology, pharmacology, and clinical implications. Postgrad Med 123:17–26.
- Oktay S, Alemdar N. (2018). Electrically controlled release of 5-fluorouracil from conductive gelatin methacryloyl-based hydrogels. J Appl Polym Sci 136:46914.
- Paradee N, Thanokiang J, Sirivat A. (2021). Conductive poly(2-ethylaniline) dextran-based hydrogels for electrically controlled diclofenac release. Mater Sci Eng C 118:111346.
- Park HJ, Lee JS, Lee OJ, Sheikh FA, et al. (2014). Fabrication of microporous three-dimensional scaffolds from silk fibroin for tissue engineering. Macromol Res 22:592–9.
- Patarroyo JL, Florez-Rojas JS, Pradilla D, et al. (2020). Formulation and characterization of gelatin-based hydrogels for the encapsulation of kluyveromyces lactis—applications in packed-bed reactors and probiotics delivery in humans. Polymers 12:1287.
- Peppas NA, Merrill EW. (1977). Crosslinked poly(vinyl alcohol) hydrogels as swollen elastic networks. J Appl Polym Sci 21:1763–70.
- Peppas NA, Wright SL. (1996). Solute diffusion in poly(vinyl alcohol)/poly(acrylic acid) interpenetrating networks. Macromolecules 29:8798–804.
- Pillai O, Kumar N, Dey CS, et al. (2003). Transdermal iontophoresis of insulin. Part 1: A study on the issues associated with the use of platinum electrodes on rat skin. J Pharm Pharmacol 55:1505–1513.
- Pillai O, Nair V, Panchagnula R. (2004). Transdermal iontophoresis of insulin: IV. Influence of chemical enhancers. Int J Pharm 269:109–20.
- Pillai O, Panchagnula R. (2004). Transdermal iontophoresis of insulin: VI. Influence of pretreatment with fatty acids on permeation across rat skin. Skin Pharmacol Physiol 17:289–97.
- Quicenoa NJ. Lópezb CA, Osorioc AR (2017). Structural and thermal properties of silk fibroin films obtained from cocoon and waste silk fibers as raw materials. Procedia Eng 200:384–8.
- Radu IC, Biru IE, Damian CM, et al. (2019). Grafting versus crosslinking of silk fibroin-g-PNIPAM via tyrosine-NIPAM bridges. Molecules 24:4096.
- Ruangmak K, Paredee N, Niamlang S, et al. (2021). Electrically controlled transdermal delivery of naproxen and indomethacin from porous cis-1,4-polyisoprene matrix. J Biomed Mater Res Part B: Appl Biomater 110:1–11.
- Schacht EH. (2004). Polymer chemistry and hydrogel systems. J Phys: Conf Ser 3:22–8.
- Sen M, Uzun C, Guven O. (2000). Controlled release of terbinafine hydrochloride from pH sensitive poly(acrylamide/maleic acid) hydrogels. Int J Pharm 203:149–57.
- Shah RB, Patel M, Maahs DM, Shah VN. (2016). Insulin delivery methods: past, present and future. Int J Pharma Investig 6:1–9.
- Srinivasan V, Higuchi WI, Sims SM, et al. (1987). Trandermal iontophoretic drug delivery: mechanistic analysis and application to polypeptide delivery. J Pharm Sci 78:370–5.
- Szunerits S, Boukherroub R. (2018). Heat: A highly efficient skin enhancer for transdermal drug delivery. Front Bioeng Biotechnol 6:1–13.
- Tari K, Khamoushian S, Madrakian T, et al. (2021). Controlled transdermal iontophoresis of insulin from water-soluble polypyrrole nanoparticles: an in vitro study. IJMS 22:12479.
- Tokumoto S, Higo N, Sugibayashi K. (2006). Effect of electroporation and pH on the iontophoretic transdermal delivery of human insulin. Int J Pharm 326:13–9.
- Varkey A, Venugopal E, Sugumaran P, et al. (2015). Impact of silk fibroin-based scaffold structures on human osteoblast MG63 cell attachment and proliferation. Int J Nanomed 10:43–51.
- Whittaker JL, Choudhury NR, Dutta NK, Zannettino A. (2014). Facile and rapid ruthenium mediated photocrosslinking of Bombyx mori silk fibroin. J Mater Chem B 2:6259–70.
- Wu N, Yu H, Sun M, et al. (2019). Investigation on the structure and mechanical properties of highly tunable elastomeric silk fibroin hydrogels cross-linked by γ‑ray radiation. ACS Appl Bio Mater 3:721–34.
- Yang J, Li Y, Ye R, et al. (2020). Smartphone-powered iontophoresis-microneedle array patch for controlled transdermal delivery. Microsyst Nanoeng 6:112.
- Ye S, Wang C, Liu X, et al. (2006). New loading process and release properties of insulin from polysaccharide microcapsules fabricated through layer-by-layer assembly. J Control Release 112:79–87.
- Zhang H, Li LL, Dai F, et al. (2012). Preparation and characterization of silk fibroin as a biomaterial with potential for drug delivery. J Transl Med 10:117.
- Zhang L, Jiang H, Zhu W, et al. (2008). Improving the stability of insulin in solutions containing intestinal proteases in vitro. Int J Mol Sci 9:2376–87.
- Zhang Y, Yu J, Kahkoska AR, et al. (2019). Advances in transdermal insulin delivery. Adv Drug Deliv Rev 139:51–70.
- Zhang Z, Xin P, Ou Q, et al. (2018). Poly(ester amide)-based hybrid hydrogels for efficient transdermal insulin delivery. J Mater Chem B 6:6723–30.
- Zheng H, Duan B, Xie Z, et al. (2020). Inventing a facile method to construct Bombyx mori (B. mori) silk fibroin nanocapsules for drug delivery. RSC Adv 10:28408–14.