
Abstract
Background:
Google Trends provides an easily accessible and cost-effective method of providing real-time insight into user interest.
Objective:
to address the gap in UK prevalence data for e-cigarettes by analyzing Google Trends to identify correlations with official data from Action on Smoking and Health. The study further evaluates Google Trend’s sensitivity to real-time events and the ability for predictive models to forecast future data based on Google Trends.
Methods:
UK Google Trends data from 2012 to 2021 was analyzed to assess (a) the most popular electronic nicotine device terminology; (b) statistically significant points in time; (c) correlations between Relative Search Volumes and official reports on electronic cigarette use and (d) whether Google Trends could predict future patterns in data. These were achieved using Locally Weighted Scatterplot Smoothing regression, Pruned Exact Linear Time Method, cross correlation, and Autoregressive Integrated Moving Average algorithms respectively.
Results:
“Vape” was revealed to be the most popular electronic nicotine device terminology with a correlation coefficient greater than +0.9 when compared to official electronic cigarette consumption data within a one-year timescale (lag 0). Results from ARIMA modeling were varied with the algorithms forecasted trends line occasionally lying outside of a 95% prediction interval.
Conclusion:
Google Trends may correspond to population-based prevalence of electronic cigarette use. The changing trends coincide with changing policy decisions. Google Trends based prediction for online interest in electronic cigarettes requires further validation so should currently be used in conjunction with other traditional methods of data collections.
Keywords:
Introduction
The opinions of healthcare bodies across the globe surrounding the use of electronic cigarettes (e-cigarettes) have remained controversial. Whilst the Centers for Disease Control and Prevention in the US states that there is “no conclusive scientific evidence that e-cigarettes are effective for long-term cessation of cigarette smoking” (Wiltz et al., Citation2017), the UK Health Security Agency instead claims that “vaping products could play a crucial role in reducing the enormous health burden caused by cigarette smoking” (McNeill et al., Citation2021). With such differences in opinion, there is an urgent need for research to address the long-term implications of e-cigarette use with a focus on the prevalence of vaping. The World Health Organization (WHO) and the Institute for Health Metrics and Evaluation (IHME), an independent global health research center at the University of Washington that uses evidence to generate global burden of disease, estimates to improve health policy and practice, require data regarding e-cigarette prevalence (World Health Organisation, Citation2019) (Personal communications). Unlike traditional methods of data capture that require greater ethical considerations, data protection and resources, by being in the public domain, Google Trends makes data collection accessible and time efficient at low costs.
Google Trends illustrates interest in a particular topic from around the globe to provide a perspective on what people are currently interested in, which can help users to discover patterns in search behavior (Rogers, Citation2016). One study assessed whether online interest in electronic nicotine delivery systems (ENDS) correlated with published reports of actual consumption (Ghosh et al., Citation2021). It “indicated preliminary evidence of validity of the Google Trends-based analysis for assessing population behaviour and interest of ENDS”, however, stated that its validity can only be determined when results are replicated from other countries. Our study aimed to examine the correlation between Google Trends data and e-cigarette prevalence captured by routine population-based surveillance and to test the predictability of Google Trends data for online interest of ENDS.
The first objective was to address the gap in UK prevalence data by analyzing Google Trends data from 2012 to 2021 to coincide with the data of official e-cigarette users from the Action on Smoking and Health (ASH), a UK-based charity founded by the Royal College of Physicians, that facilitate research in tobacco usage and public health policy (Action on Smoking & Health, Citation2023). This helped us identify the main ENDS terminology used by internet searchers, so that direct comparisons could be made between Google Trends and ASH to identify any correlations between the two data sets. The next objective was to determine how sensitive Google Trends was at responding to real-time events surrounding the topic of e-cigarettes. For example, new discoveries, endorsements, or studies. This was achieved by monitoring for any sudden changes in relative search volume for the chosen search term via statistical analysis. The final objective was to evaluate the accuracy of applying a predictive model (ARIMA) to the Google Trends data (2012 to 2021) to predict future e-cigarette prevalence in the next 12 months. This objective was important in investigating whether past Google Trends ENDS data could accurately predict future online interest. Prior studies have shown that Google Trends can help predict future outcomes such as disease outbreaks. One study looking at surveillance data for influenza outbreaks found that Google Trends had “estimated influenza levels 1–2 wk earlier than published CDC reports” (Carneiro & Mylonakis, Citation2009). This unique real-time data shows a potential future application for decision making on the basis that Google Trends can provide data faster than conventional methods.
Methods
Search procedure
An “all category” search approach was used so data was collected from all Google platforms: Google Search, News, Images, Shopping and YouTube. This method was chosen based on two reasons; (a) an assumption that those that were interested in e-cigarettes may not exclusively use Google search to enquire about the product and (b) methodology from other Google Trends studies such as a US study investigating opioid overdose (Ghosh et al., Citation2022) and another study on alcohol policy (Ghosh et al., Citation2021) both used an all-category response. The search terms were “electronic cigarette”, “e-cigarette”, “vape” and “vaping”. These terms were chosen to maintain a focus on common yet generic terminology that may be used regardless of one’s familiarity with specific products in the vaping industry. As a result, references to specific products or companies were excluded as they could indicate prior familiarity and would have not been representative search terms of all users. The other reason was an indication from Google Trends that a user who searches for one term is likely to search for the other term under the “related topics and queries”. Moreover, our chosen search terms were also inspired by those reported in other relevant studies e.g. a Turkish study used the term “electronic cigarette” (Uysal et al., Citation2018) whilst another went with “Electronic cigarette”, “Cigarette”, “vaping” and “Juul Pods” (Ghosh et al., Citation2021) for the US. As search inputs in Google Trends can be specified as either topic or a search term, the latter was chosen. The reason for this was that topics include all search terms related to the word, so it is instead chosen when there is trouble identifying search terms (Leung, Citation2015).
The dates observed for data collection were between 1st January 2012 to 1st April 2021 to align with the official e-cigarette usage data provided by ASH. An explanation of the methodology used to gain this data is outlined in their report (Action on Smoking & Health, Citation2021). There were two sources of official data that Google Trends could have been compared to: ASH or the ONS (Office for National Statistics). Both sources targeted their survey to adults aged 18 and older living in Great Britain however sample sizes varied from 12,809 respondents from ASH (Action on Smoking & Health, Citation2021) and 320,000 respondents from ONS (Office for National Statistics, 2019). Ultimately, ASH was chosen because (1) it provided data over a longer period from 2012 to 2021 whereas ONS was from 2014 to 2019 and (2) validating the quality of the data- there were discrepancies in the data provided by ONS. Previously established results were not consistent across publications with no apparent cause given for such inconsistencies. We communicated our queries about the inconsistencies to the relevant authorities however they were unable to provide definitive answers. Therefore any results that we would obtain using this data would be ultimately unreliable. The country of search was selected as the United Kingdom because the official data that Google Trends was being compared to was data originating from the UK. Online interest in ENDS was measured by the RSV; the default measurement used in Google Trends. RSV is calculated as the number of queries for a keyword divided by the total Google search queries. This means that RSV shows the proportion of Google users that are searching for a term.
Data collection procedure
A search of the chosen terms was conducted on 28 October 2021. The index of measurement used was the Relative Search Volume (RSV), a scale from 0 to 100 where the value represents the relative popularity of the term at a specific time over the given period where a higher value indicates a higher popularity (Nasser, Citation2018).
Data analysis
RStudio is an integrated environment development software that consolidates different programming tools into a simple application (R Team, Citation2020). It uses the coding language R to clean, analyze and graph data (Weston & Yee, Citation2017). To address the objective of whether the data from Google Trends and ASH are compatible, it was important to narrow down which search term from Google would be most appropriate to compare to ASH. To solve this issue, the Locally Weighted Scatterplot Smoothing (LOWESS) regression function on RStudio was used. LOWESS creates a smooth line through a scatter plot, making trends easily and visually identifiable (Jacoby, Citation2000). The regressed smooth lines were compared to a graph illustrating the official e-cigarette usage data from ASH to compare which curve best matched ASH’s. From this point, all further analysis would be conducted on the best-matched search term.
To explore the next objective of Google Trends sensitivity to real-time events, a statistical analysis of the RSV was completed. Sensitivity was defined as statistically significant changes in trends by comparing means and variances amongst RSV across the nine years data was collected. This function was created using the Pruned Exact Linear Time method (PELT) on RStudio. Changepoint analysis had been chosen due to its wide application of use in different types of data sets such as climatology (Reeves et al., Citation2007), bioinformatics (Erdman et al., 2008) and medical imaging (Nam et al., Citation2012). Furthermore, PELT detects the optimal number of changepoints to avoid over-identifying significant points (Wambui et al., Citation2015).
Cross correlation
Cross-correlation function from “stats” package of RStudio determined the degree of similarity between Google Trends and ASH data. This allowed for the strength and directionality of data to be compared to determine whether the data moved in tandem and if the correlation was statistically significant.
Predictive modeling
To address the last hypothesis of Google Trends predictive ability, we used the Autoregressive Integrated Moving Average (ARIMA) function to leverage time series data from ASH to better understand the data and to predict future Google Trends RSV. ARIMA consists of three components (Krauss et al., 2017): the autoregressive component uses past values of the data to predict future values, the integrated component removes trends and seasonality making the data stationary, and finally, the moving average component uses past errors of the model to adjust future predictions. The core assumptions ARIMA makes about the data are that it is stationary, statistical properties of the data are constant over time, and autocorrelated values of the time series are correlated with previous values (Andrea et al., 2021). We assumed that these conditions hold for our data as there were no time related factors that could affect the number of searches being made. ARIMA was chosen due to it being the “most well-known method” for predicting univariate time series data (Krauss et al., 2017); ARIMA has previously been used to forecast monthly patient volume in primary care (Abdel-Aal Re & Mangoud, Citation1998) and predicting dengue incident rates (Dhamodharavadhani & Rathipriya, Citation2020).
Results
Visualization and statistical significance of trends
LOWESS analysis was applied to the RSV of all four search terms (). From 2012 to 2014, the terms “electronic cigarette” and “e-cigarette” were the most popular with peaks in April and August 2013. The RSV on average was within the range of 40–60. After its decline in 2014, showing a steep yet steady fall, the RSV was within the range of 5 to 20. In comparison, the terms “vape” and “vaping” quickly gained popularity after 2014 reaching a peak of 90 in July 2019. By July 2016, “vape” had become the most popular search term across all Google platforms.
Figure 1. Popularity for the terms “electronic cigarette” (blue) and “e-cigarette” (red), “vape” (black) and “vaping” (purple) expressed as RSV over time. Declining slope indicates decrease in popularity of the search term.
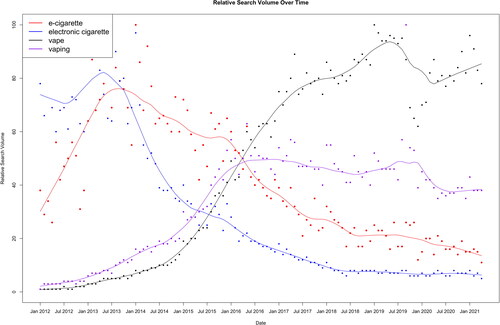
When comparing the trends with the actual percentage of vape users in the UK from ASH, the search term that most closely resembled the official figures was “vape”. As a result, “vape” was chosen to be the search term that will be used for the remainder of this study.
From the chosen term, a changepoint analysis was conducted on its RSV. This revealed two significant changepoints, August 2015 and December 2016. This meant that at these two periods, there was a significant change in the term’s RSV.
Cross correlation
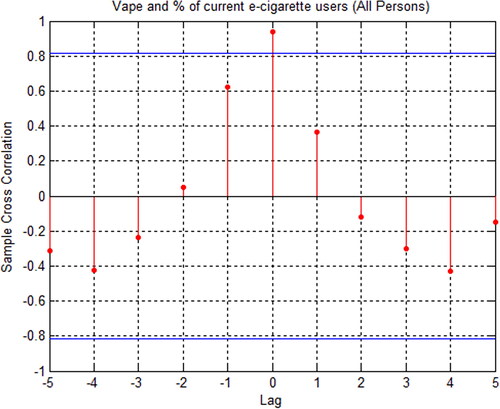
shows the results of cross-correlation analysis which demonstrate that lag 0 is the only statistically significant point at which a correlation was found between the data, as it was the only point that crossed the confidence bound. This meant that at present year, the two data sets were displaying the same trends at the same time. The correlation coefficient was greater than +0.9 (meaning around 81% similarity in both trend and direction), suggesting that the data are strongly matched in trend.
Figure 2. Cross correlation to measure the data synchronicity between the actual prevalence data and the Google trend’s data. The horizontal blue lines represent the upper and lower confidence bounds so lag 0 indicates a statistically significant correlation, suggesting that the data are strongly matched in both trend and directionality.
Predictive modeling
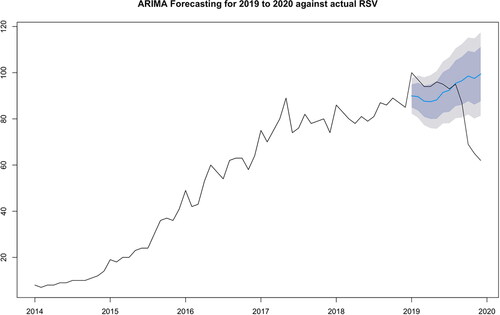
shows the ARIMA forecast for 2019 to 2020 with the blue line showing the predicted trend and the black line showing the actual RSV from Google Trends. The dark grey area represents a prediction interval of 80% and the light grey area is a prediction interval of 95%. From inspection, the prediction of the first half of 2019 was accurate, displaying similar peaks and directionality of the curve in the 80% prediction interval. However, after this point, ARIMA predicted a steady rise in RSV whereas the actual search volume drastically dropped to its lowest point since 2017, outside ARIMA’s 95% prediction interval.
Figure 3. Predictability of ARIMA model (blue line) in forecasting the online interest in vaping versus actual Google trend’s data (black line) for 2019 to 2020 with confidence intervals of 80% and 95% respectively.
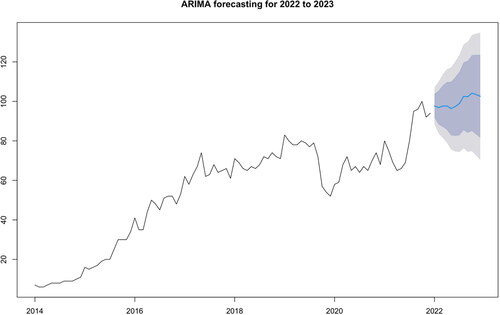
Lastly, shows ARIMA’s prediction for 2022 to 2023. Although the accuracy of this cannot be determined yet, the general observations show a slow rise in RSV. This overall suggests that the term ‘vape’ is recovering its popularity after the drop in interest at the end of 2019. The accuracy of this predication was calculated to generate the MAPE value. A value less than 20% is considered good and less than 10% is excellent (Gilliland, Citation2010). The value generated for the 2022 prediction was 7.17%, meaning that the values generated by ARIMA should be around 7% off the true values that will be seen in actual Google Trends.
Figure 4. ARIMA model forecasting the online interest in vaping for 2020 to 2023 with confidence intervals of 80% and 95% respectively.
Discussion
Google Trends is a statistical website that provides real-time data exploring changes in public interests and behaviors. With the rise in e-cigarette popularity, assessment of the implementation of Google Trends to validate data, respond to changing public interest, and predict future trends would be a crucial tool in influencing public health policy. The outcome of this research supports the use of Google Trends acting as a proxy measure of e-cigarette exposure data to bridge the current gap in prevalence data. The reasons below will justify and explore this statement.
Visualization and statistical significance of trends
One source of evidence for the reliability of Google Trends comes from the LOWESS findings which determined that the term ‘vape’ most resembled the results from official data and showed a shift in terminology preference from ‘e-cigarette’ to ‘vape’. A justification for this could be because, although very similar, vape products provided a new, innovative way of smoking that its counterparts were lacking in such as (1) creating a sense of community via events such as VapeFest in 2010, (2) an assortment of e-liquid flavors, (3) customization, (4) longer battery life and (5) re-usability (Black Note, Citation2017). However, one study found contrasting results- “electronic cigarette” produced a much higher RSV as opposed to “vaping” in the US [5]. This may be explained by the ban on all flavored e-cigarettes in the US. A study looking at the effects this had on online interest found that users were likely to “replace cartridge-based vaping products with disposable e-cigarettes” (Dai, Citation2022).
After, changepoint analysis was conducted to determine any statistically significant points in time. The detected points seemed to show a significant increase in RSV following government comments on the topic of e-cigarettes. The changepoint in August 2015 coincides with a report commissioned by Public Health England (PHE) stating that electronic cigarettes “are around 95% safer than smoking” (McNeil et al., Citation2015) and the second coincided with the December 2016 parliamentary questions and answers surrounding e-cigarettes (Action on Smoking and Health, Citation2016). The topics discussed included ways to increase access to vaping devices and remove barriers toward vaping uptake. This further validates the efficacy of Google Trends, as it was able to show an increase in RSV that we would expect to see following supportive government policy of vaping. As both changepoints corresponded to government statements surrounding ENDS use, a takeaway from this could be that health officials should be careful when giving advice as the public is easily influenced and responds quickly to advice.
Surprisingly, no significant event was detected in late 2019 where there was a sharp and sudden drop in RSV (). This drop was likely to be caused by the outbreak of e-cigarette or vaping use-associated lung injury (EVALI) in the US, which resulted in over two thousand cases and forty deaths by November of that year (Centers for Disease Control and Prevention & C. f. D. C. a, Citation2020). The online response to EVALI showed that internet searches for quitting e-cigarette use increased (Kalkhoran et al., Citation2020). Moreover, Google shopping queries for vaping products concluded that “unplanned events, such as the EVALI outbreak, can provoke changes in the epidemiology of product used” (Leas et al., Citation2022). This finding suggests a complementary role of LOWESS and PELT as using multiple methods to examine the same results could fill in the gaps one model may miss.
The results were also compared to a similar study in the US [5]. Changepoints from the search terms “electronic cigarette” and “Juul pods” were likely associated with the rise in e-cigarette popularity in high-school students, as well as the excitement surrounding Juul’s launch. Though these points are specific to the US, it was interesting that their model also did not pick up 2019 as significant for “electronic cigarette” but did for “Juul pods” after a slight lag period. What can be inferred from this is that each search term is likely to produce a different outcome, so what may be deemed significant for one will not necessarily be significant for the other. A solution to this could be to conduct the data analysis on a few possible search terms and decide on the most appropriate term once all the results can be compared to each other. In addition, there could be a case for using alternate methods of calculating change points which could be compared to the results obtained by the PELT algorithm to determine which is more accurate.
Cross correlation
The strong correlation at a lag value of 0 indicated that current Google Trends data can reflect yearly consumption figures. This means that it could potentially be used in conjunction with typical data collection methods, either as an additional data source or as some form of validation metric. Although there is no other similar cross-correlation to compare this study’s results, this tool has been used in other medical areas. Correlation for the Google Trends search of “coronavirus” and incident case numbers found “significant positive correlations” between the two data sets (Sulyok et al., Citation2021). However, another study pointed out the importance of choosing the correct search term, as when comparing Google search volume and suicide rates, there was a positive correlation for the term “generalised anxiety disorder” but a negative correlation for “sleep problem” (Lee, Citation2020). It is also important to mention that the accuracy of this finding assumes that the official usage data from ASH is representative of actual users. If factors such as the sample size are not reflective of the whole population, there is a chance that the data does not correspond.
Predictive modeling
The results from the prediction analysis indicated preliminary evidence for the use of ARIMA to forecast RSV in Google Trends. Although ARIMA is a favorable model at times where speed and reproducibility are desired, it is somewhat lacking in accuracy. ARIMA is univariate, meaning its prediction is characterized by a single variable -trends in past RSV (Iwok & Okpe, Citation2016). As a result, ARIMA does not have the flexibility to respond to real-time events as seen in 2019. The sudden drop in RSV, most likely caused by EVALI, meant that its prediction did not reflect what was seen. This showed the need to consider extraneous factors in the model. Furthermore, events like this, which drastically impact RSV values, indicate our assumption of stationarity may not hold. Therefore, ARIMA may not be the most appropriate model for long-term forecasting of trends data. Investigations into different models are warranted. This study opens up a new direction of research to testing new methods of prediction and replicability in predictive modeling to determine correlations between data.
Limitations
Due to a lack of data from official sources regarding e-cigarette usage in individuals under the age of 18, this study can only capture correlations between Google searches and adults aged 18 and above. It is reasonable to assume that younger people are more active online and are therefore more likely to make e-cigarette-related searches. As a consequence of the lack of data, these correlations are not captured in this paper. The impact of this was unable to be examined and thus warrants further investigation.
Limitations of the findings came from the implementation of Google Trends itself. Some of the prominent limitations included: the use of relative numbers over absolute numbers, the unknown context behind the search, scarce demographic information, exclusion of data from non-Google search platforms, and lastly, exclusion of data from people who do not have access to the internet or do not choose to gain their information from the internet.
As mentioned in the methodology, RSV shows the proportion of Google users that are searching for a term. The intuitive interpretation of a declining trend is that fewer internet users are interested in the term. Though this may be the case, it could equally mean that there is a reduction in the proportion of searches i.e. the number of total Google search users increases, while the users searching for that term either remain stagnant or increase at a slower rate. Therefore, as Google Trends does not provide the actual numbers of users, it may be easy to misinterpret trends.
Google Trends just shows the general interest in a topic, not an explanation of what is driving the interest or what users do with that information. It is only an assumption that people who search about vaping will then go on to purchase it. While a survey can ask directly targeted questions to address these questions, Google Trends is unable to do so.
In the UK, Google Trends has the largest market share at 86.31% (Johnson, 2021). This means that roughly 14% of internet searches have not been considered. When looking at reproducibility, this would be harder to achieve in countries where Google has a low penetration rate or where internet uptake is low. For example, Google has a 5% share of the search traffic in China where the use of Google is banned (Johnson, 2021) and only around 12% of the Somali population has access to the internet (Johnson, 2021). This suggests that the reliability of Google Trends is country specific, and the effects of market dominance and internet accessibility must be considered.
Lastly, Google Trends is only one tool for determining interest. Online platforms such as social media, news broadcasts, television and film have a role to play in driving public interest, which may also extend toward conversations between friends and family that may influence people’s opinions. Therefore, when interpreting results, it is important to keep in mind that Google Trends is only displaying interest from online searches, not whole population interest levels.
Conclusion
Google Trends is a useful tool for quickly obtaining information about user interests and behavior and is more economically efficient than traditional methods of data collection. The tool has shown promise in validating existing data on e-cigarette usage in the UK and can provide insights into public attitudes and behavior in response to external factors. However, it is still in the early stages of development and requires further research. Therefore, it is recommended that Google Trends be used in conjunction with existing data collection methods or as a validation metric.
Disclosure statement
Keivan Ahmadi is in part supported by the National Institute for Health and Care Research (NIHR) Applied Research Collaboration (ARC) Northwest London.
The views expressed in this publication are those of the author(s) and not necessarily those of the National Institute for Health Research or the Department of Health and Social Care.
Data availability statement
The data underlying this article are available in Google Trends website at https://trends.google.com/trends/explore?q=vaping&geo=GB
The codes for the analysis hereinafter referred to as “R codes” will be shared on reasonable request to the corresponding author. Please note that to run the “R codes” appropriate statistical software is needed.
Additional information
Funding
References
- Abdel-Aal, R. E., & Mangoud, A. M. (1998). Modeling and forecasting monthly patient volume at a primary health care clinic using univariate time-series analysis. Computer Methods and Programs in Biomedicine, 56(3), 235–247. https://doi.org/10.1016/s0169-2607(98)00032-7
- Action on Smoking and Health. (2016, 2016-12-21). ASH Daily News for 21 December 2016. Action on Smoking and Health. Retrieved 4 January from https://ash.org.uk/media-and-news/ash-daily-news/ash-daily-news-for-21-december-2016/
- Action on Smoking and Health. (2021). Use of e-cigarettes (vapes) among adults in Great Britain. Action on Smoking and Health. chrome-extension://efaidnbmnnnibpcajpcglclefindmkaj/https://ash.org.uk/wp-content/uploads/2021/06/Use-of-e-cigarettes-vapes-among-adults-in-Great-Britain-2021.pdf
- Action on Smoking and Health. (2023). Who we are - ASH. https://ash.org.uk/about/who-we-are
- Carneiro, H. A., & Mylonakis, E. (2009). Google trends: A web-based tool for real-time surveillance of disease outbreaks. Clinical Infectious Diseases: An Official Publication of the Infectious Diseases Society of America, 49(10), 1557–1564. https://doi.org/10.1086/630200
- Dai, H., & Hao, J. (2022). Online popularity of JUUL and Puff Bars in the USA: 2019–2020. Tobacco Control, 31(1), 7–10. https://doi.org/10.1136/tobaccocontrol-2020-055727
- Dhamodharavadhani, S., & Rathipriya, R. (2020). Forecasting dengue incidence rate in Tamil Nadu using ARIMA time series model. In Machine learning for healthcare. (pp. 187–202). Chapman and Hall/CRC.
- Erdman, C., & Emerson, J. W. (2008). A fast Bayesian change point analysis for the segmentation of microarray data. Bioinformatics (Oxford, England), 24(19), 2143–2148. https://doi.org/10.1093/bioinformatics/btn404
- Ghosh, A., Bisaga, A., Kaur, S., & Mahintamani, T. (2022). Google Trends data: A potential new tool for monitoring the opioid crisis. European Addiction Research, 28(1), 33–40. https://doi.org/10.1159/000517302
- Ghosh, A., Kaur, S., & Roub, F. (2021). Use and interest of electronic nicotine delivery systems (ENDS): Assessing the validity of Google Trends. The American Journal of Drug and Alcohol Abuse, 47(4), 414–421. https://doi.org/10.1080/00952990.2021.1944171
- Ghosh, A., E-Roub, F., Krishnan, N. C., Choudhury, S., & Basu, A. (2021). Can google trends search inform us about the population response and public health impact of abrupt change in alcohol policy? A case study from India during the covid-19 pandemic. The International Journal on Drug Policy, 87, 102984. https://doi.org/10.1016/j.drugpo.2020.102984
- Gilliland, M. (2010). The business forecasting deal: Exposing myths, eliminating bad practices, providing practical solutions. John Wiley & Sons.
- Iwok, I. A., & Okpe, A. S. (2016). A comparative study between univariate and multivariate linear stationary time series models. American Journal of Mathematics and Statistics, 6(5), 203–212.
- J, J. (2021a). Google market share countries 2021. Statista Research Department. Retrieved 8 January from https://www.statista.com/statistics/220534/googles-share-of-search-market-in-selected-countries/
- J, J. (2021b). Leading search engines ranked by market share UK 2021 | Statista. Statista Research Department. Retrieved 8 January from https://www.statista.com/statistics/280269/market-share-held-by-search-engines-in-the-united-kingdom/
- J, J. (2022). Countries with the lowest internet penetration rate 2022. Statista Research Department. Retrieved 8 January from https://www.statista.com/statistics/725778/countries-with-the-lowest-internet-penetration-rate/
- Jacoby, W. G. (2000). Loess:: A nonparametric, graphical tool for depicting relationships between variables. Electoral Studies, 19(4), 577–613. https://doi.org/10.1016/S0261-3794(99)00028-1
- Kalkhoran, S., Chang, Y., & Rigotti, N. A. (2020). Online Searches for Quitting Vaping During the 2019 Outbreak of E-cigarette or Vaping Product Use-Associated Lung Injury. Journal of General Internal Medicine, 36(2), 559–560. https://doi.org/10.1007/s11606-020-05686-5
- Leas, E. C., Moy, N. H., Nobles, A. L., Ayers, J., Zhu, S.-H., & Purushothaman, V. (2022). Google Shopping queries for vaping products, JUUL and IQOS during the e-cigarette, or Vaping, product use associated lung injury (EVALI) outbreak. Tobacco Control, 31(e1), e74–e77. https://doi.org/10.1136/tobaccocontrol-2021-056481
- Lee, J.-Y. (2020). Search trends preceding increases in suicide: A cross-correlation study of monthly Google search volume and suicide rate using transfer function models. Journal of Affective Disorders, 262, 155–164. https://doi.org/10.1016/j.jad.2019.11.014
- Leung, C. (2015). Exploring Google Trends: Finding keywords and queries. Quietly. Retrieved 19 November from https://blog.quiet.ly/industry/exploring-google-trends-explore-function-finding-keywords-queries/
- McNeil, A., Brose, L. S., Calder, R., Hitchman, S. C., Hajek, P., & McRobbie, H. (2015). E-cigarettes: An evidence update. A report commissioned by Public Health England. Public Health England, 111, 14–15.
- McNeill, A., Brose, L., Calder, R., Simonavicius, E., & Robson, D. (2021). Vaping in England: 2021 evidence update summary Public Health England. Retrieved 24 October 2021
- Nam, C. F. H., Aston, J. A. D., & Johansen, A. M. (2012). Quantifying the uncertainty in change points. Journal of Time Series Analysis, 33(5), 807–823. https://doi.org/10.1111/j.1467-9892.2011.00777.x
- Nasser, L. (2018). Exploring the Benefits of Google Trends. The next ad com. Retrieved 5 October from https://thenextad.io/blog/exploring-the-benefits-of-google-trends/
- Note, B. (2017). Vapes vs. E-cigarettes: What’s the Difference? Black Note Vape. Retrieved 4 January from https://www.blacknote.com/vapes-vs-e-cigarettes-whats-difference/
- Office for National Statistics. O. f. N. Statistics. (2020). Adult smoking habits in the UK: 2019. https://www.ons.gov.uk/peoplepopulationandcommunity/healthandsocialcare/healthandlifeexpectancies/bulletins/adultsmokinghabitsingreatbritain/2019#measuring-the-data
- Prevention, C. f. D. C. a. (2020). Outbreak of Lung Injury Associated with E-cigarette Use, or Vaping. Centers for Disease Control and Prevention. Retrieved 4 January from https://www.cdc.gov/tobacco/basic_information/e-cigarettes/severe-lung-disease.html#latest-outbreak-information
- Reeves, J., Chen, J., Wang, X. L., Lund, R., & Lu, Q. Q. (2007). A review and comparison of changepoint detection techniques for climate data. Journal of Applied Meteorology and Climatology, 46(6), 900–915. https://doi.org/10.1175/JAM2493.1
- Rogers, S. (2016). What is Google Trends data—and what does it mean? Google News Lab. Retrieved 5 October 2021 from https://medium.com/google-news-lab/what-is-google-trends-data-and-what-does-it-mean-b48f07342ee8
- Schaffer, A. L., Dobbins, T. A., & Pearson, S.-A. (2021). Interrupted time series analysis using autoregressive integrated moving average (ARIMA) models: a guide for evaluating large-scale health interventions [OriginalPaper]. BMC Medical Research Methodology, 21(1), 58. https://doi.org/10.1186/s12874-021-01235-8
- Sulyok, M., Ferenci, T., & Walker, M. (2021). Google Trends Data and COVID-19 in Europe: Correlations and model enhancement are European wide. Transboundary and Emerging Diseases, 68(4), 2610–2615. https://doi.org/10.1111/tbed.13887
- Team, R. (2020). RStudio:Integrated Development for R. RStudio. Retrieved 1 January from https://www.rstudio.com/
- Uysal, M. A., Niksarlioglu, Y., Carkoglu, A., Uysal, O., Kutluk, A. C., & Karadag, B. (2018). Digital epidemiology: Can Google trends give some information about electronic cigarette usage in Turkey? In: Eur Respiratory Soc. https://doi.org/10.1183/13993003.congress-2018.PA4545
- Wambui, G. D., Waititu, G. A., & Wanjoya, A. (2015). The power of the pruned exact linear time (PELT) test in multiple changepoint detection. Am. J. Theor. Appl. Stat, 4(6), 581–586.
- Weston, S., & Yee, D. (2017, 2017/02/28). Why You Should Become a UseR: A Brief Introduction to R. Psychscience. Retrieved 1 January from https://www.psychologicalscience.org/observer/why-you-should-become-a-user-a-brief-introduction-to-r
- Wiltz, J. L., Blanck, H. M., Lee, B., Kocot, S. L., Seeff, L., McGuire, L. C., & Collins, J. (2017). Peer Reviewed: Electronic Information Standards to Support Obesity Prevention and Bridge Services Across Systems, 2010–2015. Preventing Chronic Disease, 14, E103. https://doi.org/10.5888/pcd14.160299
- World Health Organisation. (2019). WHO report on the global tobacco epidemic, 2019: Offer help to quit tobacco use. World Health Organization.