
 ?Mathematical formulae have been encoded as MathML and are displayed in this HTML version using MathJax in order to improve their display. Uncheck the box to turn MathJax off. This feature requires Javascript. Click on a formula to zoom.
ABSTRACT
Purpose
The aim of this study is to establish which specific cognitive abilities are phenotypically related to reading skill in adolescence and determine whether this phenotypic correlation is explained by polygenetic overlap.
Method
In an Australian population sample of twins and non-twin siblings of European ancestry (734 ≤ N ≤ 1542 [50.7% < F < 66%], mean age = 16.7, range = 11–28 years) from the Brisbane Adolescent Twin Study, mixed-effects models were used to test the association between a dyslexia polygenic score (based on genome-wide association results from a study of 51,800 dyslexics versus >1 million controls) and quantitative cognitive measures. The variance in the cognitive measure explained by the polygenic score was compared to that explained by a reading difficulties phenotype (scores that were lower than 1.5 SD below the mean reading skill) to derive the proportion of the association due to genetic influences.
Results
The strongest phenotypic correlations were between poor reading and verbal tests ( up to 6.2%); visuo-spatial working memory was the only measure that did not show association with poor reading. Dyslexia polygenic scores could completely explain the phenotypic covariance between poor reading and most working memory tasks and were most predictive of performance on a test of arithmetic (
).
Conclusion
Shared genetic pathways are thus highlighted for the commonly found association between reading and mathematics abilities, and for the verbal short-term/working memory deficits often observed in dyslexia.
Dyslexia is a learning difference characterized by difficulties with reading and spelling (Friend et al., Citation2013). Cognitive profiling of dyslexic children and adults shows lower scores for various cognitive abilities, particularly working memory and attention, and there is some consistency in these deficits across languages with shallow (e.g., Spanish) and deep (English) orthographies (Beidas et al., Citation2013; Callens et al., Citation2012; Gavril et al., Citation2021; Soriano & Miranda, Citation2010; Tobia & Marzocchi, Citation2014). A recent high-powered genome-wide association study (GWAS) (Doust et al., Citation2022), which confirmed a heritable component to dyslexia, demonstrated that a polygenic score based on their genetic associations predicted up to 5.6% of variance in reading measures. In the present study, we seek to understand whether these polygenic scores predict cognitive profiles typically associated with dyslexia. We do this in a sample of adolescent twins and their non-twin sibling drawn from the population and measured on reading and spelling abilities, and on a battery of diverse cognitive tests. Replicating the phenotypic relations between poor reading and other cognitive abilities with polygenic scores will highlight those relations that may be dependent on shared underlying genetic mechanisms.
Twin and family studies have established that genetic predisposition is a large contributor to variance in reading abilities (Andreola et al., Citation2021; Daucourt et al., Citation2020); they have further shown how the genetic and environmental contributions change with development and identified factors that can modify them. For dyslexia and reading-related skills, the heritability (proportion of phenotypic variance accounted for by genetic variability) has been estimated between 51% and 76% (Andreola et al., Citation2021; Betjemann et al., Citation2008; Byrne et al., Citation2006; Dale et al., Citation2005; Harlaar et al., Citation2005; Hawke et al., Citation2006; Light & DeFries, Citation1995; Light et al., Citation1998; Stevenson, Citation1991; Stevenson et al., Citation1987). A recent meta-analysis by Andreola et al. (Citation2021) of 49 studies found the heritability of general reading ability to be ~66%; heritability estimates for dyslexia range between 40% and 60% (Fisher & DeFries, Citation2002; Gialluisi et al., Citation2021; Raskind et al., Citation2013). Multivariate genetic analysis in twin samples has shown significant genetic covariance between various cognitive abilities and reading ability (Christopher et al., Citation2016; Haworth et al., Citation2009). For example, Haworth et al. (Citation2009) investigated the relation between reading, mathematics, language and general cognitive ability (g) in a multivariate genetic analysis. Reading showed genetic correlations of .62 (95% CI =.57, .69) with g, .58 (95% CI .53, .63) with mathematics, and .63 (95% CI =. 58, .68) with language in the full sample, and these correlations remained high when analyzing the lower 15% at the distribution extremes. Christopher et al. (Citation2016) analyzed the genetic covariance between word reading, listening comprehension and reading comprehension for reading related abilities (working memory, inhibition, processing speed and naming speed). The strongest genetic correlations were found for working memory (.57, 95% CI [.50, .64] to .65, 95% CI [.59, .72]), followed by processing speed (.43, 95% CI [.34, .51] to .57, 95% CI [.51, .62]), then inhibition (.39, 95% CI [.29, .49] to .42, 95% CI [.31, .52]) and naming speed (.33, 95% CI [.24, .43] to .43, 95% CI [.36, .51]). Such findings suggest that the degree of genetic overlap may vary between dyslexia and different specific cognitive abilities.
Polygenic scores (PGS) allow us to study the combined effects of genetic variants distributed across the genome for polygenic traits like dyslexia. These scores are based on the aggregate effects of common genetic variants, that is, present in at least 1% of the population (Court, Citation2007). PGS are most often generated using the results of a genome-wide association study (GWAS), that is, a study that tests the association of millions of single nucleotide polymorphisms (SNPs) across the genome with a trait of interest. The largest GWAS of dyslexia so far was carried out by Doust et al. (Citation2022) and included 51,800 adults self-reporting a diagnosis of dyslexia and 1,807,070 controls. Their study calculated PGS from the GWAS summary statistics in four independent cohorts (including the Brisbane Adolescent Twin Study, which is used in the present study) and found that it could explain up to 5.6% of variance in a word recognition test: higher dyslexia PGS correlated with lower achievement on quantitative tests of reading and spelling. For the adolescent sample that we use here, 3.6% of variance in nonword reading performance was explained by the PGS, which represents the limit of variance that we might expect for the non-reading cognitive tests examined. Our expectations for the dyslexia PGS associations with the varied cognitive measures are based on their known phenotypic (and genetic, where available) relationships, which we briefly summarize next.
IQ Subtests
IQ tests, like the Wechsler Scales (Wechsler, Citation1981), typically measure cognitive abilities of Verbal Comprehension, Perceptual Reasoning, Working Memory, and Processing Speed, with each IQ subtest tapping more or less of these underlying broad cognitive skills. Small to large group mean differences in IQ subtests between dyslexics and controls have been previously reported (e.g., Hatcher et al., Citation2002; Kudo et al., Citation2015; Laasonen et al., Citation2009; Moura et al., Citation2014; Swanson, Citation2012; Swanson & Hsieh, Citation2009). Large differences were found for verbal comprehension and working memory (e.g., Cohen’s d of 1.17 for general knowledge), moderate effects for processing speed (e.g., Cohen’s d of .58 for perceptual coding), and smaller effects for visual perception (Cohen’s d of .28) (Moura et al., Citation2014). With regard to shared genetics, a multivariate twin study of performance on reading tests (albeit, proxy measures of word knowledge) and IQ subtests in the Brisbane Adolescent Twin Study found that the proportion of phenotypic correlation accounted for by genetic factors for reading and IQ subtests ranged from .58 to .70 for verbal subtests, from .61 to .72 for performance subtests, and was ~ .90 for perceptual coding speed (i.e., Digit Symbol) (M. Wainwright et al., Citation2004). We expect the dyslexia PGS associations to be in line with these findings; for example, the largest genetic mediation will be of the reading-Digit Symbol association.
Working memory
Working Memory (WM) has been widely researched as a principal component of executive functioning associated with reading disability (De Jonge & De Jonge, Citation1996; Swanson & O’Connor, Citation2009). IQ subtests assessing WM typically measure phonological WM via verbal stimuli; visuospatial WM measures instead tend to come from experimental tasks which require passive visuospatial storage plus an active visuospatial/verbal processing demand (Shah & Miyake, Citation1996). A meta-analysis by Swanson et al. (Citation2009) of the relation between WM components and reading disability found that children with reading disability against a background of average general cognitive ability had impairments in WM. Moderate-to-high effect sizes emerged for verbal short-term memory (STM), visual STM, verbal WM, and visual-spatial WM tasks. Verbal WM was supported as an essential component of executive functioning associated with reading ability, whereas visuospatial WM showed a moderate effect. However, visuospatial WM seems to explain a significant additional variance in reading comprehension (Pham & Hasson, Citation2014); children with reading difficulties may rely on visuospatial WM as a strategy to process written text. With regard to genetic overlap between reading and verbal WM, Kremen et al. (Citation2007) reported a very strong overlap of additive genetic effects for word reading, digit span, and reading span tasks in adult men, and Wadsworth and colleagues, studying 8- to 20-year-olds from the Colorado Reading Project, showed that 80% of the phenotypic association between reading performance and verbal WM (auditory span of syllables and unrelated words, and digit span tests) was mediated by genetic effects.
In this report, we focus on visuo-spatial WM, specifically the Delayed Response (DR) task, which involves short-term storage and executive function (Luciano, Wright, et al., Citation2001), as well as IQ subtests investigating verbal WM (Digit Forward, Digit Backward and Letter-number sequencing). We expect dyslexia PGS to be predictive of all these measures of WM.
Elementary cognitive tasks
Here we distinguish experimental cognitive tasks measuring processing speed from those included in IQ subtests. Reaction time (RT) and Inspection Time (IT) tasks are very basic cognitive tasks that, respectively, measure the speed of psychomotor processing and perceptual discrimination acuity. Past literature has provided evidence in support of worse performance in RT tasks for dyslexics (Nicolson & Fawcett, Citation1994; Sobotka & May, Citation1977). However, for Choice RT (CRT), the studies of Bonifacci and Snowling (Citation2008) and Gooch et al. (Citation2012) did not find performance differences between dyslexic and non-dyslexic children. For dyslexia and IT, McLean et al. (Citation2011) did not find significant group differences in visual IT, whereas Whyte et al. (Citation1985) found longer visual ITs in dyslexic children compared to non-dyslexic readers, albeit in a small total sample of N = 14. Another study found no significant difference in mean IT between dyslexic children and controls, but one-third of dyslexic children were not able to complete the IT task and were excluded from the study, compared to only 8% of controls (Kranzler, Citation1994). The general deficit in speed of processing for poorer readers (Bonifacci & Snowling, Citation2008; McLean et al., Citation2011) has not been reliably confirmed in elementary cognitive tasks, but given their overlap with psychometric speed tests (Juhel, Citation1991) where slower speed is reported in dyslexics (Moura et al., Citation2014), we expect the dyslexia PGS to predict these tasks. This would be consistent with the multivariate twin studies (e.g., Christopher et al., Citation2016 described earlier) showing genetic overlap between reading skill and processing speed.
Creativity
While not strictly a cognitive ability because of its reliance on other factors such as personality (Benedek et al., Citation2014), increased creativity has been proposed as a compensatory enhancement associated with reading difficulties (Majeed et al., Citation2021). However, in the Brisbane Adolescent Twin Study, Ritchie et al. (Citation2013) found no evidence of this: higher scores in reading and spelling abilities were correlated with higher creativity scores (i.e., creative writing and openness to experience), even when controlling for IQ. This result held when testing the extremes; the poorest readers (scoring at least 1.5 standard deviations below the mean) tended to have the lowest scores on the creativity measures, while the most creative individuals (>1 SD above the mean) tended to have the highest reading ability. We expect then that the dyslexia PGS will predict lower levels of creativity.
To determine the extent to which genetic variation explains overlaps between dyslexia and the diverse cognitive abilities measured here, it is necessary to establish the magnitude of phenotypic correlation between reading difficulties (a proxy for dyslexia) and our measures. Our study therefore aims to 1) establish which specific cognitive abilities are phenotypically related to reading skill, and 2) determine how much of this phenotypic correlation, if present, is explained by polygenetic overlap. We do this in the Brisbane Adolescent Twin Study, an Australian population-representative sample of adolescent twins and their non-twin siblings who have been genotyped and tested on a wide range of cognitive abilities.
Materials and methods
Participants
Data were available for participants of the Brisbane Memory, Attention and Problem Solving (MAPS) study, the 16-year-old wave of the Brisbane Longitudinal Twin Study (Wright & Martin, Citation2004; Wright et al., Citation2001). At the time of testing, the mean age was 16.7 years (min = 15.41, max = 28.77, SD = 1.59) for the cognitive tasks, and 17.17 years (min = 16, max = 20, SD = 0.39) for the Queensland Core Skills Test, an exam sat in the final year of high school. Participants were also measured on a battery of reading, spelling, and memory measures as part of a later study on reading and spelling ability, the Brisbane Adolescent Twin Sample (BATS; Luciano et al., Citation2013; Wright & Martin, Citation2004); at testing, the mean age was 19.18 years (min = 11.87, max = 28.62, SD = 3.83). From an initial pool of 1648 subjects including 608 families, data were available for a maximum of 1542 subjects, to a minimum of 734, due to variation in depth of phenotyping for different individuals in the sample, the subjects were pairs of MZ twins, DZ twins and their non-twin siblings (see ). All participants in this sample, who had available PGS, were of European descent and consistent with the genetic ancestry of the original sample in which the genome-wide association study (GWAS) of dyslexia was performed. Informed consent was provided by each participant and their parent/guardian if younger than 18. The Human Research Ethics Committee, Queensland Institute of Medical Research, gave ethical approval for the Brisbane Longitudinal Twin Study.
Table 1. The total sample size, number of MZ twins (MZ), Dizygotic Twins (DZ) and non-twin siblings. Percentage of females for each group are reported in brackets.
Measures
IQ subtests
The Multidimensional Aptitude Battery (MAB) is a general intelligence test with multiple-choice answers which is based on the revised Wechsler Adult Intelligence Scale (WAIS-R;Jackson, Citation1984; Wechsler, Citation1981). The five sub-tests used in this study were computer administered and can be grouped into those assessing Verbal IQ: Vocabulary (VOC) – word knowledge, Information (INF) – general knowledge, Arithmetic (ARI) – verbally presented numerical problems requiring mental calculations;, and those assessing Performance IQ: Spatial (SPA) – visualizing 2-dimensional object positions, Object Assembly (OBJ) – arranging segments of objects to make a whole. Test–retest correlations over a 3-month interval were estimated in a subsample (49 twin pairs) and are as follows: Arithmetic and Object Assembly (both .67), Information (.83), Vocabulary and Spatial (.77), and Digit Symbol (.85) as reported by Luciano et al. (Citation2003). From the WAIS-R, the Digit Symbol sub-test was administered in paper-and-pencil format as part of the Brisbane Memory, Attention and Problem Solving (MAPS) protocol, and Digit Span (Forward and Backward) and Letter-Number Sequencing from the WISC-V (Kaufman et al., Citation2015) were collected as part of the Brisbane Adolescent Twin Study (no temporal reliability data were collected).
Elementary cognitive tasks
Inspection Time (IT), a measure of perceptual intake speed, was tested by a line discrimination task as described in Luciano, Smith, et al. (Citation2001). The task required the participant to choose the longer of two vertical lines at increasingly shorter stimulus durations, with accuracy representing the parameter of interest. The Choice Reaction Time (CRT) task was described by Luciano, Wright, et al. (Citation2001); this was also a computerized task and required the participant to press the appropriate computer key in response to the occurrence of one of 2, 4 or 8 choice stimuli as quickly as possible. The participant was given the chance to practise before starting the task to familiarize with the key responses. Then, four-, two-, and eight-choice conditions with 48, 96, and 96 respective trials were presented in that order. The output measure was the mean reaction time (in ms) of correct responses for each choice condition. Test–retest reliability was .74, .65 and .82 for 2-, 4- and 8-choice, respectively (Luciano, Wright, et al., Citation2001), and .69 for IT (Luciano, Smith, et al., Citation2001).
Visuo-spatial working memory
The visuo-spatial WM measure is based on the accuracy (amount of money won) of performance on a computerized visuo-spatial delayed-response (DR) task (Hansell et al., Citation2001). The task is performed on a touch-sensitive computer screen. During the control trials, the participant has to touch a chequered circle appearing on the screen at a pseudo-random position, in the memory trials, the circle disappears after 150 ms and the participant is required to point where it was on the screen during the delay period. During half of the trials, a distractor is presented following target onset, and the participant is instructed to ignore it. Between intervals, participants receive feedback and for more accurate responses a greater monetary reward is granted. Monetary penalties are expected for responses which are too fast (<200 ms), too slow (>1500 ms) or if an incorrect position is given. The overall accuracy index, indicating both correctness of the response and the position displacement, was given by the total amount of money won on the six blocks of 72 trials. Test–retest reliability was low at .51 (Luciano, Wright, et al., Citation2001).
Creative writing
The Queensland Core Skills Test (QCST) is a standardized test which must be sat by all those students aiming to enter tertiary education in their final year of high-school in Queensland (Lazaroo et al., Citation2019). The test assesses students’ higher-order scholastic skills that are taught in a wide range of courses but it is not subject specific (Matters & Gray, Citation1995). The QCST can be considered a valid estimator of academic achievement with historical data from 1992 to 2007 showing a correlation of the QCST of 0.70 − 0.75 with a within-school ranking of students and with their school grades (Queensland Studies Authority, Citation2008). The QCST is composed of four exam papers: a written task, two multiple-choice papers, and a collection of short response questions. Here, we focus on Create and Present (CP) which evaluates a student’s ability to structure and use written language to communicate ideas effectively. It can be seen as an index of expressed creative ability relying on written language skills, consisting of a creative writing task based on visual and/or written stimuli which the subject must use to generate a creative written work.
Reading difficulties classification
Reading ability was measured using the Components of Reading Examination (Bates et al., Citation2004) which required participants to read a list of words and non-words (the latter pronounceable using grapheme–phoneme rules). Words pronounced correctly are summed to create the total score. Because dyslexia is largely characterized by problems with phonological decoding, we used the accuracy on non-word reading to dichotomize the distribution into cases with reading difficulties (<1.5 SD below the mean) versus no difficulties.
Statistical analyses
The dyslexia polygenic score (PGS) for each BATS participant had previously been calculated for use in Doust et al. (Citation2022). Briefly, the participants were genotyped on the Illumina 610k Quad Bead array (Luciano et al., Citation2013) and imputed with the 1000 Genomes Phase 3 panel (v.20101123). The PGS were constructed based on the summary statistics from the large-scale dyslexia genome-wide association study (GWAS) (Doust et al., Citation2022) using PRSice. The dyslexia PGS used in this study used the full set of available independent variants (no P-value selection; 234,676 SNPs).
The data were analyzed with the software R, using the package “lme4” for linear, generalized linear, and nonlinear mixed models (Bates et al., Citation2008). The R script can be found in Supplementary Material. The cognitive outcome scores were first adjusted for variability due to ancestry, age, sex and genotyping imputation run with linear models. Then, the residuals were used for the linear mixed model regression as the outcome variable. Linear mixed models fitted by restricted maximum likelihood were used to analyze the data to consider the nested nature of the twin data. The random effect was family relatedness, but because MZ twins have identical PGS, one MZ twin member was chosen at random for inclusion in the analysis. Two separate analyses, one with reading difficulties (as a proxy of dyslexia) as the predictor, and the second with dyslexia PGS as predictor, were performed, each cognitive measure being the dependent variable of the models (for a total of 30 models). The aim was to determine the variance explained by the PGS and the proxy of dyslexia in the dependent variables and compare the two predictors. The proxy of dyslexia was calculated by coding the z scores of non-word reading below 1.5 SD to 1 and the scores above to 0, where 1 indicates reading difficulties. All the p-values from the models have been adjusted with the Benjamini and Hochberg (Citation1995) false discovery rate (“fdr”) method. We are well-powered (>80%) to detect effects as low as 1.8% at an alpha of .05 for our smallest sample size of 734.
Results
Data screening
Queensland Core Skills Test data were standardized according to the mean and SD of the sample of the corresponding year because the maximum score attainable for each academic factor varies based on the year (Lazaroo et al., Citation2019). All variables were visually screened for normality and outliers. In the Multidimensional Aptitude Battery subscales, outlying scores of 0 (no more than 2 cases identified) were found and set to missing. Inspection Time scores had a negatively skewed distribution and were transformed by a reflected logarithmic function. All other test scores were normally distributed and had no outliers.
Mixed effects modelling
Mixed linear models showed that reading difficulties significantly predicted all cognitive outcomes, except for visuospatial Working Memory (WM) (). The largest effects were for tests of Information, Arithmetic, and Create and Present (r ranged −.21 to −.24), with the lowest prediction for Digit-Backward (−0.08). shows the variance explained by reading difficulties versus dyslexia PGS where phenotypic prediction was significant. As expected, the variance explained by the phenotypic predictor is higher than that explained by the PGS for Information, Arithmetic, Vocabulary, Spatial, Digit Forward and Create and Present. However, for Digit Symbol, Digit Backward and Letter-Number Sequencing the variance explained by the PGS was higher than that explained by the phenotypic predictor. PGS prediction was not significant for the elementary cognitive tasks, the visuospatial WM task, or the Object Assembly subtest of the Multidimensional Aptitude Battery. In , the proportion of phenotypic variance due to genes was calculated by dividing the variance explained by the genotype (i.e., the PGS) by the variance explained by the phenotype (i.e., reading difficulties). Where the genotype explained more variance than the phenotype, we conventionally inserted 100%, as this is the upper limit of variance.
Figure 1. Variance explained in the cognitive test scores by the dyslexia polygenic and reading difficulties phenotypic scores
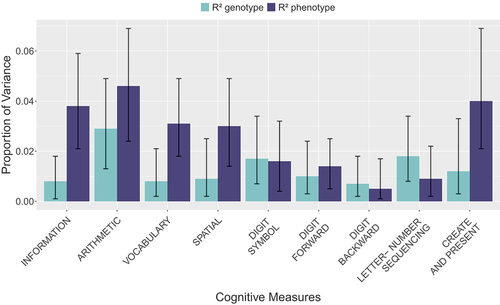
Table 2. Estimates with the associated 95% CI, standard error, the student t and the associated p-value for the fixed effects of the models containing the proxy for dyslexia to the left and the dyslexia PGS to the right.
Table 3. with the associated 95% CI for the significant models grouped by genotype, phenotype, and portion of phenotypic variance explained by the dyslexia phenotype that is due to dyslexia polygenic score.
Discussion
Our study confirmed significant phenotypic associations between poor reading and varied cognitive measures, with the strongest findings for verbal cognitive abilities. Moreover, dyslexia polygenic scores were significantly predictive of these measures, with the exception of elementary cognitive tasks and visuospatial working memory. The largest genetic mediation of the poor reading-lower cognitive test performance association was for working memory (100% for most measures), followed by the arithmetic subtest (63%) which also showed the strongest PGS prediction. The arithmetic subtest in our study is multifactorial in that it taps both verbal and performance abilities (Loehlin et al., Citation2016) and may be better conceptualized as a quantitative reasoning or numerical ability factor (Jacobs & Costello, Citation2013; Loehlin et al., Citation2016). So, our finding may have implications for understanding the co-occurrence of dyslexia and dyscalculia (Rubinsten, Citation2009).
Reading difficulties were associated with lower cognitive test performance on measures of IQ, basic processing speed, and creative writing, in line with previous studies mostly in case–control samples (D’Angiulli & Siegel, Citation2003; Moura et al., Citation2014; Nicolson & Fawcett, Citation1994; Ritchie et al., Citation2013; Sobotka & May, Citation1977). The largest effects were for tests of Information, Arithmetic, and Create and Present with effects comparable to an effect size (Cohen’s d) ranging from 0.43 to 0.49; according to previous literature, they are usually twice as large (in Moura et al., Citation2014 the effect sizes are 1.17 for Arithmetic and 1.18 for Information). The lowest prediction was found for Digit-Backward (r of −0.08), in contrast with previous literature reporting a Cohen’s d of 0.80 (i.e., a correlation of 0.37) (Moura et al., Citation2014). Our phenotypic associations are likely weaker than previous reports because we use a proxy measure of reading difficulties which will be less accurate than a diagnosis of dyslexia. Furthermore, because of selection bias in our volunteer sample, we are likely to be missing the more severe cases of reading difficulties who might be expected to have even lower scores on these cognitive tests.
For most of the cognitive variables, part of the observed association was due to genetic overlap with dyslexia, as supported by significant prediction by the dyslexia PGS. The PGS did not predict speed on elementary cognitive tasks or accuracy on a visuo-spatial working memory task. The variance explained by reading difficulties was in most cases greater than the dyslexia PGS, which was expected given that the phenotypic correlation sets the upper bound for genotypic variance. For Digit Symbol, Digit Backwards and Letter-Number Sequencing, all measures of short term and/or working memory, the PGS explained more variance than it did for the reading difficulties phenotype. This might point to some noise in our proxy measure of dyslexia, which we defined using a subjective cutoff (<1.5 SD below mean) of performance on a standardized nonword reading test. It is important to note that even though the PGS explained more variance than the reading difficulties phenotype, its overall effect on the working memory tasks (Digits Backward and Letter-Number Sequencing) was very small ( = 0.007–0.018). Other variables showed relatively low genetic mediation of the phenotypic association – Create and Present (30%), Information (21.1%), Vocabulary (25.8%), and Spatial (30%) – suggesting that genetic covariance unrelated to dyslexia and/or environmental factors are more important mediators of their associations. Regarding the creativity task (Create and Present), as it relies on written language skills, it might not be a fair task to assess creativity in participants with reading difficulty and it could in future be assessed with a different task.
The association between poor reading and lower performance on the arithmetic subtest was the strongest of those measured and is consistent with literature showing co-occurrence and genetic overlap between mathematics and reading deficits in twin studies (Daucourt et al., Citation2020; Knopik; Alarcón & DeFries, Citation1997; Light & DeFries, Citation1995, Markowiz et al., Citation2005; van Bergen et al., Citation2023). A high genetic correlation (.60) between mathematical and reading difficulties has been reported, and shared genetic factors explained 90% of the phenotypic correlation between mathematical and reading abilities in the sample without reading difficulties (Markowitz et al., Citation2005). Similar strong genetic mediation of reading-mathematics associations has been found by others (Knopik et al., Citation1997; Light & DeFries, Citation1995), and an average genetic correlation of .71 between reading and math (various domains) skill was reported in a meta-analysis of 38 studies including primary to early secondary school students (Daucourt et al., Citation2020). A longitudinal study showed that early reading skills and reading comprehension in the third grade were predictive of problem solving and data interpretation (β = 0.16), with a small but positive effect on mathematical concepts (β = 0.10) and mathematical computation (β = 0.06) (Grimm, Citation2008). The dyslexia PGS association we found with performance on an arithmetic test might therefore reflect a causal effect of reading on mathematical skills or a shared genetic basis between these types of skills; for instance, Rubinsten (Citation2009) linked the co-occurrence of dyslexia and dyscalculia to the involvement of the angular gyrus, a heritable trait (Shen et al., Citation2015). van Bergen et al. (Citation2023) recent study using a longitudinal cross-lagged design of twin families supports shared genetic risk rather than causal processes in the relations between ADHD, dyslexia and dyscalculia.
For visuo-spatial working memory, a negative association was expected based on past results (De Jonge & De Jonge, Citation1996; Swanson et al., Citation2009) but neither phenotypic nor polygenic associations were found. It is possible that the unreliability of the delayed response task performance measure used in this study, and the predominance of specific genetic variance for this measure (that is, unrelated to speed or IQ), limited its validity as a measure of human visuospatial WM (Luciano, Wright, et al., Citation2001). In contrast, the Inspection Time (IT) and Choice Reaction Time (CRT) tasks have been shown to have a genetic structure that maps onto expected specific cognitive abilities (Luciano, Wright, et al., Citation2001). In the present study, IT and CRT showed significant phenotypic associations with poor reading, of similar magnitudes to perceptual speed and working memory IQ subtests, and provide reliable evidence of slower processing speed in those with poor reading. However, this relationship was not mediated by genetic variation that was associated with dyslexia, suggesting that environmental factors mediate this overlap.
The current study is the first to use dyslexia PGS to estimate predictiveness for a range of distinct cognitive abilities. Of most note was 1) the complete genetic mediation of poor reading and short term/working memory measures, which aligns with findings of phonological short-term memory deficits in dyslexics, and which we show here are due to common genetic causes; and 2) the genetic prediction of arithmetic skills which was almost as large as that for reading itself, and indicates a relationship between literacy and numeracy skills that may be largely driven by shared genetic factors. This latter finding should be followed up in samples that have a larger range of math tests available to understand whether the effect is operating at a domain level or is stronger for subdomains of math. The PGS approach, as used here, shows value for cross-trait prediction, but it is important to note that it currently has no practical applications in the field of education due to the small variance explained in the phenotypic traits of interest. Nevertheless, the incorporation of PGS in educational studies and particularly where family data are available can help answer important questions about the influence of gene-environment interplay and genetic nurture on academic skills. A major limitation, though, is the lack of diverse samples for which large GWAS of reading skill/dyslexia are available. Thus, present studies using dyslexia PGS are only generalizable to populations with European genetic ancestry. To increase confidence in our findings, large GWAS of specific cognitive abilities are needed to test whether common SNP variant genetic correlations (estimated using linkage disequilibrium score regression or by genomicSEM) with dyslexia follow the same pattern of genetic overlap that we report here for polygenic scores.
Overall, this paper gives an insight of the relations between a PGS for dyslexia and a diverse set of cognitive abilities, and implicates once more the pronounced genetic overlap between arithmetic and reading ability. Assessments of dyslexia, which include tests of numeracy, ensures that people with weaknesses in both reading and math get support in both areas despite being referred for literacy problems.
Supplementary_Materials.docx
Download MS Word (24 KB)Acknowledgments
We thank the Brisbane MAPS and Adolescent Study twins and their families, the staff on these projects, and the research participants and employees of 23andMe Inc. SEF is supported by the Max Planck Society (Germany). The following members of the 23andMe Research Team contributed to this study: Stella Aslibekyan, Adam Auton, Elizabeth Babalola, Robert K. Bell, Jessica Bielenberg, Jonathan Bowes, Katarzyna Bryc, Ninad S. Chaudhary, Daniella Coker, Sayantan Das, Emily DelloRusso, Sarah L. Elson, Nicholas Eriksson, Teresa Filshtein, Pierre Fontanillas, Will Freyman, Zach Fuller, Chris German, Julie M. Granka, Karl Heilbron, Alejandro Hernandez, Barry Hicks, David A. Hinds, Ethan M. Jewett, Yunxuan Jiang, Katelyn Kukar, Alan Kwong, Yanyu Liang, Keng-Han Lin, Bianca A. Llamas, Matthew H. McIntyre, Steven J. Micheletti, Meghan E. Moreno, Priyanka Nandakumar, Dominique T. Nguyen, Jared O’Connell, Aaron A. Petrakovitz, G. David Poznik, Alexandra Reynoso, Shubham Saini, Morgan Schumacher, Leah Selcer, Anjali J. Shastri, Janie F. Shelton, Jingchunzi Shi, Suyash Shringarpure, Qiaojuan Jane Su, Susana A. Tat, Vinh Tran, Joyce Y. Tung, Xin Wang, Wei Wang, Catherine H. Weldon, Peter Wilton, Corinna D. Wong. SEF is supported by the Max Planck Society (Germany).
Disclosure statement
Pierre Fontanillas and the 23andMe Research Team members are employed by and hold stock or stock options in 23andMe, Inc. All other authors declare no conflicts of interest.
Data availability statement
The full GWAS summary statistics for the 23andMe discovery data set are available through 23andMe to qualified researchers under an agreement with 23andMe that protects the privacy of the 23andMe participants. Datasets will be made available at no cost for academic use. Please visit https://research.23andme.com/collaborate/#dataset-access/ for more information and to apply to access the data. Note that 23andMe participants provided informed consent and volunteered to participate in the research online, under a protocol approved by the external AAHRPP-accredited IRB, Ethical & Independent (E&I) Review Services. As of 2022, E&I Review Services is part of Salus IRB (https://www.versiticlinicaltrials.org/salusirb).
Supplementary material
Supplemental data for this article can be accessed online at https://doi.org/10.1080/10888438.2024.2365697
References
- Alarcón, M., & DeFries, J. C. (1997). Reading performance and general cognitive ability in twins with reading difficulties and control pairs. Personality and Individual Differences, 22(6), 793–803. https://doi.org/10.1016/S0191-8869(96)00267-X
- Andreola, C., Mascheretti, S., Belotti, R., Ogliari, A., Marino, C., Battaglia, M., & Scaini, S. (2021). The heritability of reading and reading-related neurocogni- tive components: A multi-level meta-analysis. Neuroscience & Biobehavioral Reviews, 121, 175–200. https://doi.org/10.1016/j.neubiorev.2020.11.016
- Bates, T. C., Castles, A., Coltheart, M., Gillespie, N., Wright, M., & Martin, N. G. (2004). Behaviour genetic analyses of reading and spelling: A component processes approach. Australian Journal of Psychology, 56(2), 115–126.
- Bates, D., Mächler, M., Bolker, B., & Walker, S. (2008, June). Fitting mixed-effects models using the lme4 package in R. International Meeting of the Psychometric Society, Durham, New Hampshire, USA.
- Beidas, H., Khateb, A., & Breznitz, Z. (2013). The cognitive profile of adult dyslexics and its relation to their reading abilities. Reading and Writing, 26(9), 1487–1515. https://doi.org/10.1007/s11145-013-9428-5
- Benedek, M., Jauk, E., Sommer, M., Arendasy, M., & Neubauer, A. C. (2014). Intelligence, creativity, and cognitive control: The common and differential involvement of executive functions in intelligence and creativity. Intelligence, 46, 73–83. https://doi.org/10.1016/j.intell.2014.05.007
- Benjamini, Y., & Hochberg, Y. (1995). Controlling the false discovery rate: A practical and powerful approach to multiple testing. Journal of the Royal Statistical Society: Series B (Methodological), 57(1), 289–300. https://doi.org/10.1111/j.2517-6161.1995.tb02031.x
- Betjemann, R. S., Willcutt, E. G., Olson, R. K., Keenan, J. M., DeFries, J. C., & Wadsworth, S. J. (2008). Word reading and reading comprehension: Stability, overlap and independence. Reading and Writing, 21(5), 539–558. https://doi.org/10.1007/s11145-007-9076-8
- Bonifacci, P., & Snowling, M. J. (2008). Speed of processing and reading disability: A cross-linguistic investigation of dyslexia and borderline intellectual functioning. Cognition, 107(3), 999–1017. https://doi.org/10.1016/j.cognition.2007.12.006
- Byrne, B., Olson, R. K., Samuelsson, S., Wadsworth, S., Corley, R., DeFries, J. C., & Willcutt, E. (2006). Genetic and environmental influences on early literacy. Journal of Research in Reading, 29(1), 33–49. https://doi.org/10.1111/j.1467-9817.2006.00291.x
- Callens, M., Tops, W., Brysbaert, M., & Paterson, K. (2012). Cognitive profile of students who enter higher education with an indication of dyslexia. PLOS ONE, 7(6), e38081. https://doi.org/10.1371/journal.pone.0038081
- Christopher, M. E., Keenan, J. M., Hulslander, J., DeFries, J. C., Miyake, A., Wadsworth, S. J. & Olson, R. K. (2016). The genetic and environmental etiologies of the relations between cognitive skills and components of reading ability. Journal of Experimental Psychology: General, 145(4), 451. https://doi.org/10.1037/xge0000146
- Court, M. H. (2007). A pharmacogenomics primer. The Journal of Clinical Pharmacology, 47(9), 1087–1103. https://doi.org/10.1177/0091270007303768
- Dale, P. S., Harlaar, N., & Plomin, R. (2005). Telephone testing and teacher assessment of reading skills in 7-year-olds: I. substantial correspondence for a sample of 5544 children and for extremes. Reading and Writing, 18(5), 385–400. https://doi.org/10.1007/s11145-004-8130-z
- D’Angiulli, A., & Siegel, L. S. (2003). Cognitive functioning as measured by the WISC-R: Do children with learning disabilities have distinctive patterns of performance? Journal of Learning Disabilities, 36(1), 48–58. https://doi.org/10.1177/00222194030360010601
- Daucourt, M. C., Erbeli, F., Little, C. W., Haughbrook, R., & Hart, S. A. (2020). A meta-analytical review of the genetic and environmental correlations between reading and attention-deficit/hyperactivity disorder symptoms and reading and math. Scientific Studies of Reading, 24(1), 23–56. https://doi.org/10.1080/10888438.2019.1631827
- De Jonge, P., & De Jong, P. F. (1996). Working memory, intelligence and reading ability in children. Personality and Individual Differences, 21(6), 1007–1020. https://doi.org/10.1016/S0191-8869(96)00161-4
- Doust, C., Fontanillas, P., Eising, E., Gordon, S. D., Wang, Z., Alagöz, G., Molz, B., Aslibekyan, S., Auton, A., Babalola, E., Bell, R. K., Bielenberg, J., Bryc, K., Bullis, E., Coker, D., Partida, G. C., Dhamija, D., Das, S., Elson, S. L., & Fisher, S. E.… Luciano, M. (2022). Discovery of 42 genome-wide significant loci associated with dyslexia. Nature Genetics, 54(11), 1621–1629. https://doi.org/10.1038/s41588-022-01192-y
- Fisher, S. E., & DeFries, J. C. (2002). Developmental dyslexia: Genetic dissection of a complex cognitive trait. Nature Reviews Neuroscience, 3(10), 767–780. https://doi.org/10.1038/nrn936
- Friend, A., Pennington, B. F., Smith, S. D., & Gilger, J. W. (2013). Dyslexia and related communication disorders. In D. Rimoin, R. Pyeritz & B. Korf (Eds.), Emery and rimoin’s principles and practice of medical genetics (pp. 1–22). Elsevier Ltd.
- Gavril, L., Roșan, A., & Szamosközi, Ș. (2021). The role of visual-spatial attention in reading development: A meta-analysis. Cognitive Neuropsychology, 38(6), 387–407. https://doi.org/10.1080/02643294.2022.2043839
- Gialluisi, A., Andlauer, T. F., Mirza-Schreiber, N., Moll, K., Becker, J., Hoffmann, P., Czamara, D., Pourcain, B. S., Honbolygó, F., Tóth, D., Csépe, V., Huguet, G., Chaix, Y., Iannuzzi, S., Demonet, J.-F., Morris, A. P., Hulslander, J., Willcutt, E. G., DeFries, J. C., & Müller-Myhsok, B.… Ludwig, K. U. (2021). Genome-wide association study reveals new insights into the heritability and genetic correlates of developmental dyslexia. Molecular Psychiatry, 26(7), 3004–3017. https://doi.org/10.1038/s41380-020-00898-x
- Gooch, D., Snowling, M. J., & Hulme, C. (2012). Reaction time variability in children with ADHD symptoms and/or dyslexia. Developmental Neuropsychology, 37(5), 453–472. https://doi.org/10.1080/87565641.2011.650809
- Grimm, K. J. (2008). Longitudinal associations between reading and mathematics achievement. Developmental Neuropsychology, 33(3), 410–426. https://doi.org/10.1080/87565640801982486
- Hansell, N. K., Wright, M. J., Geffen, G. M., Geffen, L. B., Smith, G. A., & Martin, N. G. (2001). Genetic influence on ERP slow wave measures of working memory. Behavior Genetics, 31(6), 603–614. https://doi.org/10.1023/A:1013301629521
- Harlaar, N., Spinath, F. M., Dale, P. S., & Plomin, R. (2005). Genetic influences on early word recognition abilities and disabilities: A study of 7-year-old twins. Journal of Child Psychology and Psychiatry, 46(4), 373–384. https://doi.org/10.1111/j.1469-7610.2004.00358.x
- Hatcher, J., Snowling, M. J., & Griffiths, Y. M. (2002). Cognitive assessment of dyslexic students in higher education. British Journal of Educational Psychology, 72(1), 119–133. https://doi.org/10.1348/000709902158801
- Hawke, J. L., Wadsworth, S. J., & DeFries, J. C. (2006). Genetic influences on reading difficulties in boys and girls: The Colorado twin study. Dyslexia, 12(1), 21–29. https://doi.org/10.1002/dys.301
- Haworth, C. M., Kovas, Y., Harlaar, N., Hayiou‐Thomas, M. E., Petrill, S. A., Dale, P. S., & Plomin, R. (2009). Generalist genes and learning disabilities: A multivariate genetic analysis of low performance in reading, mathematics, language and general cognitive ability in a sample of 8000 12‐year‐old twins. Journal of Child Psychology and Psychiatry, 50(10), 1318–1325. https://doi.org/10.1111/j.1469-7610.2009.02114.x
- Jackson, D. N. (1984). MAB, multidimensional aptitude battery: Manual. Research Psychologists Press.
- Jacobs, K. E., & Costello, S. (2013). An initial investigation of an Australian adaptation of the multidimensional aptitude battery—II. The Australian Educational and Developmental Psychologist, 30(1), 84–102. https://doi.org/10.1017/edp.2013.9
- Juhel, J. (1991). Relationships between psychometric intelligence and information-processing speed indexes. European Bulletin of Cognitive Psychology, 11(1), 73–105.
- Kaufman, A. S., Raiford, S. E., & Coalson, D. L. (2015). Intelligent testing with the WISC-V. John Wiley & Sons.
- Knopik, V. S., Alarcón, M., & DeFries, J. C. (1997). Comorbidity of mathematics and reading deficits: Evidence for a genetic etiology. Behavior Genetics, 27(5), 447–453. https://doi.org/10.1023/A:1025622400239
- Kranzler, J. H. (1994). Application of the techniques of mental chronometry to the study of learning disabilities. Personality and Individual Differences, 16(6), 853–859. https://doi.org/10.1016/0191-8869(94)90229-1
- Kremen, W. S., Jacobsen, K. C., Xian, H., Eisen, S. A., Eaves, L. J., Tsuang, M. T., & Lyons, M. J. (2007). Genetics of verbal working memory processes: A twin study of middle-aged men. Neuropsychology, 21(5), 569–580. https://doi.org/10.1037/0894-4105.21.5.569
- Kudo, M. F., Lussier, C. M., & Swanson, H. L. (2015). Reading disabilities in children: A selective meta-analysis of the cognitive literature. Research in Developmental Disabilities, 40, 51–62. https://doi.org/10.1016/j.ridd.2015.01.002
- Laasonen, M., Leppämäki, S., Tani, P., & Hokkanen, L. (2009). Adult dyslexia and attention deficit disorder in Finland—project DyAdd: WAIS-III cognitive profiles. Journal of Learning Disabilities, 42(6), 511–527. https://doi.org/10.1177/0022219409345013
- Lazaroo, N. K., Bates, T. C., Hansell, N. K., Wright, M. J., Martin, N. G., & Luciano, M. (2019). Genetic structure of iq, phonemic decoding skill, and academic achievement. Frontiers in Genetics, 10, 195. https://doi.org/10.3389/fgene.2019.00195
- Light, J. G., & DeFries, J. C. (1995). Comorbidity of reading and mathematics disabilities: Genetic and environmental etiologies. Journal of Learning Disabil- Ities, 28(2), 96–106. https://doi.org/10.1177/002221949502800204
- Light, J. G., Defries, J. C., & Olson, R. K. (1998). Multivariate behavioral genetic analysis of achievement and cognitive measures in reading-disabled and control twin pairs. Human Biology, 70(2), 215–237.
- Loehlin, J. C., Hansell, N. K., Wright, M. J., & Martin, N. G. (2016). Genetic and environmental contributions to cognitive structure in Australian twins: A reappraisal. Intelligence, 59, 24–31. https://doi.org/10.1016/j.intell.2016.05.007
- Luciano, M., Evans, D. M., Hansell, N. K., Medland, S. E., Montgomery, G. W., Martin, N. G., Wright, M. J., & Bates, T. C. (2013). A genome‐wide association study for reading and language abilities in two population cohorts. Genes, Brain and Behavior, 12(6), 645–652. https://doi.org/10.1111/gbb.12053
- Luciano, M., Smith, G. A., Wright, M. J., Geffen, G. M., Geffen, L. B., & Martin, N. G. (2001). On the heritability of inspection time and its covariance with IQ: A twin study. Intelligence, 29(6), 443–457. https://doi.org/10.1016/S0160-2896(01)00071-X
- Luciano, M., Wright, M. J., Geffen, G. M., Geffen, L. B., Smith, G. A., Evans, D. M., & Martin, N. G. (2003). A genetic two-factor model of the covariation among a subset of multidimensional aptitude battery and Wechsler adult intelligence scale—revised subtests. Intelligence, 31(6), 589–605. https://doi.org/10.1016/S0160-2896(03)00057-6
- Luciano, M., Wright, M. J., Smith, G. A., Geffen, G. M., Geffen, L. B., & Martin, N. G. (2001). Genetic covariance among measures of information processing speed, working memory, and IQ. Behavior Genetics, 31(6), 581–592. https://doi.org/10.1023/A:1013397428612
- Majeed, N. M., Hartanto, A., & Tan, J. J. (2021). Developmental dyslexia and creativity: A meta‐analysis. Dyslexia, 27(2), 187–203. https://doi.org/10.1002/dys.1677
- Markowitz, E. M., Willemsen, G., Trumbetta, S. L., van Beijsterveldt, T. C., & Boomsma, D. I. (2005). The etiology of mathematical and reading (dis) ability covariation in a sample of Dutch twins. Twin Research and Human Genetics, 8(6), 585–593. https://doi.org/10.1375/twin.8.6.585
- Matters, G., & Gray, K. (1995). The queensland core skills test: Implications for the mathematical sciences. [Abridged Paper Presented to the National Conference on Assessment in the Mathematical Sciences (2nd: 1993).]. Unicorn (Carlton, Vic), 21(4), 74–89.
- McLean, G. M., Stuart, G. W., Coltheart, V., & Castles, A. (2011). Visual temporal processing in dyslexia and the magnocellular deficit theory: The need for speed? Journal of Experimental Psychology Human Perception and Performance, 37(6). https://doi.org/10.1037/a0024668
- Moura, O., Simoes, M. R., & Pereira, M. (2014). WISC‐III cognitive profiles in children with developmental dyslexia: Specific cognitive disability and diagnostic utility. Dyslexia, 20(1), 19–37. https://doi.org/10.1002/dys.1468
- Nicolson, R. I., & Fawcett, A. J. (1994). Reaction times and dyslexia. The Quarterly Journal of Experimental Psychology Section A, 47(1), 29–48. https://doi.org/10.1080/14640749408401142
- Pham, A. V., & Hasson, R. M. (2014). Verbal and visuospatial working memory as predictors of children’s reading ability. Archives of Clinical Neuropsychology, 29(5), 467–477. https://doi.org/10.1093/arclin/acu024
- Queensland Studies Authority. (2008). Student education profiles: Preparation, distribution, appeals. Available at: https://www.qcaa.qld.edu.au/downloads/publications/qsa_stats_sep_report_07.pdf
- Raskind, W. H., Peter, B., Richards, T., Eckert, M. M., & Berninger, V. W. (2013). The genetics of reading disabilities: From phenotypes to candidate genes. Frontiers in Psychology, 3, 601. https://doi.org/10.3389/fpsyg.2012.00601
- Ritchie, S. J., Luciano, M., Hansell, N. K., Wright, M. J., & Bates, T. C. (2013). The relationship of reading ability to creativity: Positive, not negative associations. Learning and Individual Differences, 26, 171–176. https://doi.org/10.1016/j.lindif.2013.02.009
- Rubinsten, O. (2009). Co-occurrence of developmental disorders: The case of developmental dyscalculia. Cognitive Development, 24(4), 362–370. https://doi.org/10.1016/j.cogdev.2009.09.008
- Shah, P., & Miyake, A. (1996). The separability of working memory resources for spatial thinking and language processing: An individual differences approach. Journal of Experimental Psychology: General, 125(1), 4.
- Shen, K., Doré, V., Rose, S., Fripp, J., McMahon, K. L., De Zubicaray, G. I. & Salvado, O. (2015, March). Heritability analysis of surface-based cortical thickness estimation on a large twin cohort. In S. Ourselin & M. A. Styner (Eds.), Medical Imaging 2015: Image Processing (Vol. 9413, pp. 523–530). SPIE.
- Sobotka, K. R., & May, J. G. (1977). Visual evoked potentials and reaction time in normal and dyslexic children. Psychophysiology, 14(1), 18–24. https://doi.org/10.1111/j.1469-8986.1977.tb01147.x
- Soriano, M., & Miranda, A. (2010). Developmental dyslexia in a transparent orthography: A study of Spanish dyslexic children. In T. E. Scruggs & M. A. Mastropieri (Ed.), Literacy and learning (pp. 95–114). Emerald Group Publishing Limited.
- Stevenson, J. (1991). Which aspects of processing text mediate genetic effects? In B. F. Pennington (Ed.), Reading disabilities (pp. 61–81). Springer.
- Stevenson, J., Graham, P., Fredman, G., & Mcloughli, V. (1987). A twin study of genetic influences on reading and spelling ability and disability. Journal of Child Psychology and Psychiatry, 28(2), 229–247. https://doi.org/10.1111/j.1469-7610.1987.tb00207.x
- Swanson, H. L. (2012). Adults with reading disabilities: Converting a meta-analysis to practice. Journal of Learning Disabilities, 45(1), 17–30. https://doi.org/10.1177/0022219411426856
- Swanson, H. L., & Hsieh, C. J. (2009). Reading disabilities in adults: A selective meta-analysis of the literature. Review of Educational Research, 79(4), 1362–1390. https://doi.org/10.3102/0034654309350931
- Swanson, H. L., & O’Connor, R. (2009). The role of working memory and fluency practice on the reading comprehension of students who are dysfluent readers. Journal of Learning Disabilities, 42(6), 548–575.
- Swanson, H. L., Zheng, X., & Jerman, O. (2009). Working memory, short-term memory, and reading disabilities: A selective meta-analysis of the literature. Journal of Learning Disabilities, 42(3), 260–287. https://doi.org/10.1177/0022219409331958
- Tobia, V., & Marzocchi, G. M. (2014). Cognitive profiles of Italian children with developmental dyslexia. Reading Research Quarterly, 49(4), 437–452. https://doi.org/10.1002/rrq.77
- van Bergen, E., de Zeeuw, E., Hart, S., Boomsma, D., de Geus, E., & Kan, K. J. (2023). Comorbidity and causality among ADHD, dyslexia, and dyscalculia. https://doi.org/10.31234/osf.io/epzgy
- Wainwright, M., Wright, M. J., Geffen, G. M., Geffen, L. B., Luciano, M., & Martin, N. G. (2004). Genetic and environmental sources of covariance between reading tests used in neuropsychological assessment and IQ subtests. Behavior Genetics, 34(4), 365–376. https://doi.org/10.1023/B:BEGE.0000023642.34853.cb
- Wechsler, D. (1981). WAIS-R manual: Wechsler adult intelligence scale-revised. Psychological Corporation.
- Whyte, J., Curry, C., & Hale, D. (1985). Inspection time and intelligence in dyslexic children. Child Psychology & Psychiatry & Allied Disciplines.
- Wright, M., De Geus, E., Ando, J., Luciano, M., Posthuma, D., Ono, Y., Hansell, N., Van Baal, C., Hiraishi, K., Hasegawa, T., Smith, G., Geffen, G., Geffen, L., Kanba, S., Miyake, A., Martin, N., & Boomsma, D. (2001). Genetics of cognition: Outline of a collaborative twin study. Twin Research and Human Genetics, 4(1), 48–56. https://doi.org/10.1375/twin.4.1.48
- Wright, M. J., & Martin, N. G. (2004). Brisbane adolescent twin study: Outline of study methods and research projects. Australian Journal of Psychology, 56(2), 65–78. https://doi.org/10.1080/00049530410001734865