
Abstract
Scientists rely heavily on tree-ring records to better understand climate variability of the past millennium. Tree rings can also be utilized to give students a window into paleoclimate research, the methods scientists use, and the importance of scientific findings. Here, we present five online labs that introduce undergraduate students to the field of dendrochronology. Students learn about foundational tree-ring concepts and are guided to use many of the same tools and strategies as scientists, including exploring important field sites, measuring tree-ring data from those sites, using online paleoclimate databanks, and evaluating climate trends and extremes. The labs have been classroom tested and were modified based on a professional assessment, and faculty and student reviews. Faculty and student surveys and student lab grades show that the majority of students were able to meet the learning goals of the labs. Students reported that they felt they were working as scientists would, and, after completing the labs, that they better understood tree-ring science methods and applications. These materials were developed collaboratively with faculty input from a variety of institutions to have broad appeal and allow for use in a variety of classroom settings.
Purpose and learning goals
Annual tree-ring records from long-lived trees are heavily relied upon to understand climate variability and extremes of the past millennium (Stokes & Smiley, Citation1968) and put recent warming trends into a long-term context (Wilson et al., 2016). From tree-ring records scientists have learned, for example, that places on Earth are undergoing rapid warming (Davi et al., Citation2015; Gou et al., Citation2007), that century-long droughts are possible (Harding & Cook, Citation2012), and that climate can play a role in human migration and cultural collapse (deMenocal, Citation2001; Stahle et al., Citation1998). The foundational concept of tree-ring science is easy to understand: that most trees grow annual rings, and the width of each annual ring is related to environmental conditions (Stokes & Smiley, Citation1968). This makes tree rings a useful tool to teach students about the methods scientists use to understand and visualize climate variability of the past, and about how scientists work to collect and analyze data.
Herein we describe Tree-Ring Expeditions (TREX, https://serc.carleton.edu/trex/index.html), five online labs that introduce students to the field of dendrochronology, or tree-ring science, and guide them to use many of the same tools and strategies used by tree-ring scientists. Students are introduced to foundational concepts and methods of dendrochronology (Lab 1), are guided to generate and use authentic tree-ring data, and learn how this data can be used, for example, to reconstruct streamflow and drought for hundreds of years in the past (Lab 2 and Lab 4). They use tree-ring records to place exact calendar dates on ancestral pueblos in the U.S. Southwest (Lab 3), and learn how scientists reconstruct millennial-length temperature variability in the Northern Hemisphere (Lab 5).
The TREX labs are based on highly-cited tree-ring research that continues to generate citations, and in some cases is foundational for the field. When designing the labs, consideration was given to the geographic location of the study sites in order to appeal to a broad audience. Labs 2, 3, and 4, for example, are based on tree-ring research from the Northeast, Southwest, and West regions of the United States respectively, and Lab 5 focuses on tree-ring sites that span the Northern Hemisphere.
Introducing students to the field of dendrochronology and helping them develop a deeper understanding of how paleoclimate scientists work and evaluate evidence was our primary motivation in designing these labs. After working through the labs, students are expected to:
describe what the science of dendrochronology is and what dendrochronologists typically do in terms of fieldwork and analysis (Lab 1);
explain what types of research sites dendrochronologists look for and why these places give scientists the best chance to reconstruct past climate change (Labs 1–5);
navigate public databanks, and locate datasets and meta-data (Labs 1–5)
generate data, observe trends and extremes, produce graphs, and compare datasets (Labs 2–5);
explain how the analysis of scientific data leads to a deeper understanding of the challenges we face as a society and can be used to help guide policy and decision making (Labs 4–5).
Literature context
Despite an ever-growing body of evidence that links human-caused climate change to an increasing frequency of droughts, floods, extreme weather events and other impacts around the world (Ainsworth et al., Citation2016; IPCC, 2014a, b; Joughin et al., Citation2014; Williams et al., Citation2020), we continue to see significant undergraduate misconceptions about climate change, climate science, (Huxster et al., Citation2015; Kirk et al., Citation2014; Lombardi & Sinatra, Citation2012), and how the scientific community works. Students, our decision makers of tomorrow, not only need to understand the range of climate-related challenges that they face now and in the future, but they also need a baseline understanding of the process of scientific inquiry and the methodology scientists use to obtain and analyze data (Kirk et al., Citation2014).
The field of dendrochronology is ideal to teach students about climate-change science and scientific methods because trees are familiar to students and are ubiquitous in many regions across the US and the world (Food & Agriculture Organization of the United Nations (FAO), 2020). In addition, a pencil-sized tree-ring sample can contain hundreds of annual rings (data points) which are relatively easy for students to evaluate. One sample can be compared to other samples from the same site, providing students the opportunity to learn how to develop and evaluate multiple datasets. In turn, this can be applied to larger scientific discussions about climate variability of the past and the connections between climate, people and ecosystems.
Generating one’s own dataset is an opportunity that is often lacking for undergraduate students (Ledley et al., Citation2008). Key educational reports emphasize the importance of using real and relevant data in classrooms (American Association for the Advancement of Science, Citation1993; Barstow & Geary, Citation2002; National Research Council (NRC), Citation1996, Citation2000) and they emphasize that data-rich investigative activities can motivate learning through harnessing student interest in a particular problem and/or in the data themselves (Manduca & Mogk, Citation2002). Thus, using data that students themselves have generated, from field sites that they have virtually explored, could help them stay motivated as they move on to learn about scientific methodologies, interpretation, and applications. Students can also get a more realistic perception of what geoscientists do, the tools they use, and the broad range of field and lab skills needed to do research.
Many students struggle with building quantitative skills, understanding why these skills are important, and how they are applied to real-word problems (Manduca et al., Citation2008). There are also challenges to incorporating real data in the classroom. A common difficulty instructors face is that scientific data are often not formatted for classroom use, can be too difficult to find, or the dataset descriptions are too narrow and cryptic. These issues make it difficult for instructors to discern if a dataset is relevant for their lessons and can be used effectively in their classrooms (Ledley et al., Citation2008; Sturtevant & Marshall, Citation2009). Despite the fact that there are a remarkable number of publicly available tree-ring records available through The International Tree-Ring Databank (ITRDB) managed by NOAA’s National Centers for Environmental Information, the database is designed for researchers and therefore generally out of reach of classroom instructors and their students. The TREX labs utilize this databank and make it more approachable to students and instructors by guiding them to use the search engine, identify regional tree-ring datasets, and by explaining the data format and measurement unit.
Building on related innovations
The TREX labs build on successful pedagogical strategies that include using local contexts, teaching with scientific data, increasing access to and usability of scientific data and databases, and by creating a space to visualize and interpret such data (Kirk et al., Citation2014; CitationTaber et al., 2012). We modeled the labs on the Interdisciplinary Teaching of Geoscience for a Sustainable Future (InTeGrate) project (Egger et al., Citation2019) and on Earthlabs (Ellins et al., Citation2014), and they were built collaboratively by faculty in the sciences and other disciplines, educational specialists, and evaluation experts across a diversity of institutions.
TREX labs are built around one scientific discipline—dendrochronology—rather than a specific problem or grand challenge facing society (e.g. drought, global warming). These labs guide students through foundational dendrochronological concepts, methods and analyses, by using several impactful and culturally relevant tree-ring studies. Our intent is to also give students a sense of exploration, as tree-ring scientists commonly travel to remote regions around the world in search of long-lived, climate-sensitive trees. Such expeditions are of inherent interest to broad audiences and allow students to make links between field and laboratory elements (Stott et al., Citation2014).
Study population and setting
The TREX labs were tested at a public university with Hispanic Serving Institution designation. In 2019, 61% of students were under-represented minorities, and nearly 30% of students were the first-generation in their family to attend college. Labs were tested and data collected in two introductory classes and two upper-level science classes in the Spring and Fall 2018 semesters. The introductory classes included Introduction to Sustainability, in four different sections and Fundamentals of Earth Science, in two different sections (). The introductory courses ranged from 9 to 22 students and included mainly first-year students and a diversity of majors. These classes included both a lecture and laboratory period and satisfied university laboratory requirements for many non-major students. The labs were run during the three-hour laboratory section of the class, and instructors were given leeway to decide when during the semester to run the labs based on when the materials were most relevant to their course goals. The upper-level classes included Hydrology and Global Climate Change, with 18 and 20 students respectively. The students from these classes were in their junior and senior year and were mainly environmental-science majors. Individual student demographic information was not collected from students.
Table 1. TREX labs and the classes that they were tested in, number of instructors, number of students, type of evaluation/feedback method, and type of instructor feedback.
The labs were also tested, and student feedback collected, during a weekend field course in April 2019 as part of a Partnership in International Research and Education project that focused on tree rings as paleoclimate proxies in the Americas. The field course was not affiliated with any class or with academic credit. This workshop was open to any State University of New York (SUNY) undergraduate student interested in Environmental Science. During this workshop students spent a three-hour lab working through selected materials from TREX Lab 3 and Lab 5. A variety of majors signed up for the field course including students from the sciences and humanities.
Lab overviews, materials, and implementation
In Lab 1, students are introduced to the science of dendrochronology. They learn how nondestructive tree-core samples are obtained and processed (Stokes & Smile,1968), and take a virtual tour of a tree-ring laboratory. They watch videos of two accomplished dendrochronologists who describe their career paths, the role serendipity has played in their careers, and their advice to students interested in pursuing science. Students consider what types of study sites dendrochronologists seek to help them answer questions about how our climate has changed in the past, and they explore tree-ring datasets available from the International Tree-Ring Databank (ITRDB), a public archive of global data.
In Lab 2, students virtually drop into a tree-ring site in Southern New York using 360° imagery in Google Maps. The hemlock trees at the site date back to the 1600s and grow on a rocky slope made of giant sandstone and conglomerate boulders. Because of the rocky terrain and lack of soil buildup to hold moisture, the annual tree rings are very sensitive to changes in growing season climate conditions. Students are asked to observe the ecological conditions of the site and evaluate ring patterns from digital scans of tree cores. They then compare annual growth patterns from several tree-ring samples and are guided to use KNMI Climate Explorer (van Oldenborgh, Citation1999), a powerful, yet easy-to-use, online tool that enables them to graph summer precipitation and compare it to annual tree growth. The trees from this site are some of the best examples of drought-sensitive trees in the U.S. Northeast (Cook, Citation2014). At the end of Lab 2, there are two “Meet the Challenge” final options where students can apply what they have learned to a different region of the world. In option one, students look for forests in state or national parks in the US and then use Climate Explorer to get a better sense of the climate trends and extremes of that region. In option two, students explore a forest growing on an ancient lava bed in Mongolia (Davi et al., Citation2006; Pederson et al., Citation2014), and compare annual growth rings to climate data that they downloaded from Climate Explorer. This challenge can be done in class, assigned as a take home assignment, or used as an assessment.
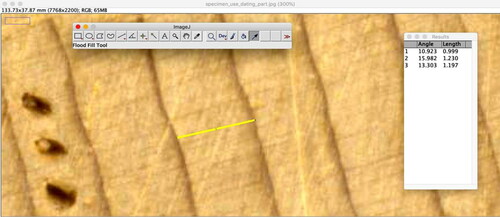
In Lab 3 students learn about the establishment of dendrochronology as a field through its utility in calendar dating historical structures (Douglass, Citation1929). They virtually explore Pueblo Bonito at Chaco Canyon, New Mexico, an ancient ruin that was inhabited between 750 and 1250 CE, and then virtually search the site for samples of wood to analyze. Students use a qualitative method to create a skeleton plot, a graphical representation of ring width (), from the scanned image of a sample of western juniper (Juniperus occidentalis), and use it to compare to a published record to determine the year the tree was felled to build the pueblo. Students also learn how to measure annual tree rings using a public domain image processing program developed by the National Institutes of Health (ImageJ, ). Students produce a graph of their measurements, and compare their work to their classmates. Students then investigate an interactive millennial-scale drought reconstruction produced by tree-ring records (Stahle et al., Citation2009) to identify the existence of megadroughts and extreme years. They also consider if an extreme period of drought could have contributed to the abandonment of the pueblo.
Figure 1. (a) Students learn to date and measure tree rings using a high-resolution scan of an original juniper sample from a pilaster at Pueblo Bonito, Chaco Canyon, New Mexico, that was collected in 1922 by A.E. Douglass and Neil Judd. Students are guided to develop their own “skeleton plot” (b) and compare it to the one pictured here to see if they can determine the year the tree was felled to build the pueblo.
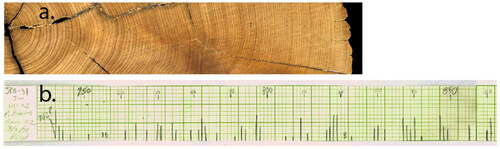
Figure 2. A screen capture showing how student measure annual ring width from a high-resolution scan using ImageJ software. The yellow line shows the measurement of one annual ring, in this case the year 2002. The results tab shows measurements from three rings, starting with the ring with three dots on it, an indicator of a century ring, in this case the year 2000.
Students virtually explore parts of the Colorado River in Lab 4 and learn about how stakeholders draw water from the river to serve the needs of seven western states and Mexico. Students collect data on where the water comes from, who is using the water, and how much is being used. In the second part of the activity, they focus their attention on a tree-ring site in New Mexico and work in small groups to measure tree-ring width using ImageJ on laptops and then compare their results with published tree-ring records from the same sites. Students then evaluate an interactive millennial-length streamflow reconstruction (Meko et al., Citation2007; Woodhouse & Lukas, Citation2006) and are asked to estimate how often major droughts occur.
In Lab 5, students explore some of the remote tree-ring sites that scientists have sampled to develop a better understanding of warming in the Northern Hemisphere over the past 1,000 years (Wilson et al., 2016). They also evaluate tree-ring datasets that are publicly available from the ITRDB and the Paleoclimatology Data Map (, Supplementary material) and research related peer-review publications using Google Scholar. Using an interactive feature, students evaluate a millennial-length Northern Hemisphere temperature reconstruction (Wilson et al., 2016), based in part, on tree-ring records from the sites that they have explored virtually. The lab then guides them to measure data from several of the sites and to research potential causes for some of the extremely narrow rings that they have identified in the record—in this case, many of the extreme years coincide with large-scale volcanic eruptions (Briffa et al., Citation1998).
Putting exact calendar dates on tree-ring samples can be challenging, owing to the tendency for many trees to have missing and/or false rings in certain sections of a sample (Stokes & Smiley, Citation1968). Here we have scanned tree-ring cores at high resolution, from many of the sites that the students have virtually explored, and we pre-marked them, with a dot for each decade, so that students can spend their lab time on generating their own data and interpreting what the ring patterns are telling them rather than marking up samples. Marking and cross-dating tree-ring samples is a basic principle and critical step of tree-ring science, but can take weeks to months to learn to do accurately, and is therefore neither feasible for a typical classroom lab period or two, nor was it intended as a goal of TREX. Still, when critical methodological steps were skipped for the sake of time, such as pre-marking core samples, we described the steps in the text so that students would not get an over-simplified and inaccurate idea of the time and skills required to do the research.
We likewise provided descriptions of some of the mathematics needed to process data. While working though the labs, students were asked to generate tree-ring measurements (Lab 2, 3, 4, 5), develop a simple index (Lab 2), record relative measurements through skeleton plotting (Lab 3) , and interpret graphs and time-series datasets (Labs 2, 3, 4, 5). Though not asked to do calculations themselves, students did read about why higher-order mathematics would be necessary for data analysis (e.g. descriptive statistics, standardization, and regression analysis). Throughout the labs, students were able to work with widely-used and familiar applications, such as spreadsheets to plot data, and to learn how to interpret graphs and time-series datasets. These types of exercises support quantitative skills and help students prepare to enter the workforce by building the skills and competencies desired by the geoscience community (Mosher et al., Citation2014).
The labs are designed to be more challenging with each successive lab and are structured to build methodological and analytical skills as students work through each one. As students work through two or more of the labs, they revisit some of the same skills in multiple contexts, which allows them to build proficiency. Detailed guidance is given each time students are asked to perform a task as each lab is independent of the others.
provides overview information about each lab, including student tasks required for each lab, key questions (which are aligned to the overall learning goals of the labs), datasets used, software, platforms, multi-media, and time requirements needed to run each lab. The TREX website includes instructor guides, answer keys, assessment options, teaching notes and tips, and multimedia background materials. There is also a separate section for students that guides them through the labs and provides downloadable student activity sheets. These activity sheets provide space for students to answer Stop and Think questions at the end of each lab section (), and a space to drag and drop graphs that they have generated and evaluated. The activity sheets can then be graded to determine if the students were able to meet the learning goals.
Table 2. TREX labs, key questions addressed, datasets/multimedia used in each lab, and student tasks (Reproduced with permission from Davi et al., Citation2019).
Table 3. Selected “Stop and Think” questions, aligned to the learning goals, that are embedded within each lab.
We recommend that all students do Lab 1, the introductory lab, and then any of the other labs could be done subsequently depending on instructor interest and course goals. The labs offer a variety of topics, from climate variability, to archeological applications in order to appeal to a wide variety of instructors. We envisioned the labs being used in a variety of undergraduate classes including those on introductory geology, physical geography, environmental science, and sustainability courses, or more advanced courses in research methods, water resources, and climate change. Although each lab was designed so that students could largely go through it as a self-guided exercise, we supply scaffolding for teacher input, class discussions, and data comparison. Instructors are encouraged to walk around the class, or drop into virtual breakout rooms, as students work through the labs and check in with students to make sure that everyone is making progress.
Ideally, these labs are best used in smaller classes (12–30 students) where instructors can check in on student progress and understanding more easily. Students can work in pairs or teams for most activities and when presenting their research results. After each activity, students have the opportunity to discuss and compare their results with the entire class. For instructors and/or students who would like more information about the science, additional resources, references and relevant links are provided at the end of the introductory page of each lab. Labs that are not finished in class could be assigned as homework.
Lab evaluation
Peer review
Prior to classroom testing, the labs were evaluated by graduate and undergraduate student consultants with experience in tree-ring research, through an undergraduate geoscience faculty consultant, through a faculty workshop, and through a faculty assessment team affiliated with the National Association for Geoscience Teachers (NAGT) and The Climate Literacy and Energy Awareness Network (CLEAN). All students and the faculty consultants worked through the labs and provided both written and verbal feedback about lab content, presentation, questions that arose, and ease-of-use of each lab. The faculty workshop, a day-long event held in May 2017, was run by the project PIs and included 24 faculty members from both a community college and a four-year public university. Their disciplines ranged from mathematics, to history, to art, and the geosciences. The main goals of the workshop and evaluations were to assess the clarity of the materials, the ease-of-use of the labs, and the overall impressions from a variety of faculty. After working through Lab 1 as a group and given an overview of all labs, faculty worked through the three sections of Lab 3 and provided feedback using a survey (). Project PIs circulated the room as faculty worked through the labs to take note if there were any questions or comments. Feedback was also provided through a group discussion at the end of the workshop.
Table 4. The survey given to faculty prior to classroom testing, and during the faculty workshop.
The NAGT affiliated reviewers were participants in the 2017 annual Earth Educators Rendezvous “Review Camp” (https://serc.carleton.edu/earth_rendezvous/index.html), where faculty volunteers reviewed collections of submitted teaching activities. Faculty reviewers were instructed to approach each of the five labs as single reviewable unit and to use a scoring rubric to evaluate each lab based on 1) scientific accuracy, 2) alignment of goals, activity, and assessment, 3) pedagogic effectiveness, 4) robustness, and 5) activity description (https://serc.carleton.edu/teachearth/activity_review_rubric.html). Three of the five labs received exemplary scores (Labs 2, 4 and 5) and two received a pass (Labs 1 and 3). The reviewers felt that small changes could elevate all lab’s scores, and these suggestions were subsequently followed.
TREX Labs 1 and 4 were also reviewed by CLEAN’s Review Camp (https://cleanet.org/clean/about/review.html) in 2020. The CLEAN Collection is a digital collection of K–16 teaching resources aligned with the Climate Literacy Framework (U.S. Global Climate Change Program, Citation2009), the Energy Literacy Framework (U.S. Department of Energy, Citation2014), and with Benchmarks for Science Literacy (American Association for the Advancement of Science, Citation1993). Both labs were extensively reviewed for quality and accuracy of scientific content for inclusion in the CLEAN Collection. Labs 2, 3, and 5 are in the queue to be reviewed at the next camp in 2021.
The labs have been modified based on feedback from all assessments. Many of the modifications included grammatical changes, clarification and simplification of the text, more emphasis and/or explanation on the materials that faculty felt would be most relevant for their classes and students (e.g. mapping, exploring, data generation, using Excel, and data interactives), and several modifications related to Diversity, Equity, and Inclusion. Several lab sub-sections that generated low faculty/student interest were removed. Captions were added to all videos to aid hearing impaired students.
Classroom testing
TREX Labs 1 and 2 have been tested in six undergraduate classes, and feedback was collected from students through surveys, lab grades, and from class discussions with instructors (). Classes included four sections of Introduction to Sustainability using a combination of Lab 1 and 2 (Lab 1, Part 1, and Lab 2, Parts 1–3), and also in two sections of Fundamentals of Earth Science (Lab 1 and 2). Labs 3 and 5 were run during the SUNY weekend field course, where student surveys were given, but grades were not collected (). Lab 4 and 5 were also run in two upper-level classes, hydrology and climate change, although in both cases only informal feedback was solicited from instructors guided by the questions asked on the instructor survey shown in . Lab grades were based on completion of each lab task and the Stop and Think questions that accompany each lab section.
Results
Student activity sheet grades () show that the majority of students did well on Labs 1 and 2 scoring an 80% or higher demonstrating that they were able to perform the tasks in each lab and successfully meet the learning goals by answer the Stop and Think questions. From the student surveys collected in class (), our goals were to determine if students were interested in the materials, felt comfortable using the technology, felt that they were learning the materials and were working like tree-ring scientists, and had a better understanding of how the data was applied to real world issues. The surveys showed that most students felt that the labs were easy to navigate (: Q2, Q3, Q7, Q9), and generally had positive feedback about their experience (: Q1, Q2, Q7, Q8). The surveys also showed that students felt that they gained a better understanding about the field of dendrochronology (: Q5, Q8), about how tree-ring records are applied (: Q10), and about the nature of science (: Q4, Q5, Q6, Q8, Q10) as it applied to the field of dendrochronology. Open-ended questions about what parts of the labs worked well and what difficulties students had were included in the surveys, but got a lower response rate than the Likert-scale questions in . Students that did answer these questions provided valuable feedback that is summarized from two Fundamentals of Earth Science classes in and discussed further below.
Figure 3. Stop and Think question grades for Fundamentals of Earth Science (FES) TREX Lab 1. (light blue, n = 18), Lab 2 (orange, n = 9), and for Introduction to Sustainability (SUS) using a combination of Lab 1 (Part 1) and Lab 2 (Part 1-3), Class 1 (grey, n = 16), Class 2 (yellow, n = 22), Class 3 (dark blue, n = 15), and Class 4 (green, n = 18).
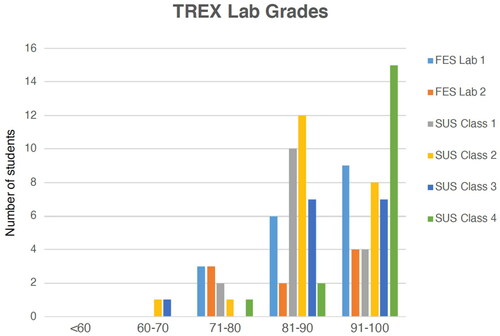
Figure 4. Student survey results for; A. Intro to Sustainability based on a combination of Labs 1 and 2 (n = 71); B. Fundamentals of Earth Science, Lab 1 (n = 18); C. Fundamentals of Earth Science, Lab 2 (n = 9); and D. A combination of Lab 2 and 5 for a two-day field workshop for mixed-majors with two groups of students (n = 33 total).
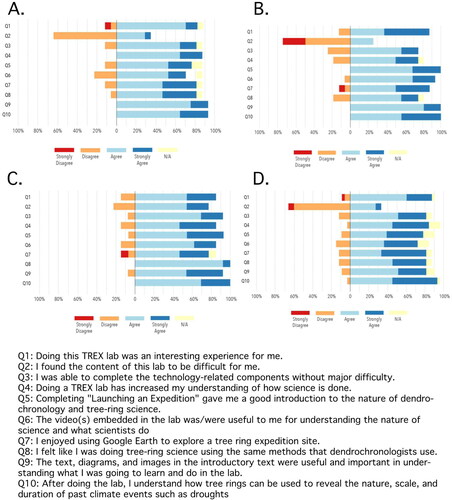
Table 5. Summary of student feedback after completing the TREX Labs 1 and 2 in Fundamentals of Earth Science.
Discussion
TREX engages undergraduate students to learn more about paleoclimate science and the process of scientific inquiry by guiding them to generate and evaluate tree-ring data. To support student learning, we provide virtual exploration, societal relevance and “big-picture” context, visualizations and other interactive media (: Datasets, Software, Platforms, and Media) and guiding Stop and Think questions () where students reflect on what they have learned. To successfully answer these questions, students needed to be able to describe foundational tree-ring concepts, identify datasets from online platforms, and accurately identify trends and extremes within datasets. For example, in Lab 1, students read about the importance of “Site Selection”, a foundational concept in tree-ring based paleoclimate research;
Conducting tree-ring science isn't as simple as it might first appear. The vast majority of trees we see on hikes or while driving will not have captured a good climate record over long periods of time. Dendrochronologists need to search for long-lived trees that grow in fairly harsh environments, making them very sensitive to the surrounding conditions, where their growth is slow— so slow that many years will be recorded in their lifetimes. One such tree is the bristlecone pine, which grows in Arizona, Colorado, New Mexico, Utah, Nevada and eastern California, sometimes under very cold and dry conditions. The oldest known specimen is named Methuselah and is 4,765 years old! You'll have a chance to explore a bristlecone pine site in Part 2 of this lab.
After reading the section, students watched an animation that demonstrates how tree-ring width records from these stressed sites relate to growing-season climate conditions. Site selection is a fundamental concept in dendrochronology that determines the questions scientists are able to answer (Stokes & Smiley, Citation1968). As such, we made it a focus of the beginning of each lab (), where students must virtually drop into a new site and answer questions about site characteristics they observed that could indicate that trees may be stressed and therefore sensitive to climate conditions. Student lab grades show that they were able perform the assigned tasks and successfully answer the Stop and Think questions (). They also reported that the virtual explorations “worked well” () and most students “enjoyed using Google Earth to explore a tree-ring expedition site” (, Q7).
Generating and evaluating data is also an overarching goal of the TREX labs, and there are Stop and Think questions within each lab that are used as a learning assessment of these goals. For example, in Lab 2 students evaluate annual ring patterns over several decades and then compare those patterns to a nearby record of summer precipitation, allowing them to confirm the climate signal in the trees. The Stop and Think questions measure their ability to do this accurately, by having them list the years with the narrowest/widest annual tree rings and describe the relationship between the tree ring and precipitation patterns. Similar tasks are required in subsequent labs, although students also evaluate data that they themselves have generated and they start to evaluate longer, millennial-scale, records of climate variability.
Student and instructor survey feedback
After working through Labs 1 and 2, students from the introductory classes and the field weekend reported that they agreed or strongly agreed that they “felt that they were doing tree-ring science using the same methods that dendrochronologists use” (, Q8), and in the Introduction to Sustainability class and both sections of Fundamentals of Earth Science, all students agreed or strongly agreed that “after doing this lab, I understand how tree rings can be used to reveal the nature, scale, and duration of past climate events such as droughts” (, Q10).
In the open-ended survey questions (), students reported that the videos included in Labs 1 and 2 were parts that they liked best. These videos, entitled “A Brief History of Dendrochronology and “Identifying Climate Sensitive Trees”, demonstrated how scientists take nondestructive samples from living trees using an increment borer (a hand drill) and also included several scientist interviews. Students also reported that they liked working with the time-series interactives, which allowed students to magnify different time periods of the millennial-scale reconstructions. The interactives helped them to more easily view year-to-year variation and evaluate decadal-scale climate trends.
From the open-ended student survey questions, we also learned what students struggled with and liked least. Here, some students reported feeling intimidated by data interpretation, using spreadsheets, and graphing. Given that many of the students in the introductory classes were freshman and came from a variety of majors, they may have had limited prior knowledge and exposure to these types of data-intensive exercises.
From TREX peer-reviews (Text 1, Supplementary material) we learned that the overall concept of dendrochronology was interesting for students and that the labs and structure encouraged students to ask questions. Instructors also liked the progression of the labs from the physical science of dendrochronology in Labs 1 and 2, to the societal connections with the research in Labs 3, 4 and 5. Instructors found the activities to be well scaffolded, so that students were able to build knowledge progressively and then apply their skills to a new study region, such as in the Meet the Challenge section of Lab 2.
Based on our classroom testing of the TREX labs, including student lab grades and feedback from instructor and student discussions and surveys, we feel that the TREX labs have met the intended goals—for students to learn about basic dendrochronological concepts, to generate and evaluate data, and to learn about how tree-ring records are applied and inform decision makers.
Limitations
Surveys
Our ten-question survey was developed to assess if students felt that the labs were navigable, to determine if students felt that they were learning about the science, about the nature of science, and about how the data is applied. We considered switching to validated survey instruments, tools of the burgeoning field of discipline-based education research. However, we found that many of the questions within the validated question sets were outside the scope of the TREX labs. We felt that it would be confusing for students to answer some questions that were relevant to the labs while ignoring questions that were not (pertaining to longer-term summer research programs, for example). Therefore, we continued using the ten-question survey throughout classroom testing for consistency and time constraints, but recognize that validated survey instruments would be useful in measuring student learning outcomes, in addition to surveys and student grades.
Part of how we assessed lab effectiveness was through self-reported survey data from students. Although these types of student surveys are common in evaluating curriculum and provide valuable lab feedback, they do not provide information about why students liked or disliked the labs. For example, our survey instrument did not capture whether students had prior experience working with data or if the website failed to load properly, which could happen with out-of-date web browsers.
Another limitation was that we did not collect lab grades and surveys for all classes that ran the TREX labs (). We only collected lab grades and student surveys in the introductory classes for Labs 1 and 2. Some instructors found that completing the class surveys after running the labs was burdensome because of time constraints and also because students tend to finish the labs at different rates. In this case, we relied on informal discussions with instructors and students’ discussions with their instructors. Instructors were sometimes more detailed in their comments when discussing their experience in person rather than filling out the survey, and we therefore accommodated instructors as much as possible.
Implications
Tips for classroom use and adoption
When running the labs, it is important that instructors not make assumptions about student understanding of graphics and maps within the labs. For example, while running Labs 1 and 2 in the Intro to Sustainability class, some students struggled to interpret color meaning in spatial maps of drought in the Northeastern U.S. In this case, blue indicated areas that were wetter than normal, and red represented areas that were drier than normal (, Supplementary material). The use of these colors for wet/dry regions would be typical for maps representing meteorological information on weather websites or in the news, but the color representations were not necessarily clear for all students, and some students did not speak up about their uncertainty unless asked directly.
Likewise, some students were confused about the meaning of positive and negative values in the time-series drought data (1900–2017) in the Northeastern U.S. (, Supplementary material). In this case, positive values equate to wetter years and negative values equate to drought years. Even though this relationship was described in the lab text, we recommend that instructors check in with students to make sure they understand it before moving on to the interpretation activities. Similarly, reminders about graph meaning are highlighted in the lab text for students and repeated in some cases. Since it is still possible for some to miss these reminders, we also recommend checking in with students as they progress through the labs to make sure that they are interpreting maps and graphs accurately.
When starting activities that ask students to evaluate data, we recommend modeling what to look for (i.e. trends and extremes) using a different but related example. These examples are provided in the main text of the labs. In the introductory classes, students verbally reported that they were more comfortable interpreting data after working through several examples. Within the TREX labs, students are guided to generate and interpret graphs repeatedly, and guidance and answer keys are provided in the instructor guides.
Conclusion
Although outdoor field-experiences are highly motivating for students (Boyle et al., Citation2007) and support geoscience competencies (Kastens et al., Citation2009), these types of experiences are not always available to all students owing to limited resources, time constraints, liability concerns (Semken et al., Citation2017), disabilities (Gilley et al., Citation2015), and more recently, due to the global COVID19 pandemic. In TREX, we created virtual field experiences and guided scientific activities so that a diversity of students, and more students, could participate in authentic tree-ring activities in a classroom setting over several lab periods.
These labs have been extensively reviewed by faculty-peers and have been classroom tested. The TREX labs introduce students to foundational dendrochronological concepts, methods, and analyses, and provide guidance and infrastructure so that students can experience measuring and interpreting paleoclimate data first hand. The labs are based on highly cited and impactful tree-ring research that the scientific community has relied upon to understand climate variability over the past millennium. The labs also guide students to reflect on climate’s impact on human wellbeing and about how paleoclimate data can be used to inform decision making for the future.
Supplemental Material
Download MS Word (11.9 MB)Acknowledgements
Thanks to faculty, staff, and student lab reviewers, and P. Lea, F. Wattenburg, I. Greidanus, C. Manduca, S. Fox, J. Wolfe, R. D’Arrigo, E. Cook, G. Wiles, C. Sinton, R. Wilson, N. Weisemburg, C. Cairns, M. DaSilva, E. Klein, C. Leland, and M. Rao. We also thank the manuscript reviewers and the JGE Associate and C&I Editor. LDEO contribution #8502.
Disclosure statement
No potential conflict of interest was reported by the authors.
Additional information
Funding
References
- Ainsworth, T. D., Heron, S. F., Ortiz, J. C., Mumby, P. J., Grech, A., Ogawa, D., Eakin, C. M., & Leggat, W. (2016). Climate change disables coral bleaching protection on the Great Barrier Reef. Science, 352(6283), 338–342. https://doi.org/https://doi.org/10.1126/science.aac7125
- American Association for the Advancement of Science. (1993). Benchmarks for science literacy (pp. 418). Oxford University Press. https://www.aaas.org/resources/benchmarks-science-literacy
- Barstow, D., & Geary, E. (Eds.) (2002). Blueprint for change: Report from the National Conference on the Revolution in Earth and Space Science Education (pp. 100). TERC.
- Boyle, A., Maguire, S., Martin, A., Milsom, C., Nash, R., Rawlinson, S., Turner, A., Wurthmann, S., & Conchie, S. (2007). Fieldwork is good: The student perception and the affective domain. Journal of Geography in Higher Education, 31(2), 299–317. https://doi.org/https://doi.org/10.1080/03098260601063628
- Briffa, K. R., Jones, P. D., Schweingruber, F. H., & Osborn, T. J. (1998). Influence of volcanic eruptions on Northern Hemisphere summer temperature over the past 600 years. Nature, 393(6684), 450–455. https://doi.org/https://doi.org/10.1038/30943
- Cook, E. R. (2014). The early day of dendrochronology in the Hudson valley of New York: Some reminiscences and reflections. Tree-Ring Research, 70(2), 113–118. https://doi.org/https://doi.org/10.3959/1536-1098-70.2.113
- Davi, N. K., D'Arrigo, R., Jacoby, G. C., Cook, E. R., Anchukaitis, K. J., Nachin, B., Rao, M. P., & Leland, C. (2015). A Central Asian millennial temperature record based on tree rings from Mongolia. Quaternary Science Reviews, 121, 89–97. https://doi.org/https://doi.org/10.1016/j.quascirev.2015.05.020
- Davi, N. K., Jacoby, G. C., Curtis, A. E., & Baatarbileg, N. (2006). Extension of drought records for Central Asia using tree rings: West Central Mongolia. Journal of Climate, 19(2), 288–299. https://doi.org/https://doi.org/10.1175/JCLI3621.1
- Davi, N., Pringle, P., Lockwood, J., Fiondella, F., & Oelkers, R. (2019). Tree-ring expeditions (TREX): Online labs that guide students to think like scientists. Tree-Ring Research, 75(2), 160–166. https://doi.org/https://doi.org/10.3959/1536-1098-75.2.160
- deMenocal, P. B. (2001). Cultural responses to climate change during the late Holocene. Science, 292(5517), 667–673.
- Douglass, A. E. (1929). The secret of the Southwest solved by talkative tree rings. National Geographic Magazine, 56(6), 736–770.
- Egger, A. E., Bruckner, M. Z., Birnbaum, S. J., & Gilbert, L. A. (2019). Developing effective interdisciplinary curricular materials. In D. C. Gosselin, A. E. Egger, and J. J. Taber (Eds.), Interdisciplinary teaching about earth and the environment for a sustainable future. Springer International Publishing.
- Ellins, K. K., Ledley, T. S., Haddad, N., McNeal, K., Gold, A., Lynds, S., & Libarkin, J. (2014). EarthLabs: Supporting teacher professional development to facilitate effective teaching of climate science. Journal of Geoscience Education, 62(3), 330–342. https://doi.org/https://doi.org/10.5408/13-059.1
- Food and Agriculture Organization of the United Nations (FAO). (2020). Global Forest Resources Assessment 2020: Main report. Rome. https://doi.org/https://doi.org/10.4060/ca9825en
- Gilley, B., Atchison, C., Feig, A., & Stokes, A. (2015). Impact of inclusive field trips. Nature Geoscience, 8(8), 579–580. https://doi.org/https://doi.org/10.1038/ngeo2500
- Gou, X., Chen, F., Jacoby, G., Cook, E., Yang, M., Peng, J., & Zhang, Y. (2007). Rapid tree growth with respect to the last 400 years in response to climate warming, northeastern Tibetan Plateau. International Journal of Climatology, 27(11), 1497–1503. https://doi.org/https://doi.org/10.1002/joc.1480
- Harding, R., & Cook, E. (2012). Water resources - How severe will freshwater resource shortages be on a regional scale? PAGES News, 20(1), 38–39. https://doi.org/https://doi.org/10.22498/pages.20.1.38
- Huxster, J. K. X., Uribe-Zarain, X., & Kempton, W. (2015). Undergraduate understanding of climate change: The influences of college major and environmental group membership on survey knowledge scores. The Journal of Environmental Education, 46(3), 149–165. https://doi.org/https://doi.org/10.1080/00958964.2015.1021661
- IPCC. (2014a). Climate change: Impacts. In C. B. Field, V. R. Barros, D. J. Dokken, K. J. Mach, M. D. Mastrandrea, T. E. Bilir, M. Chatterjee, K. L. Ebi, Y. O. Estrada, R. C. Genova, B. Girma, E. S. Kissel, A. N. Levy, S. MacCracken, P. R. Mastrandrea, & L. L. White (Eds.), Adaptation, and vulnerability. part A: Global and sectoral aspects. Contribution of working group II to the fifth assessment report of the intergovernmental panel on climate change (pp. 1–32). Cambridge University Press.
- IPCC. (2014b). Climate change: Mitigation of climate change. In O. Edenhofer, R. Pichs-Madruga, Y. Sokona, E. Farahani, S. Kadner, K. Seyboth, A. Adler, I. Baum, S. Brunner, P. Eickemeier, B. Kriemann, J. Savolainen, S. Schlömer, C. von Stechow, T. Zwickel & J. C. Minx (Eds.), Contribution of Working Group III to the Fifth Assessment Report of the Intergovernmental Panel on Climate Change. Cambridge University Press.
- Joughin, I., Smith, B. E., & Medley, B. (2014). Marine ice sheet collapse potentially under way for the Thwaites Glacier basin, West Antarctica. Science, 344(6185), 735–738. https://doi.org/https://doi.org/10.1126/science.1249055
- Kastens, K. A., Manduca, C. A., Cervato, C., Frodeman, R., Goodwin, C., Liben, L. S., Mogk, D. W., Spangler, T. C., Stillings, N. A., & Titus, S. (2009). How geoscientists think and learn. Eos, 90(31), 265–266. https://doi.org/https://doi.org/10.1029/2009EO310001
- Kirk, K., Gold, A. U., Ledley, T. S., Sullivan, S. B., Manduca, C. A., Mogk, D. W., & Wiese, K. (2014). Undergraduate climate education: motivations, strategies, successes, and support. Journal of Geoscience Education, 62(4), 538–549. https://doi.org/https://doi.org/10.5408/13-054
- Ledley, T. S., Prakash, A., Manduca, C. A., & Fox, S. (2008). Recommendations for making geoscience data accessible and usable in education. Eos, 89(32), 291–291. https://doi.org/https://doi.org/10.1029/2008EO320003
- Lombardi, D., & Sinatra, G. M. (2012). College students’ perceptions about the plausibility of human-induced climate change. Research in Science Education, 42(2), 201–217. https://doi.org/https://doi.org/10.1007/s11165-010-9196-z
- Manduca, C. A., Aer, B., Ancock, G. H., Macdonald, G. H., Patterson, S., Avina, M. S., & Wenner, J. (2008). Making undergraduate geoscience quantitative. Eos, 89(16), 149–150. https://doi.org/https://doi.org/10.1029/2008EO160001
- Manduca, C., Mogk, D. (2002). Using data in undergraduate science classrooms. Final report on an interdisciplinary workshop held at Carleton College. https://serc.carleton.edu/usingdata/index.html
- Meko, D. M., Woodhouse, C. A., Baisan, C. H., Knight, T., Lukas, J. J., Hughes, M. K., & Salzer, M. W. (2007). Medieval drought in the Upper Colorado River Basin. Geophysical Research Letters, 34(10), 1–5. https://doi.org/https://doi.org/10.1029/2007GL029988
- Mosher, S., Bralower, J., Huntiin, J., Lea, P., McConnell, D., Miller, D., Ryan, J., Summa, L., Villalobos, J., White, L. (2014). The future of undergraduate geoscience education, summary report for the summit on the future of undergraduate geoscience education, www.jsg.utexas.edu/events/files/Future_Undergrad_Geoscience_Summit_report.pdf
- National Research Council (NRC). (1996). National Science Education Standards (pp. 262). The National Academies Press.
- National Research Council (NRC). (2000). Inquiry and the National Science Education Standards (pp. 203). The National Academies Press.
- Pederson, N., Hessl, A. E., Baatarbileg, N., Anchukaitis, K. J., & Di Cosmo, N. (2014). Pluvials, droughts, the Mongol Empire, and modern Mongolia. Proceedings of the National Academy of Sciences of the United States of America, 111(12), 4375–4379. https://doi.org/https://doi.org/10.1073/pnas.1318677111
- Semken, S., Geraghty Ward, E., Moosavi, S., & Chinn, P. W. U. (2017). Place-based education in geoscience: theory, research, practice, and assessment. Journal of Geoscience Education, 65(4), 542–562. https://doi.org/https://doi.org/10.5408/17-276.1
- Stahle, D. W., Cleaveland, M. K., Blanton, D. B., Therrell, M. D., & Gay, D. A. (1998). The lost colony and Jamestown droughts. Science (New York, N.Y.), 280(5363), 564–567. https://doi.org/https://doi.org/10.1126/science.280.5363.564
- Stahle, D. W., Cleaveland, M. K., Grissino-Mayer, H., Griffin, R. D., Fye, F. K., Therrell, M. D., Burnette, D. J., Meko, D. M., & Villanueva Diaz, J. (2009). Cool and early-warm season precipitation reconstructions over western New Mexico. Journal of Climate, 22(13), 3729–3750. https://doi.org/https://doi.org/10.1175/2008JCLI2752.1
- Stokes, M. A., & Smiley, T. 1. (1968). An introduction to tree- ring dating. University of Chicago Press.
- Stott, T., Litherland, K., Carmichael, P., & Nuttall, A. M. (2014). Using interactive virtual field guides and linked data in geoscience teaching and learning. In: V. Tong (Eds.), Geoscience research and education. innovations in science education and technology (Vol. 20). Springer.
- Sturtevant, R. A., & Marshall, A. M. (2009). Educator House Call: On-Line Data for Educators’ Needs Assessment Summary Report. NOAA Technical Memorandum GLERL-149: https://www.glerl.noaa.gov/pubs/tech_reports/glerl-149/tm-149.pdf
- Taber, M. R., Ledley, T. S., Lynds, S., Domenico, B., & Dahlman, L. (2012). Geoscience for educational use: Recommendations from scientific/technical and educational communities. Journal of Geoscience Education, 60(3), 249–256. https://doi.org/https://doi.org/10.5408/12-297.1
- U.S. Department of Energy. (2014). Energy literacy: essential principles and fundamental concepts for energy education. 1000 Independence Ave SW Washington, DC 20585. https://www1.eere.energy.gov/education/pdfs/energy_literacy_1_0_high_res.pdf
- U.S. Global Climate Change Program. (2009). Climate Literacy: The Essential Principles of Climate Science. 1717 Pennsylvania Ave., NW Suite 250, Washington D.C., 20006. https://downloads.globalchange.gov/Literacy/climate_literacy_lowres_english.pdf
- van Oldenborgh, G. J. (1999). KNMI Climate Explorer. https://climexp.knmi.nl/start.cgi
- Williams, A. P., Cook, E. R., Smerdon, J. E., Cook, B. I., Abatzoglou, J. T., Bolles, K., Baek, S. H., Badger, A. M., & Livneh, B. (2020). Large contribution from anthropogenic warming to an emerging North American megadrought. Science, 368(6488), 314–318. https://doi.org/https://doi.org/10.1126/science.aaz9600
- Wilson, R., Anchukaitis, K., Briffa, K. R., Büntgen, U., Cook, E., D'Arrigo, R., Davi, N., Esper, J., Frank, D., Gunnarson, B., Hegerl, G., Helama, S., Klesse, S., Krusic, P. J., Linderholm, H. W., Myglan, V., Osborn, T. J., Rydval, M., Schneider, L., Schurer, A., Wiles, G., Zhang, P., & Zorita, E. (2016). Last millennium northern hemisphere summer temperatures from tree rings: Part I: The long term context. Quaternary Science Reviews, 134, 1–18. https://doi.org/https://doi.org/10.1016/j.quascirev.2015.12.005
- Woodhouse, C. A., & Lukas, J. J. (2006). Drought, tree rings and water resource management in Colorado. Canadian Water Resources Journal, 31(4), 297–310. https://doi.org/https://doi.org/10.4296/cwrj3104297