
Abstract
Sequence stratigraphic and Wheeler diagram interpretations require a strong combination of conceptual understanding and diagram reasoning skills. Students are generally exposed to the foundational concepts within sequence stratigraphy (relative sea level, eustasy, base level, and accommodation) in a variety of courses along their degree path, however, one prior study found that few students have a clear scientific conceptual understanding. This study serves two purposes: First, we explore the impact of Wheeler diagram instruction on student learning. Second, we assess students’ common errors on an interpretation task prior to and after Wheeler diagram interpretation. Student conceptual errors are grouped into four categories (fundamental concepts, subaerial erosional unconformities, correlative conformities and sequence identification). In general, student errors were consistent before and after Wheeler diagram instruction. The most common errors related to students identifying the contact between two facies as a stratigraphic or sedimentological feature rather than sedimentary units. Additionally, we provide a set of suggestions for teaching sequence stratigraphy that may help target the common errors and increase student interpretation skill.
Introduction
Sequence stratigraphy is a geologic field of study focused on the depositional order of stratigraphic units and how that relates to the interplay between base level and deposition. Expert geoscientists interpret stratigraphic sequences for a range of geologic contexts such as identifying freshwater (e.g., Campo et al., Citation2020; Houston, Citation2004; Meyer et al., Citation2016) and petroleum reservoirs (e.g., Catuneanu, Citation2006; Sloss, Citation1962; Van Wagoner, Citation1995), the history of continents and their margins (including the reconstruction of sea level; e.g., Brakel et al., Citation2009; Shanley & McCabe, Citation1994), plate tectonic history (e.g., Cheney, Citation1993; Simmons et al., Citation2007; Williams, Citation1993), and paleoclimate studies (e.g., Eberth et al., Citation2001; Fang et al., Citation2017). Historically, employers ranked sequence stratigraphic interpretation skills as important for the petroleum industry (Heath, Citation2000), yet upper-level geology students struggle to explain the core concepts associated with sequence stratigraphy (Herrera & Riggs, Citation2013).
Interpreting sequence stratigraphic diagrams requires a set of skills associated with reasoning about three-dimensional information (Herrera & Riggs, Citation2013; Kreager et al., Citation2022). Wheeler diagrams are widely used in higher education to help students learn how to interpret sequence diagrams and are commonly used by career sequence stratigraphers (Qayyum et al., Citation2012). To accurately complete these diagrammatic interpretations both spatiotemporal reasoning and conceptual understanding of the critical concepts are needed. Deepening understanding of sequence interpretation and the development of interpretation skill would address multiple grand challenges from the Community Framework for Geoscience Education Research (St. John, Citation2018). First, this research develops our understanding of the critical concepts of sequence stratigraphy and how mastering such core concepts may help develop Earth Systems thinking more broadly. These outcomes connect to the first grand challenge of the conceptual understanding of the solid earth theme. Secondly, research that advances understanding of temporal and spatial reasoning in stratigraphy is germane to the grand challenges of understanding which spatial skills are important for specific geologic tasks and determining effective ways to train spatial skills within geoscience courses. Sequence stratigraphy is an ideal vehicle for examining both challenges because it requires students to understand complex concepts (e.g., base level and relative sea level) that include aspects that are both spatially and temporally challenging (Herrera & Riggs, Citation2013). Empirical research on this topic to date has explored the spatial skills associated with interpreting sequence and Wheeler diagrams (Kreager et al., Citation2022). This work identified mental folding and unfolding as an important skill that geoscientists use to make these interpretations.
To date, no studies to our knowledge have explored the impact of Wheeler diagram instruction on students’ interpretation of sequence stratigraphic diagrams. This study investigates the impact using a pre- and post-assessment. We also report novel conceptual errors that emerged and argue that they provide important insights that should guide instruction. Therefore, a second aim of the present study is to document upper-level undergraduate and early graduate students’ pre- and post-instruction conceptual understanding of foundational sedimentary processes as well as the interpretation of sequence and Wheeler diagrams.
Conceptual understanding of sequence stratigraphy
Sequence stratigraphy requires students to think about how river (e.g., sediment load input) and ocean (e.g., changes in base level) processes impact depositional geometries. Therefore, it is important for students to have a strong understanding of the interactions between the lithosphere and hydrosphere. A 1998 review of the literature on student conceptions of the Earth revealed a focus on geologic concepts of the lithosphere (i.e., rocks, the Earth’s structure, landforms, earthquakes, volcanoes, weathering/erosion, and soils) with no focus on the hydrosphere (Dove, Citation1998). In more recent reviews of geoscience conceptions, Cheek (Citation2010) and Francek (Citation2013) included topics associated with the hydrosphere (e.g., groundwater, watersheds, rivers, and the water cycle), geologic time, climate change, glaciers, geologic resources, and karst (Cheek, Citation2010; Francek, Citation2013).
Although few studies focus on undergraduate students (Herrera & Riggs, Citation2013, Myer et al., Citation2018), Cheek (Citation2010) and Francek’s (Citation2013) report two common conceptual errors that could impact how students interpret sequence stratigraphy. First, students have little understanding of sediment movement in rivers (Kirby, Citationn.d.). They may not believe rivers can move rock or sediment to a different location (AAAS, Citation2012). Second, students do not understand how rocks form. Both Dove (Citation1998) and Francek (Citation2013) report some students think that rocks grow either from smaller rocks (Kirby, Citationn.d.; Kusnick, Citation2002). While these conceptual errors are reported for a range of student ages, these conceptions may persist and are able to impact student understanding of the lithification of sediment deposits resulting in sedimentary rocks, a foundational component of sequence stratigraphy.
Herrera and Riggs (Citation2013) assessed senior undergraduate geology majors’ conceptual understanding of key sequence stratigraphic concepts (i.e., base level, relative sea level, eustasy, and accommodation). Herrera and Riggs (Citation2013) found that only one student had an accurate scientific conception of base level, with no students having complete scientific conceptions of relative sea-level or eustasy. In their study, few students thought about relative sea-level as having both spatial and temporal aspects, with 30% of the students attributing relative sea-level to spatial components (e.g., sea-level at a specific location) and 20% to temporal components (e.g., sea level at a specific time or changing over time). Herrera and Riggs (Citation2013) findings provide a baseline of students’ conceptual errors to use in assessing any intervention designed to improve understanding.
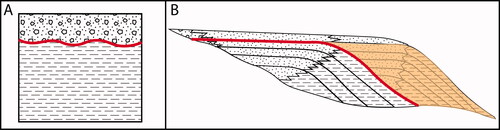
In practice, the spatial relationships in sequence diagrams are more complex than those presented to students in their introductory training. For example, the sequence diagram represents successions of strata that naturally stack vertically and laterally (). Due to the lateral stacking pattern, the sediment is represented as naturally “draped.” The draped strata within the sequence stratigraphic diagram are representations of the geometries of original deposition and are vertically exaggerated as the x- and y-axes have different scales. This representation contrasts with introductory depictions of horizontal strata as vertically stacked based on Steno’s principles () but is similar to the stacking patterns of the “Gilbert” delta (Boggs, Citation2006) which undergraduate students may encounter in sedimentology or similar types of courses. This contrast between introductory and higher-level representations could impact how students initially interpret the youngest and oldest stratigraphic units.
Figure 2. Representations of unconformities, highlighted in red, in introductory (A) and advanced (B) instructional materials. In (A), the unconformity is depicted by a wavy red line between rocks of different lithologies. In (B), the unconformity but must be inferred based on the geometry of the onlapping package of rocks highlighted in yellow.
The challenge presented by draping sediments is additionally important as it may impact students’ interpretations of relative age. Myer and colleagues (2018) conducted a study of undergraduate psychology students and found they tended to group lithologies and determine the relative age of a point based on the lithological unit containing the point. When given two points within the same lithology, it was assumed they were the same age. Further, when given two points in different lithologies, the higher lithology was typically believed to be younger (Myer et al., Citation2018). While at times this thinking may work, in the context of sequence diagrams where age may increase laterally rather than vertically, this may lead to errors in interpretation.
A second challenge contrasting introductory and upper-level learning is how to identify unconformities, or discontinuous surfaces between stratigraphic units or horizons. In introductory courses, unconformities are typically represented with sub-horizontal wavy lines that separate adjacent stratigraphic units (). For sequence interpretation, students must identify unconformities based on the relationships between the stratigraphic units because the traditional wavy lines are not used in sequence diagrams (). For example, the red line in represents an unconformity in a sequence diagram. To identify that unconformity, students would need to look for the leftward-migrating series of truncations of the thin lines separating the curved strata (i.e., an onlapping pattern) in the yellow portion of the diagram.
In the present study, we build on Herrera and Riggs (Citation2013) work evaluating the application of student knowledge in an authentic task. We analyzed the errors being made post-instruction to highlight important concepts that can improve students’ spatial and conceptual understanding of sequence stratigraphy. The research questions guiding the study were: 1) Does Wheeler diagram instruction improve student interpretation of a sequence stratigraphic task? 2) What errors are present in student sequence stratigraphic interpretation before and after Wheeler diagram instruction?
Sequence stratigraphy instruction
Sequence stratigraphy is primarily taught in upper-level undergraduate and graduate courses. Undergraduate courses in sedimentology and/or stratigraphy typically include foundational concepts of base level, relative sea level, eustasy, and accommodation and may introduce students to sequence diagrams. Depending on the institution, universities may offer full-semester graduate-level courses specifically on sequence stratigraphy or include sequence stratigraphy concepts in advanced stratigraphy, petroleum geology, and paleontology courses, among others.
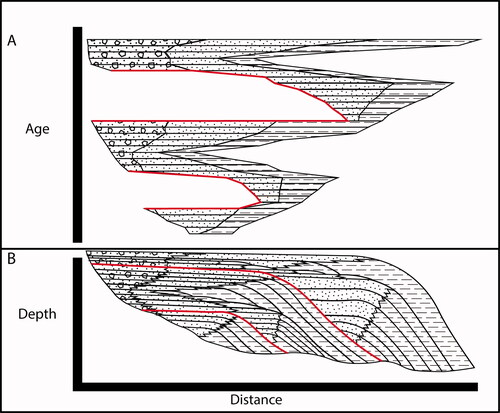
The Society for Sedimentary Geology (SEPM, 2016) suggests five key concepts should be included when teaching sequence stratigraphy: 1) introduction to stratigraphic surfaces and sequence stratigraphy, 2) basics of the Vail et al. (Citation1977) ideal sequence, 3) hierarchies of clastic sequences, 4) mixed clastic and carbonate systems and 5) carbonate systems. The Society also provides suggested materials to be used for each of the key concepts. In this paper we focus on the first concept, introduction to sequence stratigraphic surfaces and sequence stratigraphy, for which the society recommended a chronostratigraphic activity designed by Jerry Baum (SEPM STRAT, 2015). The activity included generating a Wheeler diagram from a sequence diagram. Sequence diagrams are depth versus distance diagrams depicting an idealized cross-section of the “draped” sediments on a continental shelf (). Wheeler diagrams are time versus distance diagrams that correlate to a sequence diagram and/or a 2-D seismic profile and depict the distance in space along the x-axis but with the y-axis representing time (). Expert sequence stratigraphers are likely to complete interpretations on 2-D seismic profiles rather than sequence diagrams as sequence diagrams tend to be used as a stepping tool to the more advanced interpretations. However, Wheeler diagrams provide insights into both spatial and temporal aspects of the subsurface that are important in novice (sequence diagram) and expert (2-D seismic profile) interpretations - Wheeler diagrams are a common tool used in industry to assist in interpreting sequences (Qayyum et al., Citation2012).
Figure 1. Example of a Wheeler diagram (A) and the corresponding sequence diagram (B). (A) depicts straight lines to denote facies boundaries. The vertical position of horizontal strata indicates time, where higher stratal units are younger than lower stratal units in the diagram. The location of features along the x-axis of the diagram indicates their relative spatial position to one another. (B) shows the physical location of packages of sedimentary strata, the surfaces separating those packages, and the predominant lithologies. Zig-zag lines are used to indicate facies boundaries. Gaps between strata in (A) indicate locations and times where sediment was either not deposited or deposited and subsequently eroded within (B).
While there is no consensus on how to teach sequence stratigraphy, the authors experiences and conversations with faculty participating in this study are consistent with concepts and sequence diagrams being taught before Wheeler diagram instruction. Wheeler diagram instruction is often paired with Jerry Baum’s activity or an analog. Although one faculty member contacted for recruitment in this study taught chronostratigraphic concepts and Wheeler diagrams first and subsequently taught sequence stratigraphic concepts and diagrams second (D. Budd, personal communication, 2018), there are no studies assessing which order is more efficient or effective. All the courses participating in the present study utilized what appears to be the predominant teaching practice (i.e., Wheeler diagram instruction after sequence stratigraphy concepts.) Regardless of the order of instruction, interpreting a stratigraphic sequence involves understanding complex spatial diagrams and concepts. An interpretation that requires both a sequence stratigraphic diagram and a Wheeler diagram increases the complexity of the task (Ainsworth, Citation2006).
Methods
This study assessed the impacts of authentic Wheeler diagram instruction on student learning. We defined authentic instruction as the regular classroom instruction used within sequence stratigraphy courses by expert faculty. This study was a one-group pretest-posttest research design conducted at three universities where student learning was assessed with a series of questions that asked students to identify structures and infer processes using a sequence stratigraphic diagram and a Wheeler diagram. The pretest, with consent, was administered in class after the instructors introduced sequence stratigraphy. The regular instructor of the section then carried on with their typical instruction about Wheeler diagrams. Subsequently, the lead author administered a posttest that included an interpretation task, a knowledge measure, and two cognitive tests. The posttest was completed in-class in the same manner as the pretest. The cognitive tests are not reported on here and were used for another study (Kreager et al., Citation2022).
Participant demographics
Participants were recruited from three U.S. institutions, one in the Midwest and two in the Southwest. University 1 is a high research-focused institution (Carnegie Foundation, Citationn.d.) with 58% of the student population identifying as male, 48.2% as White, 19.2% as Black, 21.1% as Latino/Hispanic, 5.9% Asian, 3.9% multiple ethnicities, 1.4% nonresident, 0.1% Native American and 0.1% Native Hawaiian. Participants were enrolled in a graduate-level sequence stratigraphy course (here referred to by the label Section 1). University 2 is a large (high-research; Carnegie Foundation, Citationn.d.) Hispanic-Serving Institution (HSI) with 57.7% of the student population identifying as female, 27% as White, 2.6% as Black, 57.7% as Latino/Hispanic, 1.3% Asian, 2.3% multiple ethnicities, 5.4% nonresident, 2.3% Native American and 0.2% Native Hawaiian. Participants from University 2 were enrolled in an upper-level sedimentology and stratigraphy course (Section 2). University 3 is a large (very-high research; Carnegie Foundation, Citationn.d.) institution with 52.9% of the student population identifying as male, 54.5% as White, 3.3% as Black, 22.5% as Latino/Hispanic, 8.8% Asian, 2.6% multiple ethnicities, 7.2% nonresident, 0.22% Native American and 0.0% Native Hawaiian. Participants were recruited from two sessions (Section 3—Spring 2019 and Section 4—Fall 2019) of the same instructor’s upper-level sedimentology and stratigraphy course. A total of 81 students participated in the study. Sixty-one students were retained after removing those who that either did not consent or did not participate in both days of the study. Overall, the participants were 62.3% White and 54.1% male ().
Table 1. Participant demographics.
Wheeler instruction
Three tenured faculty members, one at each university, taught Wheeler diagrams using their typical instruction. Instructor 1 has over 20 years of college-level teaching experience, and Instructors 2 and 3 each have over ten years of teaching experience. For Section 1, Wheeler diagram instruction took place over several course periods, and the instructor assigned a required homework assignment but no laboratory exercise. For Sections 2-4, Wheeler diagram instruction took place over one lecture and one lab period. The homework assignment (Section 1) and the lab assignment (Sections 2-4) required students to create a Wheeler diagram from a sequence diagram. Three sections (1, 3, & 4) used the same activity from Jerry Baum, (SEPM STRAT, 2015). One section (2) used an instructor-created activity that required similar tasks.
The lectures for Wheeler diagram instruction were audio recorded, and instructors shared their PowerPoint slides with the researchers. Faculty lectures and PowerPoint slides were evaluated to ensure all students received instruction on key concepts and ideas: 1) inclusion of highstand, lowstand, and transgressive systems tracts, 2) base-level change, 3) identification of unconformities, and 4) boundary surfaces for a sequence. All faculty taught students to identify the highstand, lowstand, and transgressive systems tracts. The falling-stage systems tract was discussed in lecture or textbook readings for Sections 1, 3 and 4 but was not included in the interpretation task for this study or the homework/lab assignment. All three faculty discussed base level change at each of the systems tracts and provided instruction on how to identify unconformities on the sequence and Wheeler diagrams. All faculty members defined the subaerial erosional surface (i.e., unconformity) as the bounding surface.
Instruments
Students were given a pretest and a posttest consisting of one geologic task and a knowledge survey.
Interpretation task
The pretest () interpretation task included an idealized sequence diagram similar in style to the diagram found in the activity used by Sections 1, 3, and 4. The posttest () included a different but content-equivalent sequence diagram and its corresponding Wheeler diagram. Both tests asked students to answer the same ten questions, one of which had three parts (e.g., question 6, ). Where possible, jargon was removed from the questions to assess students’ understanding of the concepts rather than familiarity with the terminology. For example, we ask students to identify packages representing low sea level rather than asking them to identify the lowstand systems tract. Removing terminology was not possible in all instances, and terminology such as “base level” and “sequence” were included.
Figure 3. Sequence diagram used in the pretest.
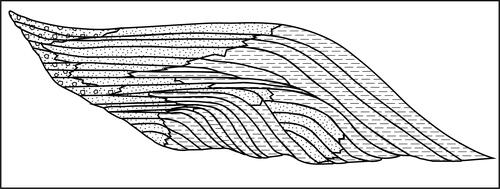
Figure 4. Sequence diagram and corresponding Wheeler diagram used in the posttest.
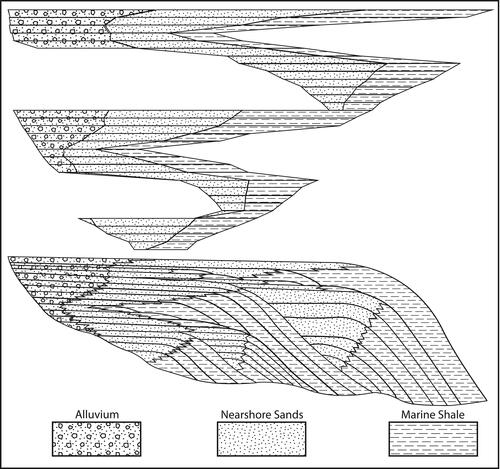
Table 2. Geologic task questions.
There were two styles of questions on the task: identification questions associated with the diagram(s) (1, 2, 3, 6, 6 b, 8, 9, 10) and interpretation questions related to changes in base level (4, 5, 6a, 7). The content of the questions was grouped into four categories: 1) fundamental concepts, 2) subaerial erosional unconformities, 3) correlative conformities, 4) sequence identification. On the posttest, students were instructed to identify the features on both the sequence and corresponding Wheeler diagrams and were allowed only one answer for both diagrams’ interpretations. For example, on Question 4 students were asked how many times base level rose and could only report one number representing both the sequence stratigraphic and Wheeler diagrams.
Two expert geologists reviewed the tests and answer keys to ensure geologic accuracy. Revisions to question language and minor changes to diagrams were made based on expert reviews, and final approval was received from the experts before the implementation. Concurrent to the expert review, pilot data were gathered with graduate students who had taken a sequence stratigraphy course within the last year to assess task readability, resulting in re-wording of questions that were misunderstood.
Both assessments were scored with an expert-generated rubric. The expert-generated rubric provided “correct” lines, units, and answers from the same experts that reviewed the pre- and posttest. Partial credit was developed by the authors and discussed with the experts to ensure it was reflective of varying levels of correct student understanding. Students could receive a maximum of 24 points for each task. The identification questions were awarded partial credit for students who identified only one facies for the stratigraphic units within the right package, identified most of the correct stratigraphic units within the package, or identified the correct strata plus a small portion of additional stratigraphic units. Please see for possible student answers for each question. The interpretation questions received credit for only correct answers; points were not deducted for incorrect answers.
Figure 6. Represents examples of student responses on Q1 (A) and Q2 (B).
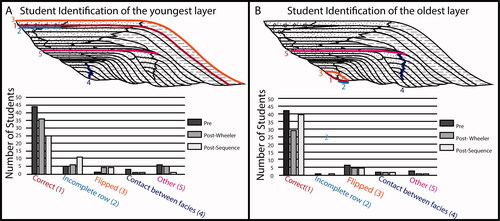
Figure 7. Students labeled the diagram to respond to question 3. Examples of student answers (A) Student answers fell into five general categories (B): Alluvium (correct answer-yellow), Nearshore Sands (partial credit given-orange), Marine Shale (blue), Other (pink), Did not answer (black).
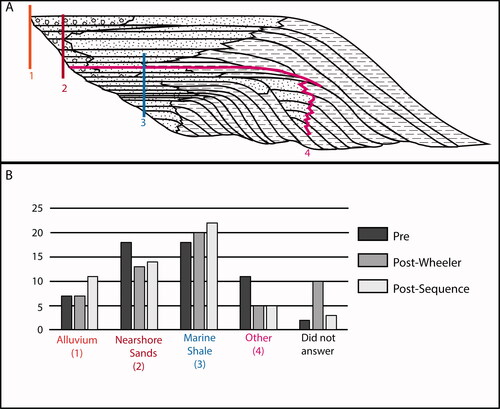
Figure 8. Pretest low sea level answers. The color of each facies represents the number of students who identified that facies as part of a low sea level package. The accurate location of low sea level packages, defined by facies below the continental shelf, is outlined with a thick black line (A). The number of students that highlighted the facies contact rather than a facies (1) or did something else (2, e.g., identifying contact between facies; B).
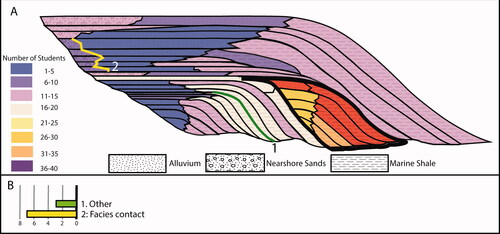
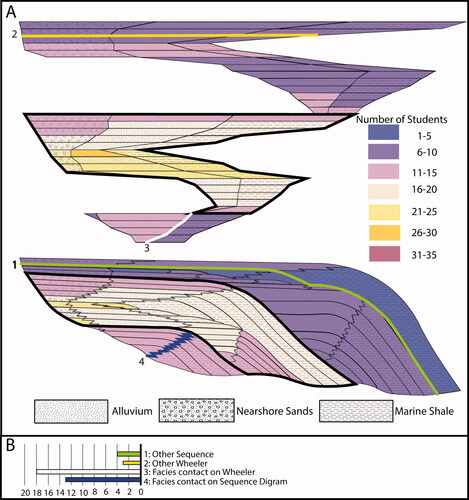
Figure 9. Posttest low sea level answers. The color of each facies represents the number of students who identified that facies as part of a low sea level package, question 8 for the post-assessment (A). Low sea level packages, defined by facies below the continental shelf, are outlined with a thick black line on both the sequence and Wheeler diagram. The number of students that highlighted (1) something other (e.g., identifying contact between stratigraphic units) or a facies contact rather than a facies on the Wheeler diagram or the sequence diagram (B).
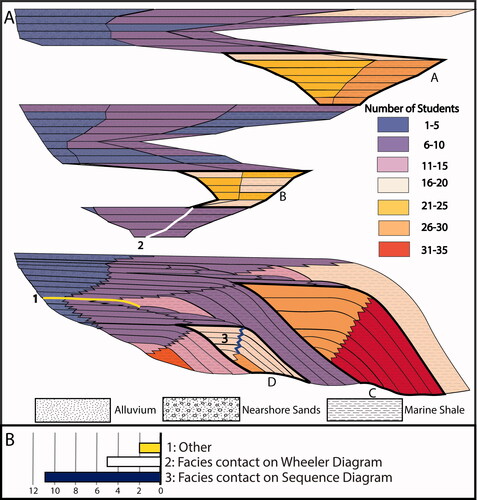
Figure 10. Number of unconformities indicated on the pretest (A) and posttest (B) by each student. The correct number of unconformities is represented by light gray bars.
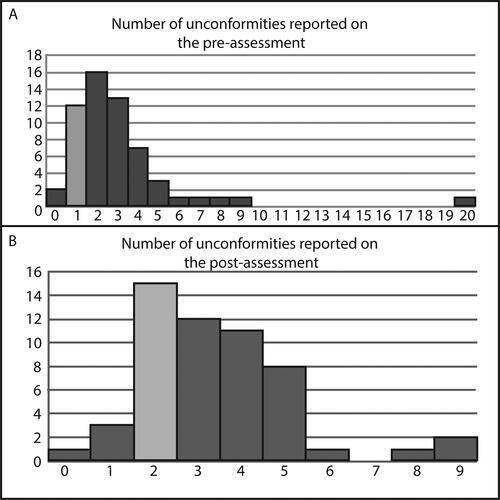
Figure 11. Pretest unconformities. Bar graph representing the number of students who identified a subaerial erosional surface at the stratigraphic unit contact corresponding to each black (incorrect) or gray bar (correct) (A) and the number of students who either selected a facies contact as an erosional surface (2) or did something else (1) (B).
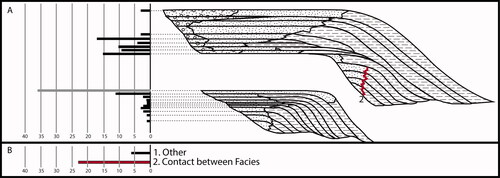
Figure 12. Posttest unconformities. Bar graph representing the number of students who identify a subaerial erosional surface at the stratigraphic unit contact corresponding to each black (incorrect) or gray bar (correct) Wheeler diagram (A), sequence diagram (B), and the number of students who either selected the younger (2) or older (3) hiatus, a facies contact as an erosional on her Wheeler diagram (4) or sequence diagram (5) or did something else (1) (C).
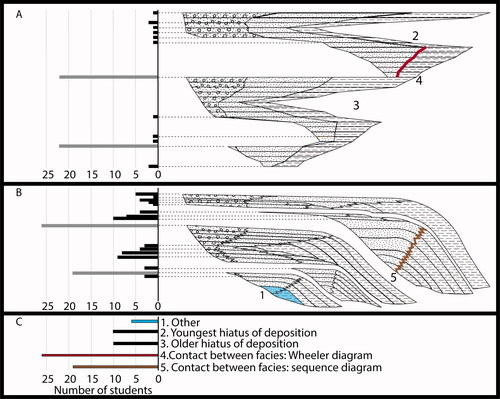
Figure 13. Pretest of correlative conformities. Represents the number of students identifying each facies as a correlative conformity deposited simultaneously with the erosional unconformity surface (A). The expert-identified correct units are outlined in black. The number of students who labeled other representations for correlative conformities (1) or facies boundaries (2; B).
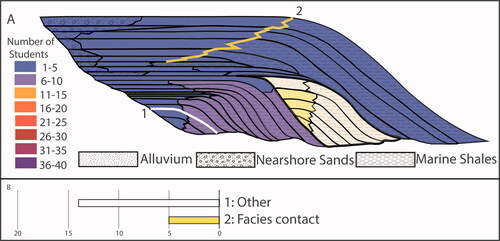
Figure 14. Posttest correlative conformities. The number of students who identified each facies as a conformable unit that was deposited during the simultaneous erosional unconformity surface (A). Correct units are outlined in black. The number of students who did things other than color a facies on the Wheeler diagram (1) and the sequence diagram (2), or who highlighted a facies contact on the Wheeler diagram (3) and the sequence diagram (4; B).
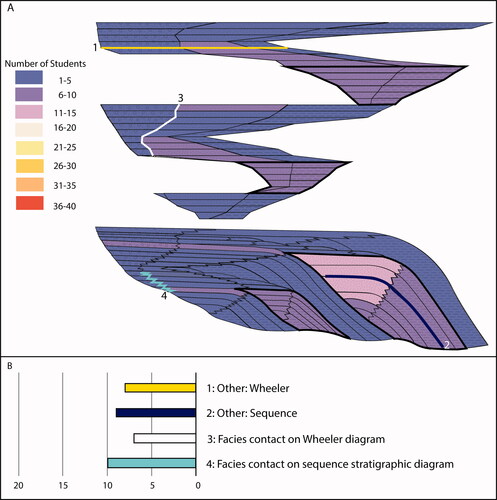
Figure 15. Pretest sequence. The number of students who identified each facies as part of the complete sequence (A). The corrected complete sequence is labeled with a black line. The number of the students who identified the complete sequence in forms other than coloring in facies (1) or by highlighting a facies contact (2) (B).
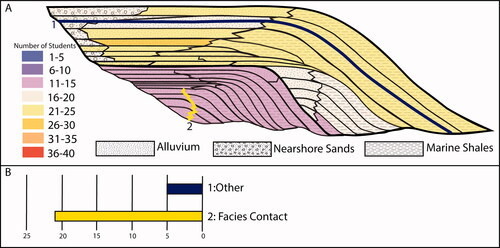
Figure 16. Posttest sequence. Represents the number of students who identified each facies as part of the complete sequence (A). The corrected complete sequence is labeled with a black line, (A). Represents the number of the students who identified the complete sequence in forms other than coloring in facies on the sequence diagram (1) and Wheeler diagram (20) or by highlighting a facies contact on the Wheeler diagram (3) or sequence diagram (4) (B).
An item-level analysis using Cronbach’s alpha assessed the reliability and structure of the pre-assessment. The Cronbach’s alpha indicated that Question 9 reduced the overall alpha value and did not correlate to the overall task. The decreased alpha is likely due to the low numbers of students who received any credit for this question (n = 5 out of 61). The Cronbach’s alpha with Question 9 removed was 0.713, within the acceptable range (0.7-0.9; Tavakol & Dennick, Citation2011), and therefore Question 9 was not included in subsequent analyses.
Knowledge survey
A ten-item measure of sedimentary geology knowledge (Supplemental Material Appendix A) was developed based on conceptual challenges noted in the literature, because no concept inventory on the topic exists. Three questions assessed common conceptual errors documented in Herrera and Riggs (Citation2013) and Cheek (Citation2013). For example, two questions asked students to evaluate the sedimentation rate of stratigraphic units in diagrams, aligning with a conceptual error noted in Cheek (Citation2013). One diagram provided students with stratigraphic units of equal thickness but the time between each unit contact varied. The second diagram provided different thicknesses of stratigraphic units but equal time between each unit contact.
The remaining questions focused on concepts pertinent to the interpretation tasks. The first three questions were multiple choice and probed students’ understanding of definitions (i.e., base level, energy flux, and sedimentation rate). The subsequent questions required students to draw, interpret, or identify features or processes on Wheeler and/or sequence diagrams. For example, one question provided a river profile from head to mouth with a lake along the path and ending in an ocean. Participants were asked to identify where base level could be found along the river profile. The knowledge survey was reviewed by one expert geologist to ensure content and images were accurate. The authors discussed and agreed on a scoring rubric for the knowledge survey. Students did not receive partial credit or have points deducted for incorrect or unanswered questions. Students could score a maximum of 27 points on the knowledge survey.
Data analysis
Students who did not consent and had not completed both the pretest and posttest were removed, and a total of 61 participants were retained. A paired-samples t-test was calculated using SPSS version 26 to determine the impact of Wheeler instruction on student interpretation skill (RQ1).
Student pretest and posttest responses were analyzed for errors (RQ2) using Microsoft Excel. For the interpretation questions, totals reflect the number of students with a correct response. For identification questions, totals reflect the number of students who correctly highlighted a stratigraphic unit, unit contact, or facies contact. Visualizations of the distribution of answers were developed using response density heat maps of the two diagrams and with associated histograms.
Results
Descriptive statistics
Descriptive statistics for each measure are reported in Table S1. Skewness and kurtosis for the pre-post-assessments, fall within the acceptable range of −2 to +2 (George & Mallery, Citation2010). Thus, the assumption of normality is met, and statistical methods were used to evaluate the data. One outlier was removed as their pre-assessment score (M = 4.41 S.D. =2.15) was more than two standard deviations (σ) above the mean (x¯; Table S1).
Wheeler diagram instruction
For RQ1, “Does Wheeler diagram instruction improve student interpretation of a sequence stratigraphic task?”, a paired-samples t-test assessed the significance of the difference between the means of pre- and posttest scores. When comparing student pretest scores (x¯= 4.41, σ = 2.15) to their posttest scores (x¯= 4.70, σ = 2.32), there was no significant difference on student interpretation skill after Wheeler diagram instruction (t(60)= −0.543, p = 0.589). The pretest-posttest scores () showed an equal number of students’ scores increased and decreased (n=26).
Figure 5. (A) Students’ pretest-posttest scores. The gray line represents students who received the same score on their pretest and posttest. Students above this line (yellow) saw an increase in score, and students below this line (red) saw a decrease in score. (B) Pretest score versus the change in score from pretest to posttest demonstrates that students with low pretest scores increased from while those with high pretest scores decreased.
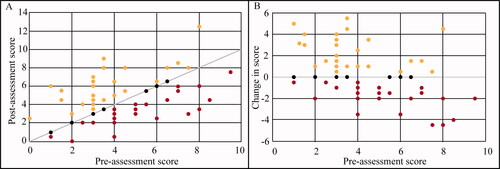
To explore if there is a pattern as to which students’ scores increased and decreased, we evaluated students’ pretest scores vs. their change in score (). In general, low-performing students improved and high-performing students diminished. The uneven pattern of students’ change in scores coupled with the nonsignificant results of the t-test warranted an investigation into student answers at the item-level, which is provided in the following section.
Errors interpreting sequence and Wheeler diagrams
To answer RQ2, “What persistent errors are present in student sequence stratigraphic interpretation before and after Wheeler diagram instruction?”, we evaluated item-level responses for each question for both the pretest and posttest. Assessment questions were grouped into four categories: 1) fundamental concepts, 2) subaerial erosional unconformities, 3) correlative conformities, 4) sequence identification (see for list of questions in each category).
Fundamental concepts
Six questions assessed students’ ability to identify the youngest (Q1) and oldest (Q2) stratigraphic units in a sequence diagram; the farthest inland point of sea level (Q3), base-level rise (Q4) and fall (Q5), and sediment packages representing the lowest sea level (Q8). Questions 1 and 2 assessed if students understood the sequence diagram’s unique stacking patterns (). Student answers fell into five general categories: the correct answer, incomplete row (indicated by students who drew a line across the correct row but did not extend their line to include all facies), flipped (indicated the oldest stratal unit was the youngest), contact between facies, and other (indicated any other stratal unit as the youngest/oldest unit). represents the number of student answers that fell within each grouping for pretest, posttest Wheeler diagram, and posttest sequence diagram for Question 1 (A) and Question 2 (B). On the pretest, 44 students correctly identified the youngest stratal unit and 42 correctly identified the oldest. No more than six students fell within any other category for the pretest when answering Question 1 (nincomplete row=5, nflipped=1, nfacies=4, nother=6) or Question 2 (nincomplete row=1, nflipped=6, nfacies=2, nother=3).
On the posttest, fewer students correctly identified the youngest and oldest stratigraphic unit for the sequence diagram (nyounger=25, nolder=40) and Wheeler diagram (nyounger=36, nolder=29). For Question 1 on the sequence diagram, the most common error was not tracing the whole row on the sequence diagram (nincomplete row=11, nflipped=4, nfacies=1, nother=1) and Wheeler diagram (nincomplete row=6, nflipped=4, nfacies=1, nother=1). On Question 2, the most common incorrect answer was highlighting the bottom of the facies rather than the top (nincomplete row=0, nflipped=4, nfacies=2, nother=1) and Wheeler diagram (nincomplete row=1, nflipped=4, nfacies=2, nother=1).
For Question 3, students identified the farthest inland point of sea level, which assessed if they understood the location of shore versus deep water on the diagrams. Experts constructing the scoring rubric for the task determined the yellow line at the left-most position of alluvium was the correct answer worthy of full credit (). Students received partial credit for selecting nearshore sands (red line) and no credit was awarded for any other answer. On the pretest, a few students selected the correct answer (n = 6), and equal numbers of students favored nearshore sands (n = 17) and marine shales (n = 17). Additionally, 11 students identified the farthest inland point by tracing a vertical surface (i.e., the contact between two stratal units) or a horizontal facies contact, represented by the pink and purple lines in , respectively. On the posttest, few students selected the correct package, the alluvium (npost-sequence =11 npost-Wheeler =7). More students incorrectly identified the marine shale in the post-assessment (npost-sequence=22, npost-Wheeler=20). Five fewer students selected a surface or facies contact on the post-assessment.
The final question in this category (Q8) asked students to identify packages representing low sea levels by labeling the pretest sequence diagram () or the posttest sequence and Wheeler diagrams (). The correct package (outlined in black) is made up of 10 facies on the pretest. For example, in the oldest stratigraphic unit has two facies, nearshore sands and marine shales. Students could identify as few as one facies within the package as representing low sea levels or identify all correct facies. Since not all students selected every facies within the package, we report the number of students who received full credit, partial credit, or identified at least one facies within the correct package but received no credit. and report this data as a heat map (i.e., frequency map) to convey how often participants selected particular facies.
At least one student identified each type of facies as low sea level. Ten students received full credit for identifying all the stratigraphic units within the correct package. Sixteen students received partial credit for not selecting the entire package, and 11 students did not receive any credit selected the correct facies but also selected other facies. Few students made the common errors of highlighting a facies contact (n = 7) or doing something else (n = 3).
On the posttest, students had to label low sea level packages within each diagram (). Nine students correctly identified all four packages, and most students received partial credit (n = 29). Fewer students made the error of highlighting a facies contact on the posttest Wheeler diagram (n = 5) than on the pretest and posttest sequence diagram (n = 11). While many students received credit for identifying areas of low sea level (npre=26, npost=38), few students could accurately report the number of times base level rose (npre=15, npost=11) and fell (npre=6 pre, npost=10)
Subaerial erosional unconformities
Questions 6 and 7 assessed the number of unconformities present in the diagrams. For Question 6, students highlighted the surfaces where they thought unconformities existed. For Question 7, they had to determine and report a single number of unconformities present in the diagram(s). On the pretest, 12 students correctly reported one erosional unconformity on question 7. Forty-four students reported more unconformities than present, and only two students stated that there were no unconformities (). On the posttest, 15 students correctly reported two unconformities present (). Thirty-five students reported greater than two uniformities, while four students identified one or no unconformities on the posttest ().
On the pretest, 36 students labeled the correct surface for the unconformity in Question 6 (). Eighteen students selected the correct unconformity but did not receive credit because they also selected multiple incorrect unconformities, and 15 received partial credit because they highlighted most but not all of the line for the unconformity, and only three students received full credit. The most common errors were selecting no correct unconformities and only incorrect facies as unconformities (n = 38), highlighting facies contacts (n = 23) as unconformities, and labeling vertical lines or coloring in facies (n = 6, referred to as “other” in ). On the posttest, there were four correct subaerial unconformities, two on each diagram (). Four students received full credit on the posttest for Question 6, and 24 received partial credit for identify some of the four unconformities. Common errors on the posttest included students labeling the two white areas that represent depositional hiatus, rather than subaerial erosion, as subaerial unconformities (n = 10; , 2 and 3), labeling facies contacts as unconformities (npost-Wheeler=27, npost-sequence=28) and labeling something else (n = 7).
Correlative conformities
Within the sequence diagram, the stratigraphic units that are deposited during periods of low sea level, outlined in black on and , are deposited simultaneously with a period of non-deposition or erosion. The stratigraphic units that correlate to formation of the unconformity surface are referred to as conformable units. The lower boundary of those units (i.e., the continuation of the boundary making up the unconformity) is called a correlative conformity. The correlative conformity is important as it indicates the end of the subaerial erosion and the beginning of new strata within the above-lying sequence. Identifying correlative conformities in outcrops is challenging and has led to stratigraphic controversies (Hunt & Tucker, Citation1992; Posamentier & Allen, Citation1999; Catuneanu, Citation2002). To assess this challenging skill, we asked students to identify the conformable units that represent depositions during the formation of the subaerial unconformity. In addition to highlighting the position of the unconformity for Question 6, there were two additional sub-questions asking students if the diagram contained conformable units (6 subQa) and, if so, to label the conformable units on the diagram (6 subQb). As this question is tied to students’ understanding of unconformities, we first present the overall results of student responses to Question 6 and then focus the results of the diagrams 6 subQa and 6 subQb on the students who received credit for Question 6 (i.e., identifying unconformities). Almost two-thirds of the students answered that conformable units existed on 6 subQa of the pretest (n = 36) and posttest (n = 37). The remaining students either did not answer the question (npre=7, npost=7) or answered “no” (npre=17, npost= 16). Forty-six students had consistent answers on the pretest and posttest.
The conformable units are outlined with a thick black line in and . Only students who answered “yes” on 6 subQa (npre=36 npost=37) are included in and to visualize the horizons students felt represented conformable surfaces. Some students correctly identified the package and received full credit (n = 8, four of which received credit for Question 6), but most did not receive credit (n = 10) or only received partial credit (n = 2, 1 of which received credit for Question 6) on the pretest. Common errors on the pretest include cases where students did not color in stratigraphic units (e.g., highlighting a stratigraphic unit contact; n = 14) or highlighted the horizontal facies contact (n = 5). On the posttest, few students received full credit for this question (n = 4, two of which received credit for Question 6). Six fewer students on the posttest identified at least one facies within the correct package but did not receive credit (n = 4) and two more students received partial credit (n = 4), all of whom received credit for Question 6). Fewer students on the posttest selected something other than a facies on the posttest (npost-sequence=7, npost-Wheeler=6) than the pretest. In comparison, more students made the error of highlighted facies boundaries (npost-sequence=6, npost-Wheeler=10).
Sequence identification
For Question 10, students were asked to identify a full transgressive-regressive sequence. The full sequence is bounded by unconformity surfaces and is outlined in a thick black line in and . No students received full credit and correctly identified the whole sequence, though 20 students on the pretest () and 23 on the posttest received partial credit (). Only a few students made the error of highlighting something other than a facies on the pretest and posttest (npre=5, npost-Wheeler=4, npost-sequence=3). Notably, many students made the error of highlighting a facies boundaries on both the pretest and posttest (npre=21, npost-Wheeler=13, npost-sequence=13; ).
Discussion
This study assessed the impact of Wheeler diagram instruction on students’ interpretation skills and conceptual understanding of various topics in sequence stratigraphy. The Wheeler diagram instruction did not improve all students’ interpretation skills so we focus the majority of this discussion on the potential causes for students’ most common interpretation errors.
Impact of Wheeler diagram instruction on student learning
There was no significant difference in student scores from pretest to posttest in this study. The apparently minimal impact of Wheeler diagram instruction on students’ interpretation skill was surprising considering that increased instruction time is generally linked to increased student learning (Andersen et al., Citation2016) and Wheeler diagrams make features, such as unconformities, easier to visualize (Qayyum et al., Citation2012). Upon further investigation of individual students’ change in score from pretest to posttest, we found that Wheeler diagram instruction helped low-performing students and appeared to hurt high-performing students. This finding raised the question: Is there an intervening variable causing this pattern in students’ performance?
Since we collected spatial measures for a parallel study (Kreager et al., Citation2022), we ran a linear regression using R via RStudio to determine if disembedding and/or mental folding/unfolding predicted students’ change in interpretation score. Disembedding skill (R2=0.03, F (1, 58) =1.81, p = 0.18) and mental folding and unfolding skill (R2=0.01, F(1, 58) =0.72, p = 0.39) did not significantly predict students’ change in interpreting score, indicating that neither skill contributed meaningfully to the pattern we observed. An alternative explanation is that the inverse relationship between pretest and change scores was caused by reduced effort on the posttest by high performers or a confounding variable, such as item difficulty. However, it is unclear why we did not see the same pattern of decreased effort from low-performing students. An alternative explanation is that there is something about the Wheeler diagram or the associated instruction that confused the high-performing students. Low-performing students gained points on fundamental questions, while the high-performing students lost points on more complex questions (e.g., 6 subQa and 6 subQb). It is likely that a combination of these factors played a role in the unusual pattern from pretest to posttest.
Interpreting sequence and Wheeler diagrams
The second portion of this study focused on individual answers to each of the 10 questions on the pretest and posttest. Students generally did well on the fundamental questions meaning that they were able to understand the basic components of each diagram (e.g., identifying youngest and oldest layers, locating shore line). These fundamental concepts are likely reinforced in many geology courses starting with an introductory course, where students learn the law of superposition and/or correlation between grain size and water depth during deposition.
Despite these successes, common student conceptual errors emerged on the pretest and posttest. Four errors were most common:
Students identified more unconformities than present.
Students identified facies boundaries as representative of unconformities and sequence boundaries.
Students struggled to identify a complete sequence.
Students could not identify conformable units.
Identifying unconformities is key to sequence stratigraphic interpretation as most models bound their sequence by subaerial erosional surfaces and the correlative conformities (Catuneanu et al., Citation2009). Despite this, only about half of the students correctly identified at least one unconformity in the sequences; less than a quarter of the students identified the correct number of unconformities in either the pretest or posttest (error #1). In a previous study by Burton and Mattietti (Citation2011), students were found to have low confidence yet high accuracy in identifying unconformities with introductory level symbols (). The visual representation of an unconformity in sequence stratigraphic diagrams starkly contrasts with representations used in introductory diagrams and may be one reason students have difficulty identifying unconformities in this study. In addition, sequence stratigraphic diagrams utilize a zig-zagged line to represent the transition between facies. The similarity in the symbol may be confusing students (error #2). Consistent with Qayyum et al. (Citation2012), we found that more students correctly identified unconformities on the posttest Wheeler diagram compared to the pretest or posttest sequence diagram. It is possible that either the additional instruction or the white space on the Wheeler diagram improved students’ ability to identify the feature.
The third conceptual error was students’ inability to identify a full sequence. Students were likely exposed to few examples (< 3-5) of a sequence prior to this study. For several students, the pretest was the first time they were asked to complete a full interpretation of a sequence diagram. Engaging students in more examples (Alcalde et al., Citation2017) and opportunities to practice retrieving conceptual knowledge while completing sequence interpretations (Roediger & Karpicke, Citation2006) would likely increase student performance on this task. Additionally, it is possible that students use two strategies to interpret the full sequence: 1) identify one set of sea-level rise and fall or 2) highlight the areas between two unconformities. Students who utilized the second strategy and had errors identifying unconformities on the diagram would then choose the wrong facies packages to be included in the full sequence.
The final common error (#4) was students’ inability to identify conformable units. One-third of the students responded that conformable units did not exist in the diagram, suggesting that they either have no conception of conformable units or expect them to appear differently on a sequence diagram. Conformable units are a key concept for sequence stratigraphy and errors identifying them may be related to students’ errors identifying unconformities. Herrera and Riggs (Citation2013) observed that undergraduate students struggled with base level and eustasy concepts, which underpins the concept of correlative conformities. Since this concept is associated with sequence diagrams, this is the first time students would encounter correlative conformities in their geologic training. Providing a third option, “I do not know,” would have helped parse out if this was an error or if students simply did not know the concept.
Beyond the factors mentioned above, three other confounds may be at play: low effort, lack of practice, and multiple interpretations of the maximum flooding surface. This study was done during class time and all students regardless of consent completed the assignment. However, no credit was given for completion of the task nor success in the study and this may have contributed to low effort. Despite having just completed lecture and lab time focused on this content, lack of practice with multiple examples may have hindered students’ success. Students must have completed both the pretest and posttest to be included in this study, but attendance of lectures and labs was not taken, and there is potential that some students may not have received the Wheeler diagram instruction. Finally, none of the diagrams in this study included a label for a clear maximum flooding surface. Not including the maximum flooding surface may have prevented some students from being able to provide a successful interpretation.
Temporal reasoning
An important consideration for this study is the overlap of temporal reasoning with spatial skill. This study might have benefited from the inclusion of questions that assessed students’ interpretation of relative age, such as those from Myer et al. (Citation2018). It is common in sequence stratigraphic diagrams for younger layers to have a maximum vertical placement that is lower than older stratigraphic units. Assessing how students interpret age within the sequences may have provided a better understanding of how students interpreted the diagrams. Finally, it is important to note that understanding the relationship between the geosciences and temporal reasoning is an important goal of the GER community (St. John, Citation2018). The inclusion of items modeled after Cheek (Citation2013) and Myer et al. (Citation2018) provides a future direction for assessing temporal reasoning for sequence stratigraphy and developing a geoscience-specific, temporal reasoning measures within the GER community.
Suggestions for teaching and future work
This study describes student conceptual errors that impact their success interpreting stratigraphic sequences. It is important to consider these errors when developing instruction on sequence stratigraphic and Wheeler diagrams. Here we provide a list of suggestions for consideration.
Model for students how to decipher each diagram individually. It is important to make sure students understand the symbols, axes, and unique features of each diagram separately before being able to interpret across both diagrams, for example, discussing that the zig-zag or squiggled lines in the sequence diagram represent the interfingering of facies boundaries. Connecting or distinguishing features from previous representations is also important as students may confuse the zig-zag of the facies boundary with the introductory-level symbol for unconformities.
Focus on alignment of the two diagrams (Ainsworth, Citation2006). Students were instructed that the two diagrams represent the same strata, yet students did not answer the same way on the sequence stratigraphic and Wheeler diagrams. An increased focus on how the two align and how the representation of stratigraphic units, surfaces, packages, and unconformities differ between the two may increase students’ ability to work between the diagrams. Additionally, including multiple cases is important. Making sure to highlight the individual surfaces and packages within each diagram is important, but showing this comparison in multiple diagrams will help student extract commonalities that signal key features such as unconformities.
Utilize web programs such as Sedpak or STRATA. These programs allow students to adjust variables and observe changes in patterns. These can provide inquiry-based activities where students see firsthand how changes in variables impact the subsurface geometries. Addition of paleontological data via BIOSTRATA can also be used to help integrate a range of data to help with sequence stratigraphic interpretations (Herrmann, Citation2007).
Provide a discussion on the limitations of superposition. Superposition, though an important concept for relative dating and rock correlation, does not work in every depositional environment and overall scales. Clear discussion of environments such as “Gilbert deltas” can help students identify when and how to use superposition. Finally, a discussion of how superposition works over varying scales is also important. In sequence stratigraphy the superposition works within small areas, but as you extend into larger scales, the concept breaks down.
Reinforce the concept of a facies. This is a key concept for sequence stratigraphy. Students are asked to make interpretations along the x-axis, including the transition of facies within a stratigraphic unit. Understanding what a facies is, how geologists represent them, and how they transition can be key to students’ increased interpretation skill.
Considering the pervasive use of Wheeler diagrams by instructors, future work should explore other variables that might impact students’ learning to better understand why Wheeler diagrams may help some students and hurt others. The order of concepts for sequence stratigraphy instruction should be assessed to see if teaching Wheeler diagrams and the concept of chronostratigraphy first improves students’ comprehension of stratigraphic concepts.
Future work on student conceptual understanding should investigate the errors identified in this study using qualitative methods to better understand why students are making these errors. Since understanding of unconformities underlies many aspects of interpretation (e.g., conformable units, correlative conformities, and a full sequence), these are a high-value starting point for future studies of how to better support stratigraphy education.
The diagrammatic representations in this study are designed to aid students in interpreting seismic profiles and to think about the structure of the stratal units of a stratigraphic sequence. One unanswered question is, how do these diagrams impact students’ field interpretations? Most importantly, how do instructors support students’ transference from diagram to the field? Providing side by side images of outcrops and corresponding sequence diagrams may be one way to do this, though, research would be needed to support this idea.
Limitations
There are three pertinent limitations to this study. First, the study used three instructors who taught the sequence stratigraphic content based on their own preferences. To minimize this limitation faculty lectures were audio recorded and all materials were collected for review. This review showed that all faculty taught students the same key concepts, though this does not account for difference in teaching styles. It is reported in Kreager (Citation2021) that there were no differences in students’ pretest scores between the courses, but this does not account for differences in the Wheeler creation assignment.
Secondly, no data were collected on student attendance outside of the data collection days. Students that did not attend both days that data was collected were not included in this study. It does not mean that all students attended the lab or additional lecture days between data collection and may impact the results of the study. Similarly, it is not known if students had received any type of feedback on the Wheeler diagram assignment prior to the posttest. Feedback is an important part of the learning process that may impact student’s pre-posttest understanding.
Future studies should monitor students’ attendance to ensure that all students participating in the study had received the expected content. Additionally, the impact of feedback on Wheeler diagram understanding may be a line of future research that could help explain the lack of additional learning associated with the Wheeler diagram instruction in this study.
Conclusions
This study indicates that Wheeler diagram instruction aided low-performing students’ interpretation skills but not the skills of high-performing students. Students in the study displayed several persistent conceptual errors, including challenges identifying unconformities, correlative conformities, and sequences, as well as misinterpreting facies boundaries. Given the importance of interpretation of sequence and Wheeler diagrams for industry (e.g., Heath, Citation2000) and the interpretation of paleo-environments, future studies should probe the origin and nature of student conceptual errors and test intervention strategies to improve their interpretation skills.
Supplemental Material
Download PDF (451.4 KB)Acknowledgments
The authors of this study would like to thank Dr. Brian Hampton, Dr. Michael Pope, and Dr. Ross Powell for allowing time in their courses to conduct this research.
Disclosure statement
The authors report here there are no competing interests to declare.
Additional information
Funding
References
- AAAS. (2012). A long-term AAAS initiative to advance literacy in Science, Mathematics, and Technology. https://www.project2061.org
- Ainsworth, S. (2006). DeFT: A conceptual framework for considering learning with multiple representations. Learning and Instruction, 16(3), 183–198.
- Alcalde, J., Bond, C. E., Gareth, J., Butler, R. W. H., Cooper, M. A., & Ellis, J. F. (2017). The importance of structural model availability on seismic interpretation. Journal of Structural Geology, 97, 161–171.
- Andersen, S. C., Humlum, M. K., & Nandrup, A. B. (2016). Increasing instruction time in school does increase learning. PNAS, 113, 7481–7484, https://doi.org/10.1073/pnas.1516686113.
- Boggs, S. (2006). Principles of sedimentology and stratigraphy (4th ed., pp. 289–306). Pearson Prentice Hall.
- Brakel, A. T., Totterdell, J. M., Wells, A. T., & Nicoll, M. G. (2009). Sequence stratigraphy and fill history of the Bowen Basin, Queensland. Australian Journal of Earth Sciences, 56, 401–432.
- Burton, E. P., & Mattietti, G. K. (2011). Cognition and self-efficacy of stratigraphy and geologic time: Implications for improving undergraduate student performance in geological reasoning. Journal of Geoscience Education, 59, 163–173. https://doi.org/10.5408/1.3605042
- Campo, B., Bohacs, K. M., & Amorosi, A. (2020). Late Quaternary sequence stratigraphy as a tool for groundwater exploration: Lessons from the Po River Basin (northern Italy). AAPG Bulletin, 104, 681–710. https://doi.org/10.1306/06121918116
- Carnegie Foundation. (n.d). The Carnegie classification of institutes. https://carnegieclassifications.acenet.edu/lookup/lookup.php
- Catuneanu, O. (2002). Sequence stratigraphy of clastic systems: Concepts, merits, and pitfalls. Journal of African Earth Sciences, 35, 1–43.
- Catuneanu, O. (2006). Principles of sequence stratigraphy (p. 369). Oxford, Elsevier.
- Catuneanu, O., Abreu, V., Bhattacharya, J. P., Blum, M. D., Dalrymple, R. W., Eriksson, P. G., Fielding, C. R., Fischer, W. L., Galloway, W. E., Gibling, M. R., Giles, K. A., Holbrook, J. M., Jordan, R., Kendall, C. G., St, C., Macurda, B., Martinsen, O. J., Miall, A. D., Neal, J. E., … Winker, C. (2009). Towards a standardization of sequence stratigraphy. Earth-Science Reviews, 92, 1–33. https://doi.org/10.1016/j.earscirev.2008.10.003
- Cheek, K. A. (2010). Commentary: A summary and analysis of twenty-seven years of geoscience conceptions research. Journal of Geoscience Education, 58, 122–134. https://doi.org/10.5408/1.3544294
- Cheek, K. A. (2013). How geoscience novices reason about temporal duration: The role of spatial thinking and large numbers. Journal of Geoscience Education, 61(3), 334–348.
- Cheney, E. S. (1993). Sequence stratigraphy and plate tectonic significance of the Transvaal succession of southern Africa and its equivalent in Western Australia. Precambrian Research, 79, 3–24.
- Dove, J. E. (1998). Students’ alternative conceptions in Earth science: A review of research and implications for teaching and learning. Research Papers in Education, 13, 183–201. https://doi.org/10.1080/0267152980130205
- Eberth, D. A., Brinkman, D. B., Chen, P., Yuan, F., Wu, S., Li, G., & Cheng, X. (2001). Sequence stratigraphy, paleoclimate patterns, and vertebrate fossil preservation in Jurassic-Cretaceous strata of the Junggar Basin, Xinjiang Autonomous Region, People’s Republic of China. Canadian Journal of Earth Science, 38, 1627–1644.
- Fang, Q., Wu, H., Hinnov, L. A., Jing, X., Wang, X., Yang, T., Li, H., & Zhang, S. (2017). Astronomical cycles of Middle Permian Maokou Formation in South China and their implications for sequence stratigraphy and paleoclimate. Palaeogeography, Palaeoclimatology, Palaeoecology, 474, 130–139.
- Francek, M. (2013). A compilation and review of over 500 Geoscience Misconceptions. International Journal of Science Education, 35, 31–64. https://doi.org/10.1080/09500693.2012.736644
- George, D., & Mallery, P. (2010). SPSS for windows step by step: A simple guide and reference 10.0 updated (10th ed.). Pearson.
- Heath, C. P. M. (2000). Technical and non-technical skills needed by oil companies. Journal of Geoscience Education, 48, 605–616.
- Herrera, J. S., & Riggs, E. M. (2013). Identifying students’ conceptions of basic principles in sequence stratigraphy. Journal of Geoscience Education, 61, 89–102.
- Herrmann, A. D. (2007). Using numerical models to teach sequence stratigraphic principles and the nature of the stratigraphic record. Journal of Geoscience Education, 55(1), 22–27. https://doi.org/10.5408/1089-9995-55.1.22
- Houston, J. (2004). High resolution sequence stratigraphy as a tool in hydrogeological exploration in the Atacama Desert. Quarterly Journal of Engineering Geology and Hydrogeology, 37, 7–17. https://doi.org/10.1144/1470-9236/03-013
- Hunt, D., & Tucker, M. E. (1992). Stranded Parasequences and the forced regressive wedge Systems Tract: Deposition during base level fall. Sedimentary Geology, 81, 1–9.
- Kirby, K. (n.d). “Easier to address” earth science misconceptions. http://serc.carleton.edu/NAGTWorkshop/intro/misconception_list.html
- Kreager, B. Z. (2021). It’s more than what you know: Conceptual understanding and spatial skill impact student sequence stratigraphic interpretation skill. Unpublished dissertation. Northern Illinois University.
- Kreager, B. Z., LaDue, N. D., Shipley, T. F., Powell, R. D., & Hampton, B. A. (2022). Spatial skill predicts success on sequence stratigraphic interpretation. Geosphere, 80(2), 750–761. https://doi.org/10.1130/GESO2428.1
- Kusnick, J. (2002). Growing pebbles and conceptual prisms-understanding the source of student misconceptions about rock formation. Journal of Geoscience Education, 50, 31–39. https://doi.org/10.5408/1089-9995-50.1.31
- Meyer, J. R., Parker, B. L., Arnaud, E., & Runkel, A. C. (2016). Combining high resolution vertical gradients and sequence stratigraphy to delineate hydrogeologic units for a contaminated sedimentary rock aquifer system. Journal of Hydrology, 534, 505–523. https://doi.org/10.1016/j.jhydrol.2016.01.015
- Myer, R. A., Shipley, T. F., & Davatzes, A. K. (2018). Reasoning about time from space: Visual continuity may disrupt reasoning about the passage of time within accreted materials. Journal of Geoscience Education, 66, 147–165. https://doi.org/10.1080/10899995.2018.1451183
- Posamentier, H. W., & Allen, G. P. (1999). Siliciclastic sequence stratigraphy: Concepts and applications. SEPM Concepts in Sedimentology and Paleontology, 7, 210.
- Qayyum, F., Groot, P. D., & Hemstra, N. (2012). Using 3D Wheeler diagrams in seismic interpretation-the HorizonCube method. First Break, 30, 103–109. https://doi.org/10.3997/1365-2397.30.3.56681
- Roediger, H. L., & Karpicke, J. D. (2006). The power of testing memory: Basic research and implications for educational practice. Perspectives on Psychological Science, 1(3), 181–210.
- Shanley, K. W., & McCabe, P. J. (1994). Perspectives on the Sequence Stratigraphy of Continental Stratal. AAPG Bulletin, 78, 544–568.
- Simmons, M. D., Sharland, P. R., Casey, D. M., Davies, R. B., & Sutcliffe, O. E. (2007). Arabian Plate sequence stratigraphy: Potential implications for global chronostratigraphy. GeoArabia, 12, 101–130.
- Sloss, L. L. (1962). Stratigraphic models in exploration. American Association of Petroleum Geologists Bulletin, 74, 93–114.
- St. John, K. (Ed) (2018). A community framework for geoscience education research: National Association of Geoscience Teachers. http://commons.lib.jmu.edu_framework/15
- Stensen, N. (1669). De solido intra solidum naturaliter content dissertationis prodromus. Florence. Tyographia sub signo Sellae.
- Tavakol, M., & Dennick, R. (2011). Making sense of Chronbach’s alpha. International Journal of Medical Education, 2, 53–55. https://doi.org/10.5116/ijmr.4dfb.8dfd
- Vail, P. R., Mitchum, R. M., Jr., & Thompson, S.III, (1977). Seismic stratigraphy and global change of sea level: Part 4. Global cycles of relative changes of sea level. American Association of Petroleum Geologist Special Volumes, 165, 83–97.
- Van Wagoner, J. C. (1995). Overview of sequence stratigraphy of foreland basin deposits: Terminology, summary of papers, and glossary of sequence stratigraphy. In J. C. Van Wagoner & G. T. Bertram (Eds.), Sequence stratigraphy of foreland basin deposits. American Association of Petroleum Geologists Memoir 64.
- Williams, G. D. (1993). Tectonics and seismic sequence stratigraphy: An introduction. In G. D. Williams & G. Dobb (Eds.), Tectonics and seismic sequence stratigraphy (Vol. 71, pp. 1–13). Geological Society Special Publication.