
Abstract
Learning in asynchronous online environments has gained importance over the last several decades, and educational environment shifts from the COVID-19 pandemic appear to have increased this need. Science educators and students need information about which approaches work in the asynchronous environment where informal feedback tends to be reduced, compared to other teaching modalities. In this study, we asynchronously implemented a learning module across 5 institutions that guided students (N = 199) from prescriptive data analysis through guided inquiry and eventually to open inquiry. The module focuses on the science behind climate change. Students work with the same authentic data sets used by professional scientists to examine geologic history and causes of climate change. By analyzing contemporary atmospheric carbon dioxide and temperature data and then using the 800,000-year record available from the Vostok ice core proxy record of atmospheric properties, students identify the causes of climate change and discover the unprecedented nature of recent atmospheric changes. Using a pre/post-module assessment, we demonstrate improvement in students’ understanding of climate change processes and statistical methods used to analyze data. However, there was no evidence that the module develops students’ scientific reasoning about the relationship between causation and correlation. Students maintained that correlation is not causation, even when a robust causal mechanism (i.e., the greenhouse effect) explains the link between atmospheric carbon dioxide and temperature. Finally, our analysis indicated that generally, anxiety about climate change was reduced during the module, such that students become less anxious about the climate change the more they learn about it. However, science-denying students experienced much higher anxiety about climate change than students who accepted the scientific consensus about climate change. Climate science-dissenting students were so few in this study that a statistical comparison was not possible, but this intriguing finding warrants further investigation of the role of anxiety in science denial. Mainly, this study demonstrates how asynchronous online learning environments can indeed support the achievement of learning objectives related to conducting authentic science, such as increasing understanding of climate change and statistical concepts, all while not provoking anxiety about climate change.
Introduction
With the rapid move toward remote learning at most universities in the United States due to the COVID-19 pandemic, we took the opportunity to investigate the impacts of previously developed data-rich teaching modules on student learning. We developed a series of videos and instructions to scaffold students’ asynchronous completion of Project EDDIE’s (Environmental Data Driven Inquiry & Exploration) Climate Change module. Previous research conducted within the context of this learning module demonstrated its efficacy in fostering appreciation for large data sets and areas of quantitative literacy (Klug et al., Citation2017; O’Reilly et al., Citation2017). Collectively, Project EDDIE modules have been demonstrated to help students understand the use of large data sets in science and the role of statistics, quantitative reasoning, and correlation in scientific studies (Soule et al., Citation2018).
Due to environmental changes and the availability of robust, long-term data sets, the need has arisen for longitudinal data to understand trends in systems due to gradual environmental shifts and large-scale responses to disturbance (Hampton et al., Citation2013). This trend requires STEM educators to respond in ways that build student skills necessary to engage with these large authentic datasets. Additionally, the use of authentic data in instructional activities is effective toward achieving data literacy (Kjelvik & Schultheis, Citation2019), or the application of the quantitative and analytical tools needed to solve contextualized problems through data analysis, interpretation, and communication (Gibson & Mourad, Citation2018). Data literacy goes together with statistical competence, an inherent skill needed for all levels of inquiry from researchers to academics and citizen scientists (Rumsey, Citation2002). Statistical competence refers to data-awareness, knowledge of basic statistical concepts including descriptive statistics, knowledge of basic data collection techniques, the ability to describe what results mean within the context, and the ability to communicate findings to diverse audiences and disciplines (Rumsey, Citation2002). As such, we adopt Rumsey’s (Citation2002) conceptualization of statistical competence; a primary purpose of our instructional approach was to develop this suite of skills.
Working with large data sets is increasingly common, and science graduates are expected to have ready skill sets to analyze large data sets (Hampton et al., Citation2017). This trend requires STEM educators to develop in students the skills necessary to engage with large datasets. Students often have little experience working with authentic data (Ellwein et al., Citation2014). We operate from the premise that engaging students in the analysis of authentic, large data sets can catalyze active learning. The analysis of authentic data can drive student learning because it can stimulate engagement at many levels (LaDue et al., Citation2021; Gould, Citation2010). Authentic data has not been either created or manipulated to show a prescribed result (Kjelvik & Schultheis, Citation2019). The open-ended nature of data investigations can discomfort instructors and students alike, but it is an accurate portrayal of how science proceeds and a key to engaging students in authentic science. From a cognitive perspective, authentic data have the potential to provide encounters with anomalous data, or data that do not cohere with their current conceptions; thus, these experiences may contribute to the construction of scientific conceptions by generating cognitive conflict when students’ experiences with the data lead to conclusions that contradict their expectations (Brewer & Gross, Citation2003; Chinn & Brewer, Citation1993). Thus, grappling with authentic data may be one of many experiences that hold the potential to support students’ construction of sound scientific understanding as well as evidence-based explanations that better align with scientific consensus.
Authentic data give learners an opportunity to put their prior experiences in a quantitative context, confirming or challenging their preconceptions. Data sets related to climate change, environmental health, our oceans (Greengrove et al., Citation2020), or a host of other geoenvironmental topics provide opportunities for place-based learning and to engage students in telling data-driven stories (Ellwein et al., Citation2014) that they are emotionally invested in because they directly impact their lives (Fredricks et al., Citation2004; LaDue et al., Citation2021). The incorporation of data into instruction provides opportunities for students to engage in several cross-cutting concepts for STEM disciplines, including analysis and visualization of data, asking scientific questions, developing and using models, and evidence-driven scientific argumentation (Cooper et al., Citation2015). Students become collaborators as they progress from prescribed data analysis to open inquiry, thereby compelling development of scientific habits of mind.
As with scientists, the learning gains that are possible through the analysis of environmental data often hinge on how effectively students use statistics to build their knowledge of a concept or principle. Although many students have prior exposure to basic statistical concepts (Prayoga & Abraham, Citation2017), they struggle with the application of concepts such as variation, correlation, regression, and even slope (Carey & Gougis, Citation2017; Gougis et al., Citation2017; Klug et al., Citation2017). These struggles manifest as difficulty in interpreting statistical analyses in relation to research questions (Gougis et al., Citation2017; Soule et al., Citation2018), even while software such as Excel or R relieve students of having to perform the mathematical calculations. As such tools become more capable, powerful, and user friendly, we suspect there is greater risk of students being able to follow a procedure to produce a correct analysis without achieving the intended learning objectives.
Educating students about climate change is an important element of undergraduate education throughout the world. The topic is challenging because of the scientific skills and understanding required to fully conceptualize climate science, and the way climate science has become politicized, emotionally laden, and subject to science denial. As climate change and other socioscientific topics become politicized in our national discourse (Chinn et al., Citation2021; Bolsen & Druckman, Citation2015; Gauchat, Citation2012), it is tempting to counter the trend in our classrooms by helping students understand why climate change is occurring (i.e., mechanistic knowledge) and bolstering students’ quantitative reasoning skills. However, as documented by several scholars (see Darner, Citation2019; Chinn et al., Citation2021; Rosenau, Citation2012; Sinatra et al., Citation2014; Zummo et al., Citation2020), in addition to quantitative reasoning skills and mechanistic knowledge about climate change, we must also attend to students’ identities as they relate to climate change, which may include their level of anxiety and ideologies that could drive motivated reasoning. Thus, instructors are challenged to identify which instructional approaches might be effective in achieving student outcomes related to climate change. We posit that when climate change education engages students in the analysis of authentic climate data that is publicly available and intended for researchers, we have the potential to develop data literacy, foster science acceptance (Darner, Citation2019), and alleviate anxiety about the consequences of climate change. In this article, we evaluate the extent to which a curricular module influences student outcomes in these areas, specifically when the module was taught asynchronously online during the SARS-CoV-2 pandemic.
To what extent does asynchronous online engagement in the analysis of authentic climate science data influence:
students’ statistical competence?
students’ understanding of the mechanisms and data supporting the anthropogenic climate change hypothesis?
students’ anxiety about climate change?
students’ acceptance of the scientific consensus on anthropogenic climate change?
We will also discuss our teaching experiences in the asynchronous online learning environment and our perspectives on both the challenges and the affordances to student learning provided in this learning environment.
Methods
Settings
This study took place across 6 online, undergraduate courses at 5 institutions during the 2020–2021 academic year (). Four of the courses were taught in the Fall 2020 semester, and two were taught in the Spring 2021 semester. These data collections allowed for a broad and diverse sample of undergraduates. In all courses, the Project EDDIE Climate Change module (available at https://serc.carleton.edu/eddie/teaching_materials/modules/climate_change.html), which uses authentic climate science data, was taught asynchronously.
Table 1. Institutional data of participating colleges/universities.
These courses occurred during the SARS-CoV-2 pandemic. Although we did not measure the impact that this pandemic had on student learning, we recognize that student learning and mindset was impacted by the pandemic. Possible impacts include but are not limited to their own illness, a loved one’s illness, anxiety related to the potential of getting sick, isolation, death of loved ones, impact to dependents’ school/childcare, eldercare, working extra hours, or loss or layoff from work either for themselves or others in their household. Instructors and students also had to make a swift shift to online learning due to the SARS-CoV-2 pandemic. This forced students into online courses regardless of whether an online course modality was desired. Instructors were forced, in some cases without any prior online teaching experience, to determine how best to deliver material previously taught in-person. We suspect that the students in this study, who were mostly learning in-person before the pandemic, felt some level of exhaustion not only in this course but in all their courses. We also suspect that this fatigue influenced student learning and data that we collected related to this study. Even though this impact was not measured directly, this information provides valuable context for the study.
Participants
Participants who provided complete pre/post-module assessment and questionnaire data were included in statistical analyses (N = 199). These participants were mostly first-year college/university students. Data were collected from a diversity of majors; the largest proportion of participants were either education or business majors (). A large majority of participants identified as women (69.8%), with 28.6% identifying as men and 1.5% identifying as non-binary. All ethnicity groups surveyed were represented in the sample, with most participants identifying as White/European American (71.9%) and 17.6% of participants identifying as Latinx ().
Figure 1. Percentages of sample who had identified majors within eight categories of disciplines.
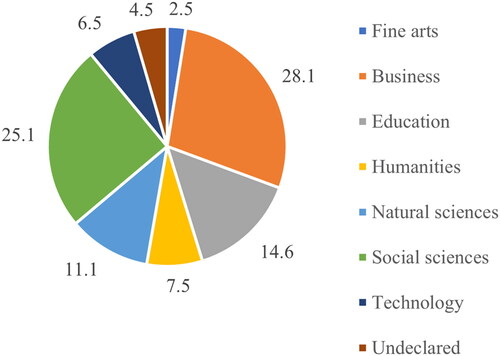
Table 2. Percentages of sample’s reported racial, ethnicity, and Latinx identities (non-mutually exclusive).
Curricular alignment
The Project EDDIE Climate Change module was used in all courses as the curricular module to facilitate students’ development of an understanding of anthropogenic climate change by interpreting results through analysis of large publicly available datasets. Students used Microsoft Excel and the statistical tools of linear regression, coefficient of determination, and correlation coefficients to analyze and plot data related to global average temperature, atmospheric carbon dioxide concentration, and proxies for atmospheric carbon dioxide concentrations found in ice cores. The topic of anthropogenic climate change was not discussed extensively in any of these courses prior to the students engaging with the module.
All students, regardless of institution or level, engaged with the Climate Change module through a similar process. Prior to the Fall 2020 semester, all instructors collaborated to co-construct the pedagogical approach and online materials through which students would be led through the module. Five videos ranging from 5 minutes to 28 minutes (available on the Project EDDIE YouTube channel: https://www.youtube.com/@projecteddie6005) were created by the instructors to provide students with background information to prepare them for engaging with the module. These videos were chunked mini lectures covering the following topics: (a) Earth’s Global Temperature and the Greenhouse Effect, (b) Linear Regression and the Coefficient of Determination, (c) Behavior of Greenhouse Gasses, (d) Carbon Dioxide Concentration Measurements at Mauna Loa, and (e) Paleoclimate Atmospheric Carbon Dioxide Concentration Data from Ice Cores. These videos were posted on the TED-Ed platform with questions embedded throughout each lecture, allowing students to practice what they learned and check comprehension before engaging with the climate change module. Because students we were working asynchronously over the course the of two-week module, it is unknown how long students took to complete the module, especially since videos could be viewed several times.
The collaboration amongst instructors and alignment of how students were led through the material in this module in an asynchronous online modality provides us with the confidence in combining samples across courses and institutions. Shared learning objectives included: (a) interpreting correlation coefficient in a regression analysis, (b) interpreting slope in a regression analysis, (c) comparing slopes and identifying different rates of change, (d) distinguishing simple correlation from situations in which correlation is indicative of a causal relationship, (e) alleviate anxiety about climate change, and (f) foster acceptance of the scientific consensus regarding anthropogenic climate change.
Data collection & analyses
To measure changes in students’ understanding of statistical and climate change concepts, we embedded seven items into the pre/post-module assessments (see Supplement). These items constituted 2% or less of students’ overall grade in their course. In addition to these content knowledge assessments, a questionnaire was administered through Qualtrics at the beginning of the course, just before module implementation, and at the end of the course. Students who completed all three administrations were provided extra credit of no more than 2% of their course grade. The questionnaire contained two instruments to measure climate change dissension and climate change anxiety.
Instruments
Content knowledge
The first item on the embedded content knowledge assessment asked students to interpret a correlation coefficient. The second through fourth items asked students to identify graphs that showed no correlation, a correlation with a coefficient of 0.6, and the strongest negative correlation among five choices. The first four items were derived from the ARTIST Bivariate Quantitative Data Scale (Garfield et al., Citation2006). Item 1 was rephrased from the ARTIST Scale’s item 2 to remove negative phrasing. Items 2–4 were re-created from the ARTIST Scale items 4–6 to use higher resolution artwork. Item 4 was rephrased to avoid complex multiple-choice construction (Haladyna et al., Citation2002). The fifth item asked students to compare the current rate of change in atmospheric carbon dioxide concentration with pre-historic rates. The sixth item asked students to identify from the same five graphs from items 2–4 the graph that best represents the relationship between atmospheric carbon dioxide and average global temperature. The final item asked students to choose an explanation that best explains why the relationship between atmospheric carbon dioxide and average global temperature is causal and not simply correlational. To summarize, all items except for item 5 assessed understanding of statistical concepts, while items 5–7 also assessed understandings of climate change that are directly addressed within the curricular module.
Climate change dissension
At the beginning of the questionnaire, students were asked to identify which of the following statements best describes their belief about climate change:
I believe that human activities, such as the burning of fossil fuels, is causing an increase in average global temperature.
I do not believe that the average global temperature is increasing.
I believe that the increase in average global temperature that we are observing is due to Earth’s natural cycles.
Students who chose statements 2 or 3 were directed using display logic to complete the Anthropogenic Climate Change Dissenter Inventory (ACCDI; Bentley et al., Citation2019). The ACCDI is composed of 43 statements to which participants agree/disagree on a 5-point Likert scale. Due to the instrument’s use of false claims about climate change to elicit agreement with science denying viewpoints, students who chose the first statement were not given the ACCDI, in order to avoid the familiarity backfire effect (Ecker et al., Citation2017). The ACCDI has demonstrated validity through confirmatory factor analysis and is useful in exploring climate change denial along five factors: naive arguments that refute the science of anthropogenic climate change (ACC), sophisticated arguments that distance climate change from humankind, arguments that claim ACC as “natural,” arguments that claim that ACC is beneficial, and arguments that assert ACC is part of a larger cycle (Bentley et al., Citation2019).
Climate change anxiety
To measure anxiety related to climate change, the 12-item Anxiety about Climate Change Survey (ACCS; Klingler & Darner, Citation2020) was administered within the pre/post questionnaire. Items are responded to on a 7-point Likert scale. In an exploratory factor analysis, the ACCS demonstrated preliminary validity in measuring two factors related to climate change anxiety: climate-change-specific anxiety and generalized anxiety (Klingler & Darner, Citation2020).
Analyses
To compare understanding of statistical concepts and climate change concepts before and after engagement in the climate change module, pre/post-module responses were compared for each item separately using a McNemar’s test to gauge change in understanding. A McNemar’s test was chosen because each item was scored as either 0 or 1 according to accuracy, and the McNemar’s test compares paired, binary data (McNemar, Citation1947). The McNemar’s test produces a test statistic (abbreviated χ2, not to be confused with the chi-squared test) and associated p-value, which were used as indicators of statistical significance (McNemar, Citation1947). Items 1–4 and 7 pertained to statistical concepts that were taught during the climate change module (i.e., correlation coefficient, slope, correlation vs. causation), while items 5–7 pertained to climate change concepts (i.e., how current rates of change compare to prehistoric rates, relationship between average global temperature and atmospheric carbon dioxide concentration).
A repeated measures analysis of variance (RM-ANOVA) was performed on the ACCS data to gauge statistically significant change in climate change anxiety throughout the course. A RM-ANOVA was chosen because our data set involves administration of the ACCS at three points across time, and we had intended to compare change across categories of students: students who accept the scientific consensus and students who are climate change dissenters.
A RM-ANOVA was planned to detect significant change in climate change dissension, measured by the ACCDI, across the repeated measures (i.e., beginning of course, before module, after module/end of course). However, due to the low number of dissenters in our sample (i.e., see Climate Change Dissension section; students who chose statements 2 and 3), a qualitative approach to analyzing the data was taken instead. Specifically, the initial 17 students were binned into two categories according to the pattern that their climate change dissension took over the course of the semester. These bins were: (a) students who switched to the scientific consensus by the end of the course (see Climate Change Dissension section; statement 1 and (b) students who persistently dissented by the end of the course (see Climate Change Dissension section; statements 2 or 3). Then, we explored content knowledge and climate change anxiety among these groups and used descriptive statistics to posit emergent hypotheses about the interrelationships among climate change anxiety, climate dissension, and knowledge about climate change that may be explored in future research with larger samples of climate change dissenters.
Results
Pre/post-module analysis of the students’ understanding of underlying statistical concepts showed a varied learning response to completing the climate change module in an asynchronous environment. In three of the five items measuring students’ understanding of statistical concepts, the McNemar’s test showed a statistically significant improvement from pre-module to post-module. We hypothesize that this statistically significant result indicates that asynchronous engagement with the climate change module improved statistical competence.
The statistically significant results for item 1 () indicate that students learned that the statistical meaning of the coefficient of determination is the fraction of variation that is explained in a dependent variable by an independent variable. Thirty-three percent of respondents responded to item 1 correctly on both pre- and post-test, while 29.6% of respondents corrected their item 1 response on the post-test ().
Figure 2. Comparison of responses on each item of the pre/post-module assessment, indicating number of students who answered correctly pre- and post-module (yellow), incorrectly pre-module and correctly post-module (gray, indicative of desirable learning gains), correctly pre-module and incorrectly post-module (orange, indicative of regressed change), and incorrectly pre- and post-module (blue, indicative of new measurable learning). Parenthetical notation indicates whether the item measured statistical concept understanding (S), climate change understanding (C), or both (S, C).
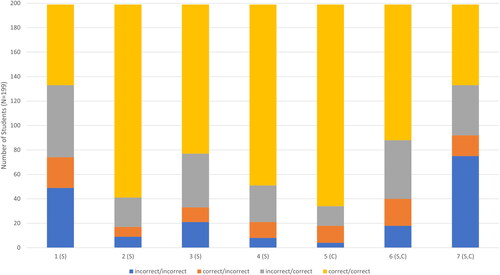
Table 3. Results of McNemar’s test comparing participants’ responses to pre- and post-module assessments of understanding of statistical concepts (S) and understanding of climate change (C).
The results for items 2–4 indicate that students learned to differentiate different types of correlation or correlation-related concepts depicted in graphical form (). These questions asked students to choose among a set of 5 graphs: one with a strong positive correlation, one with a strong negative correlation, one with a weak positive correlation, one with a weak negative correlation, and one with no correlation. In items 2–4, most students responded to the item correctly both pre-module and post-module (). Item 2 (χ2 = 7.0, p = 0.008) asked students to choose the graph showing no relationship. Most respondents (79.4%) responded to item 2 correctly in both the pre- and post-module assessments, and 12.1% corrected their item 2 response in the post-module assessment (). In item 3 (χ2 = 17.2, p < 0.001; ), students were asked to choose the graph showing a correlation of about 0.60. Most respondents (61.3%) responded correctly in both the pre- and post-module assessments, and 22% corrected their response in the post-module assessment (). In item 4 (χ2 = 6.0, p = 0.015; ), students choose the graph with the strongest negative correlation. Most students (74.4%) responded to item 4 correctly in both the pre- and post-module assessments, and 15.1% of respondents corrected their response after the module (). In items 2–4, a larger number of respondents corrected their response in the post-module assessment than gave incorrect responses both times or gave a correct response in the pre-module assessment and an incorrect response in the post-module assessment ().
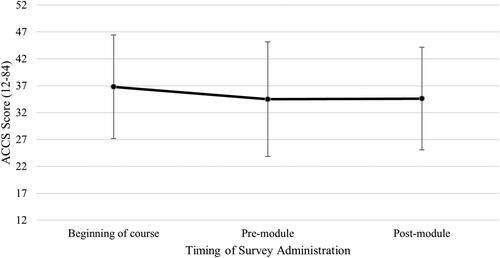
Figure 3. Participants’ climate change anxiety measured at the beginning of the course, prior to the module, and after the module; asterisks indicate statistically significant difference. Error bars indicate standard deviation.
Statistical competence
Items 6 and 7 measured understanding of both statistical concepts and climate change. In item 6 (χ2 = 8.9, p = 0.03; ), students were asked to choose the graph that most closely represented the relationship of atmospheric CO2 (x-axis) and global average temperature (y-axis) from a set of five graphs identical to those in items 2–4, except that axis labels were included. Most students (55.8%) responded to item 6 correctly both in the pre- and post-module assessments, and 24% corrected their response in the post-test (). In item 7 (χ2 = 0.016, p = 0.901; ), students were asked to identify the evidence-based argument about the cause of climate change by applying their understanding of correlation and causation. Only 33.2% of students responded to item 7 correctly on both pre- and post-module assessment, while 20.6% of students corrected their response on the post-module assessment, and a similar fraction shifted from the correct response to an incorrect response (). A large proportion (37.7%) of respondents responded incorrectly on both pre- and post-module assessments ().
Understanding of climate change
Items 5, 6 and 7 on the pre/post-module assessment assessed students’ understanding of climate change concepts before and after the module (). Only question 6 showed statistically significant improvement from pre- to post-module. Item 5 (χ2 = 0.033, p = 0.855; ) assessed students’ understanding of the increase in the current rate of change of atmospheric CO2 concentration versus the pre-historic rate of change of atmospheric CO2 concentration. The key reason for a non-significant difference is that the students were already quite knowledgeable at the beginning of the module, with almost all (82.9%) students responding to this item correctly in the pre-module assessment. Question 6 asked students to select the graph that best represented the relationship between atmospheric CO2 concentration and global average temperature. Question 7 assessed students’ understanding of the reasoning behind why a causal relationship can be determined between the increase in atmospheric CO2 concentration and the increase in global average temperature. The result implies students showed limited improvement in their understanding of correlation versus causation in the context of climate change. Before the module, 42% of respondents answered item 7 correctly, and after the module, 53.8% of respondents answered item 7 correctly. A substantial number of respondents (75, or 37.7%) answered item 7 incorrectly both pre- and post-test. Of the 116 (58.3% of all respondents) who answered incorrectly on the pretest, 41 students (35.3%) corrected their answer on the post-test.
Climate change anxiety
Regarding climate change anxiety, a RM-ANOVA revealed a significant decrease in climate change anxiety from the beginning of the course to just prior to the module, which did not significantly change during the climate change module (F(1,198) = 3102.2, p < 0.001, ηp2=0.94; ). In other words, students’ anxiety about climate change decreased throughout the course leading up to the climate change module and stayed low throughout the module, to the end of the course.
Climate change dissension
Over the course of the semester, 32 students selected a dissenting stance about climate change at some point across the three survey administrations. Twenty of these students who expressed dissension at some point during the course ended the course choosing the scientific consensus.
Of the remaining 12 students, seven students ended the course dissenting. Four students of these 7 students consistently chose one of the two climate change dissension statements across the whole course; these four students are termed persistent dissenters. All persistent dissenters had GPAs above 3.0; half were first-year students and half were sophomores. Three were women, while one was a man, and three were business majors, while one was a STEM major. Two of the four began the course denying the existence of climate change altogether (i.e., statement 2), but by the second survey administration, all four students’ stance was that climate change is happening but only due to Earth’s natural cycles (i.e., statement 3) ().
Table 4. Number of students who accepted the scientific consensus or held one of two dissenting views about climate change across three timepoints throughout the course.
Interestingly, while choosing a dissenting stance on climate change, all persistent dissenters expressed higher-than-average anxiety about climate change across all three survey administrations, compared to the average anxiety reported by all other students who chose a dissenting stance on any of the three administrations (). This pattern was not observed in their content knowledge; two of the four ended the course with higher-than-average content knowledge about climate change while the other two ended the course with slightly lower than average content knowledge.
Table 5. Descriptors of persistent climate science dissenters (N = 4) and their climate change anxiety at the end of the course (number of SDs from the mean).
The remaining three students who ended the course dissenting also began the course dissenting but chose the scientific consensus view mid-course, and then returned to a dissenting view at the end of the course. Like the four students who chose a dissenting stance across all three survey administrations, two of these students also had consistently higher than average climate change anxiety throughout the course. The remaining students started the course with very low climate change anxiety, but by the end of the course, their anxiety was more than one standard deviation above the mean for all other dissenters. All these students had average or slightly below average content knowledge about climate change at the end of the course.
Another notable group of these 32 students are the 5 new dissenters, or students who began the course choosing the scientific consensus but by the end of the course chose statement 3, which acknowledges climate change but denies that it is anthropogenic. Unlike the persistent dissenters, these students expressed climate change anxiety that was very near the mean for all dissenters, and their content knowledge followed a similar pattern.
Discussion
Students demonstrated progress in learning about statistical concepts due to the asynchronous implementation of the climate change learning module. Learning gains were tempered by the fact that students arrived at the lesson already knowing a good amount about correlation and its potential use for analysis, as well as climate science. The specific understanding that students learned was related to statistical competence (Rumsey, Citation2002), including distinguishing slope from the coefficient of determination (r2). This learning gain implies that analyzing authentic data helps students to foster this statistical competence (, ), specifically the knowledge of basic statistical concepts and the ability to describe what results mean within the context (Rumsey, Citation2002). This learning is important because students will be expected to work with data and perform statistical methods throughout their education and after graduation.
Prior studies (Carey & Gougis, Citation2017; Klug et al., Citation2017) have shown that although most students have prior exposure to basic statistical concepts (Prayoga & Abraham, Citation2017), they still struggle with the application of concepts such as variation, correlation, regression, and slope. For example, although students have heard the refrain that correlation does not mean causation, they may struggle with how to quantify their comparisons or recognize the implications of the extremely high correlations we observe in climate science (Florides & Christodoulides, Citation2009). This study adds to this list of challenges in learning about correlation, because in our analysis, students were not able to identify when two variables, such as atmospheric carbon dioxide and average global temperature, are correlated due to a causal relationship between them. We recognize, however, that interpretation of item 7 on our pre/post-module assessment may have impeded this item’s ability to measure students’ understanding of this topic. Nevertheless, this area of statistical competence, identifying when a correlation is indicative of a causal relationship, warrants further exploration.
Several additional areas of challenge regarding statistical competence were reflected in our study. For example, although students are often able to use measures of variation, such as standard deviation, they often attribute variation to experimental or measurement error without considering the random nature of sampling nor variation that occurs naturally in the population (Gougis et al., Citation2017). This phenomenon might explain unscientific interpretations of the graphs used on our assessment. Students may also conflate slope and r-squared (Bader et al., Citation2016; Soule et al., Citation2018) and often do not connect r-squared to the concept of variation; again, this could be relevant to our students’ interpretation of the assessment graphs. We point out these struggles not to imply that students are deficient. Rather, we wish to highlight the consequences of science instruction that seeks to confirm the scientific consensus and involves analysis of fictional or curated datasets. An alternative, which may support more sophisticated views of variation, is to explore novel questions using authentic data, which affords instructors opportunity to discuss the realities of authentic datasets with students and learn why they are reasoning the way they do.
This instructional approach requires an assessment strategy that is less focused on correct solutions and more focused on thinking critically and devising well-reasoned arguments to demonstrate that their analyses are meaningful. In the context of the climate change module, we encourage students to thoughtfully explore potential explanations for the correlations that they observe and think critically about the vastly different time scales presented in the datasets they are analyzing. The shift from statistical analysis to scientific inference is accomplished when students immerse themselves in the organization, manipulation, and application of data, as their perception of climate change shifts from anecdotal to empirical. This shift of perspective toward the data rather than the broad, often politicized claims also might encourage students to reason with evidence, which Thank and Sinatra (Citation2022) have found supports quantitative reasoning and reflection on information that conflicts with preconceptions, which in turn can foster conceptual change.
Learning about the mechanisms of climate change
The asynchronous delivery of Project EDDIE’s climate change module seems to have improved student understanding of the mechanisms and reasoning behind the scientific consensus regarding climate change. This learning was modest in part because the students arrived already understanding that the rate of change of carbon dioxide in the atmosphere currently is significantly faster than in the geologic past (see item 5 in , ). Still, students significantly improved their understanding of the tight correlation between atmospheric carbon dioxide and global temperature (item 6), and this understanding is key to understanding the scientific consensus around anthropogenic climate change. Students did not show improvement on item 7, with which we attempted to gauge whether students understand the complexities of causation and correlation. As many students repeat the “correlation is not causation” claim, we fear that students interpret this claim to mean that correlation is never due to causation. Causation can be claimed when we have deep, collective knowledge to identify the mechanism causing the observed correlation (Rohrer, Citation2018). In the context of climate change, this mechanism is the greenhouse effect. Ideally, upon learning that the greenhouse effect explains the correlation between atmospheric carbon dioxide and average global temperature, we had hoped that students would respond correctly on this item, if they understood that causation can be claimed if we have deep knowledge of the causal mechanism. However, we acknowledge that this roundabout way of testing understanding of the causation-correlation distinction limits the claim we are able to make about how well students learned about causation and correlation in the context of climate change. We suggest this statistical reasoning be further explored through climate change instruction, since the correlation between average global temperature and atmospheric carbon dioxide is indeed due to a causal relationship. Our data indicate that students may perhaps think that this relationship is only correlational, despite gaining understanding of the specific mechanism by which carbon dioxide causes increased temperature, which may in turn bolster science denying stances.
Climate change anxiety and science denial
Today’s students face an ever-increasing amount of anxiety and stress from a multitude of sources. Often overlooked is the toll on mental health caused by climate change. Climate change anxiety, also known as “eco-anxiety” and “climate trauma”, has risen to levels of chronic physiological disease (Woodbury, Citation2019). In worst cases, children have refused to drink water during droughts, suffered panic attacks driven by the thought of human extinction, and even become suicidal at the thought of environmental damage (Morris, Citation2020). Young people often express relief when given a safe space to study and discuss climate change matters, so educators should be cognizant of and be sensitive toward anxiety that arises during classroom discussions about climate change (Pihkala, Citation2017).
Perhaps as troubling as students suffering from climate anxiety, is that anxiety can ironically lead to climate change dissension. Many times, climate anxiety stems from hopelessness, which in turn leads to denial (Stern, Citation2012). In addition to anxiety, students’ mechanistic knowledge about climate change and worldview may also skew their views on climate change (Zummo et al., Citation2020). This perfect storm of experiences can lead to denial as a coping mechanism (Clayton et al., Citation2016). In other words, if we want to address climate change dissension, we cannot ignore the climate anxiety that often leads to students resorting to denial as a coping mechanism (Hicks & Bord, Citation2001; Pihkala, Citation2017).
Climate change dissension did not occur frequently enough in our sample to explore the statistical relationships between climate change dissension and climate change anxiety. However, all persistent dissenters (i.e., students who chose a dissenting stance across all three survey administrations) expressed consistently higher climate change anxiety. All four persistently dissenting students agreed with statement 3 by mid-course, which acknowledges that climate change is happening but is due to Earth’s natural cycles. This stance places the phenomenon of climate change outside of humans’ locus of control, which likely explains why these students felt substantially higher than average anxiety about climate change (). If climate change is acknowledged to be occurring but perceived to be not influenced by human activities, then there is little that humans can do to alter its course, which no doubt generates anxiety about its consequences. We cautiously draw this connection between this stance on climate change and climate change anxiety, given that this was observed in only four students in our sample. However, we argue that exploring the relationship between science denying stances and anxiety about the denied phenomenon warrants further attention. Darner (Citation2019) posits a model for how negative emotions during evidence evaluation, such as those brought on by anxiety, can lead to denialist stances, but this should be explored empirically. Further, the clear trends observed across our entire sample with climate change anxiety, when compared to less clear patterns observed with content knowledge, should indicate to us that, at least as much as we attend to students’ content knowledge about climate change, we should also be attending to students’ climate change anxiety and perceived locus of control regarding climate change.
Reflections on teaching asynchronously online
The transition to asynchronous instruction for this module worked well. Students continued to struggle with Microsoft Excel and lack knowledge about how to use it, but this has occurred in face-to-face iterations of the Project EDDIE climate change module as well (O’Reilly et al., Citation2017). New strategies for introducing and preparing students to use Excel in the online environment were effective and well received. The ability to add additional content using the TedED format provided a mechanism for explaining difficult material that, when taught in the classroom, would have been difficult to deliver over a wide range of student skill levels. It also allowed us to include self-guided formative assessment to create “at your own pace” activity enrichment.
Conclusion
Our study investigating students’ learning about climate change and statistical concepts in an asynchronous online setting was generally successful with robust and positive student learning being documented. Students significantly improved their statistical competence and climate science understanding, with a more robust understanding of the underlying causes and processes that contribute to anthropogenic climate change. Finally, we observed a potentially interesting connection between climate anxiety and climate science denial that is worth further investigation.
Supplemental Material
Download MS Word (197 KB)Acknowledgments
We thank our students for serving as research participants in this study. This research was funded by the National Science Foundation, Award #1821567.
Disclosure statement
The authors report there are no competing interests to declare.
Correction Statement
This article has been republished with minor changes. These changes do not impact the academic content of the article.
References
- Bader, N. E., Soule, D., Castendyk, D., Meixner, T. (2016). Students, meet data. https://arizona.pure.elsevier.com/en/publications/students-meet-data
- Bentley, A. P. K., Petcovic, H. L., & Cassidy, D. P. (2019). Development and validation of the anthropogenic climate change dissenter inventory. Environmental Education Research, 25(6), 867–882. https://doi.org/10.1080/13504622.2016.1250150
- Bolsen, T., & Druckman, J. N. (2015). Counteracting the politicization of science. Journal of Communication, 65(5), 745–769. https://doi.org/10.1111/jcom.12171
- Brewer, C. A., & Gross, L. J. (2003). Training ecologists to think with uncertainty in mind. Ecology, 84(6), 1412–1414. https://doi.org/10.1890/0012-9658(2003)084[1412:TETTWU2.0.CO;2]
- Carey, C. C., & Gougis, R. D. (2017). Simulation modeling of lakes in undergraduate and graduate classrooms increases comprehension of climate change concepts and experience with computational tools. Journal of Science Education and Technology, 26(1), 1–11. https://doi.org/10.1007/s10956-016-9644-2
- Chinn, C. A., & Brewer, W. F. (1993). The role of anomalous data in knowledge acquisition: A theoretical framework and implications for science instruction. Review of Educational Research, 63(1), 1–49. https://doi.org/10.3102/00346543063001001
- Chinn, C. A., Barzilai, S., & Golan Duncan, R. (2021). Education for a “post-truth” world: New directions for research and practice. Educational Researcher, 50(1), 51–60. https://doi.org/10.3102/0013189X20940683
- Clayton, S., Devine-Wright, P., Swim, J., Bonnes, M., Steg, L., Whitmarsh, L., & Carrico, A. (2016). Expanding the role for psychology in addressing environmental challenges. American Psychologist, 71(3), 199–215. https://doi.org/10.1037/a0039482
- Cooper, M. M., Caballero, M. D., Ebert-May, D., Fata-Hartley, C. L., Jardeleza, S. E., Krajcik, J. S., Laverty, J. T., Matz, R. L., Posey, L. A., & Underwood, S. M. (2015). Challenge faculty to transform STEM learning. Science (New York, N.Y.), 350(6258), 281–282. https://doi.org/10.1126/science.aab0933
- Darner, R. (2019). How can educators confront science denial? Educational Researcher, 48(4), 229–238. https://doi.org/10.3102/0013189X19849415
- Klingler, A., & Darner, R. (2020, October 13–16). Does climate change anxiety influence zoo visitor experience? North American Association for Environmental Education Annual Conference [Paper presentation].North American Association for Environmental Education 2020 Annual Conference, Virtual.
- Ecker, U. K. H., Hogan, J. L., & Lewandowsky, S. (2017). Reminders and repetition of misinformation: Helping or hindering its retraction? Journal of Applied Research in Memory and Cognition, 6(2), 185–192. https://doi.org/10.1037/h0101809
- Ellwein, A. L., Hartley, L. M., Donovan, S., & Billick, I. (2014). Using rich context and data exploration to improve engagement with climate data and data literacy: Bringing a field station into the college classroom. Journal of Geoscience Education, 62(4), 578–586. https://doi.org/10.5408/13-034
- Florides, G. A., & Christodoulides, P. (2009). Global warming and carbon dioxide through sciences. Environment International, 35(2), 390–401. https://doi.org/10.1016/j.envint.2008.07.007
- Fredricks, J. A., Blumenfeld, P. C., & Paris, A. H. (2004). School engagement: Potential of the concept, state of the evidence. Review of Educational Research, 74(1), 59–109. https://doi.org/10.3102/00346543074001059
- Garfield, J., Delmas, R., Chance, B., & Ooms, A. (2006). Assessment resource tools for improving statistical thinking. Retrieved 1 April 2020 from https://www.causeweb.org/cause/archive/artist/articles/AERA_2003.pdf
- Gauchat, G. (2012). Politicization of science in the public sphere: A study of public trust in the united States, 1974 to 2010. American Sociological Review, 77(2), 167–187. https://doi.org/10.1177/0003122412438225
- Gibson, J. P., & Mourad, T. (2018). The growing importance of data literacy in life science education. American Journal of Botany, 105(12), 1953–1956. https://doi.org/10.1002/ajb2.1195
- Gougis, R. D., Stomberg, J. F., O’Hare, A. T., O’Reilly, C. M., Bader, N. E., Meixner, T., & Carey, C. C. (2017). Post-secondary science students’ explanations of randomness and variation and implications for science learning. International Journal of Science and Mathematics Education, 15(6), 1039–1056. https://doi.org/10.1007/s10763-016-9737-7
- Gould, R. (2010). Statistics and the modern student. International Statistical Review = Revue Internationale de Statistique, 78(2), 297–315.
- Greengrove, C., Lichtenwalner, S., Palevsky, H., Pfeiffer-Herbert, A., Severmann, S., Soule, D., Murphy, S., Smith, L., & Yarincik, K. (2020). Using authentic data from NSF’s ocean observatories initiative in undergraduate teaching. Oceanography, 33(1), 62–73. https://www.jstor.org/stable/26897836 https://doi.org/10.5670/oceanog.2020.103
- Haladyna, T. M., Downing, S. M., & Rodriguez, M. C. (2002). A review of multiple-choice item-writing guidelines for classroom assessment. Applied Measurement in Education, 15(3), 309–333. https://doi.org/10.1207/S15324818AME1503_5
- Hampton, S. E., Jones, M. B., Wasser, L. A., Schildhauer, M. P., Supp, S. R., Brun, J., Hernandez, R. R., Boettiger, C., Collins, S. L., Gross, L. J., Fernández, D. S., Budden, A., White, E. P., Teal, T. K., Labou, S. G., & Aukema, J. E. (2017). Skills and knowledge for data-intensive environmental research. Bioscience, 67(6), 546–557.
- Hampton, S. E., Strasser, C. A., Tewksbury, J. J., Gram, W. K., Budden, A. E., Batcheller, A. L., Duke, C. S., & Porter, J. H. (2013). Big data and the future of ecology. Frontiers in Ecology and the Environment, 11(3), 156–162. https://doi.org/10.1890/120103
- Hicks, D., & Bord, A. (2001). Learning about global issues: Why most educators only make things worse. Environmental Education Research, 7(4), 413–425. https://doi.org/10.1080/13504620120081287
- Kjelvik, M. K., & Schultheis, E. H. (2019). Getting messy with authentic data: Exploring the potential of using data from scientific research to support student data literacy. CBE—Life Sciences Education, 18(2), es2. es2. https://doi.org/10.1187/cbe.18-02-0023
- Klug, J. L., Carey, C. C., Richardson, D. C., & Darner Gougis, R. (2017). Analysis of high‐frequency and long‐term data in undergraduate ecology classes improves quantitative literacy. Ecosphere, 8(3), e01733. https://doi.org/10.1002/ecs2.1733
- LaDue, N. D., Ackerman, J. R., Blaum, D., & Shipley, T. F. (2021). Assessing water literacy: Undergraduate student conceptions of groundwater and surface water flow. Water, 13(5), 622. https://www.mdpi.com/1014042 https://doi.org/10.3390/w13050622
- McNemar, Q. (1947). Note on the sampling error of the difference between correlated proportions or percentages. Psychometrika, 12(2), 153–157. https://doi.org/10.1007/BF02295996
- Morris, A. (2020). Children of the climate crisis a generation of kids faces a more dangerous world as they come of age in the era of eco-anxiety. Rolling Stone.
- O’Reilly, C. M., Gougis, R. D., Klug, J. L., Carey, C. C. (2017). Using large data sets for open-ended inquiry in undergraduate science classrooms. https://academic.oup.com/bioscience/article-abstract/67/12/1052/4582209
- Pihkala, P. (2017). Environmental education after sustainability: Hope in the midst of tragedy. Global Discourse, 7(1), 109–127. https://doi.org/10.1080/23269995.2017.1300412
- Prayoga, T., & Abraham, J. (2017). A psychological model explaining why we love or hate statistics. Kasetsart Journal of Social Sciences, 38(1), 1–8. https://doi.org/10.1016/j.kjss.2016.08.013
- Rodrigues, C. T. (2011). The method of scientific discovery in Peirce’s philosophy: Deduction, induction, and abduction. Logica Universalis, 5(1), 127–164. https://doi.org/10.1007/s11787-011-0026-5
- Rohrer, J. M. (2018). Thinking clearly about correlations and causation: Graphical causal models for observational data. Advances in Methods and Practices in Psychological Science, 1(1), 27–42. https://doi.org/10.1177/2515245917745629
- Rosenau, J. (2012). Science denial: A guide for scientists. Trends in Microbiology, 20(12), 567–569. https://doi.org/10.1016/j.tim.2012.10.002
- Rumsey, D. J. (2002). Statistical literacy as a goal for introductory statistics courses. Journal of Statistics Education: An International Journal on the Teaching and Learning of Statistics, 10(3), 123–138. https://doi.org/10.1080/10691898.2002.11910678
- Sinatra, G. M., Kienhues, D., & Hofer, B. K. (2014). Addressing challenges to public understanding of science: Epistemic cognition, motivated reasoning, and conceptual change. Educational Psychologist, 49(2), 123–138. https://doi.org/10.1080/00461520.2014.916216
- Soule, D., Darner, R., O’Reilly, C. M., & Bader, N. E. (2018). EDDIE modules are effective learning tools for developing quantitative literacy and seismological understanding. Journal of Geoscience Education, 66(2), 97–108. https://www.tandfonline.com/doi/abs/10.1080/10899995.2018.1411708
- Stern, P. C. (2012). Fear and hope in climate messages. Nature Climate Change. https://www.nature.com/articles/nclimate1610
- Thank, I., & Sinatra, G. M. (2022). Supporting climate change understanding with novel data, estimation instruction, and epistemic prompts. Journal of Educational Psychology, 114(5), 910–927.
- Woodbury, Z. (2019). Climate trauma: Toward a new taxonomy of trauma. Ecopsychology, 11(1), 1–8. https://doi.org/10.1089/eco.2018.0021
- Yu, C. H. (1994). Abduction? Deduction? Induction? Is there a logic of exploratory data analysis? ERIC. https://eric.ed.gov/?id=ED376173
- Zummo, L., Gargroetzi, E., & Garcia, A. (2020). Youth voice on climate change: Using factor analysis to understand the intersection of science, politics, and emotion. Environmental Education Research, 26(8), 1207–1226. https://doi.org/10.1080/13504622.2020.1771288