
ABSTRACT
Traditional methods of measuring attitudes usually consist of expressing the degree of agreement with a series of statements. In this paper, we test a new method to express attitudes through interactive metaphors. Primary school students set the distance and physical size of objects (visual representations of school subjects) using a digital application. During this task, they communicated their understanding of the distance and physical size of the object. Distance was most often interpreted by respondents as a metaphorical expression of liking, with objects closer perceived as more likeable. Size was most often interpreted as a metaphor expressing importance and usefulness, with positively rated objects being expressed as larger. Additionally, we investigated whether increasing the size and decreasing the distance are related to a more positive verbal evaluation of the object. The results supported our predictions, and they are also consistent with previous research findings on metaphor mapping, primary metaphors, and the relationship between physical size and importance.
Introduction
The size and distance of an object are crucial pieces of information that every human being processes from an early age (see, e.g., Day & McKenzie, Citation1981; Granrud, Citation2006). For infants, the distance of an object carries important information (e.g., if the mother is far away, it also means that food is far away). The size of an object can indicate its importance (e.g., parents are large and important objects) or the degree of threat it possesses (e.g., a fly is not as threatening as a dog). Size also carries an essential piece of information about quantity (e.g., a larger pile of sweets is more appetizing than a smaller one). Dangerous objects (e.g., threatening animals) are better kept at an appropriate distance, whereas desirable and positively appraised objects (e.g., food and resources) are better to keep close by (Bowlby, 1969, as cited in Williams & Bargh, Citation2008).
From the perspective of cognitive linguistics (Dancygier & Sweetser, Citation2014; Lakoff & Johnson, Citation2003), various aspects of the experience we gain throughout our lives serve as source domains underlying primary conceptual metaphors, which are modes of thinking that are anchored in everyday experience and inform the use of language as well as our perception of the world. In relation to the primary metaphors, Langacker (Citation1988) introduced the concept of “image schemas,” which represents the basic mechanism through which the metaphors develop. Our physical experience forms conceptual categories that are mapped to our mental experience based on the isomorphy (similarity or identity of form, shape, or structure) of a physical object and its mental representation (Tang, Ye, & Du, Citation2015). In other words, physical experience informs our abstract categories, and primary metaphors arise from a direct correlation between different dimensions of our repeated embodied experience (e.g., warmth or closeness corresponds to affection). This mechanism creates a mental link between two conceptual domains, transforming a physical experience into a mental category. This process has a strong neurological basis, as it depends on repeated simultaneous activations of multiple brain regions (Deng, Guinote, Li, Cui, & Shi, Citation2021).
From the psycholinguistic point of view, closeness and distance can be considered a conceptual orientational metaphor (based on the perception of physical space), and it is important to note that statements concerning interpersonal relationships often involve the metaphor of distance (e.g., “a close friend of mine”), that is, physical closeness often implies personal closeness (Lakoff & Johnson, Citation2003). This is in line with Johnson (1997, as cited in Lakoff & Johnson, Citation2003), who argued that conceptual metaphors are embodied experiences that develop from childhood due to the conflation of two conceptual domains (e.g., “physical heat is personal warmth” or “seeing is knowing”), and saw a frequent co-occurrence of both domains together in a use of language as the result of this conflation (see also Johnson, 1997, as cited in Dancygier & Sweetser, Citation2014).
Although psycholinguistics describes how conceptual metaphors, such as distance or size, inform the use of language and thinking, these metaphors have also been used to measure attitudes indirectly in the area of psychological assessment. For example, the Bogardus Social Distance Scale was designed to indirectly measure attitudes and prejudices toward homogeneous groups of people, especially minorities (Wark & Galliher, Citation2007). This scale asks respondents to verbally express how socially and spatially close they would tolerate the presence of a group member.
One of the more recent studies (Kundrát & Rojková, Citation2021) used a rationale similar to that of Bogardus but utilized the visual metaphor of distance to explore the relationship between distance and evaluation. Respondents placed school-related concepts (e.g., “mathematics,” “school” or “classmates”) in a picture evoking the proximity and distance through linear perspective. The authors found a relationship between psychological distance, represented by spatial distance, and positive-negative verbal evaluation, with positively evaluated concepts being placed closer. Similar efforts using the metaphor of spatial distance have been made in the past. For example, Salzmann and Grasha (Citation1991) as well as Grasha and Homan (Citation1995) used visual metaphors of interpersonal distance and size. More specifically, they let participants draw circles representing other people on a sheet of paper and focused on the attributes of these drawings, such as size or position. They interpreted the distances between the circles as indicators of the closeness of interpersonal relationships, and the sizes of the circles as indicators of the power and importance of a person.
Previous studies also found that people place negatively perceived objects farther away, communicating the need to distance themselves from them (Kundrát & Rojková, Citation2021; Marmolejo-Ramos, Arshamian, Tirado, Ospina, & Larsson, Citation2019). In both cited studies, respondents placed concepts (represented by words) in proximity or distance, depending on how they thought or felt about them. Marmolejo-Ramos, Arshamian, Tirado, Ospina, and Larsson (Citation2019) used a three-dimensional cube, and respondents could point at different locations within the cube with a finger to position various concepts (e.g., names of animals, materials, or sounds). The results of both studies suggested that people tend to interpret the distance-proximity dimension in the expected way, that is, liking, positive attitudes, and pleasant emotions are expressed by placing the object closer while disliking, negative attitudes, and unpleasant emotions are expressed by placing the object farther away. Furthermore, Marmolejo-Ramos, Arshamian, Tirado, Ospina, and Larsson (Citation2019) argued that the placement of emotionally valenced concepts in space can be used to assess emotional disorders.
The tendency to perceive proximity and distance as means of expressing positive and negative appraisal is consistent with conceptual metaphors (e.g., “closeness is intimacy;” see Dancygier & Sweetser, Citation2014) but also with the approach-avoidance effect. For example, a strong association was observed between forward movements (gestures) and words with positive connotations and between backward movements (directed away from an object) and words with negative connotations (Balcetis, Citation2016; Solarz, Citation1960). A similar effect was also observed in the area of interpersonal perception by Wang and Yao (Citation2016), who investigated the effect of physical distance between people on interpersonal attitudes and found that greater distance implied more negative attitudes, while greater proximity implied more positive attitudes.
In the case of size, several robust findings regarding conceptual metaphors have been described, such as “up is power and control” or “size is strength” (Lakoff & Johnson, Citation2003). Experimental studies also showed that physical size is closely related to the perception of power (Deng, Guinote, Li, Cui, & Shi, Citation2021; Tang, Ye, & Du, Citation2015). Not surprisingly, a large person is usually perceived as more formidable and threatening, as they can have an overwhelming physical effect on others (Bailey, Caffrey, & Hartnett, Citation1976; Wilson, Hugenberg, & Rule, Citation2017). Physical size in humans can imply power and the ability to solve problems, as evidenced by the results of the US presidential elections, where the taller candidate tends to win far more often than the shorter one (Boller, Citation1984). Additionally, in experiments involving forced choice, respondents were more likely to prefer (i.e., rate more positively) larger objects (geometric shapes and alphanumeric symbols) over smaller ones (Silvera, Josephs, & Giesler, Citation2002). There are many other authors (see, e.g., Coulter & Coulter, Citation2005; Hasegawa, Citation2020) who investigated the relationship between the physical size of an object and perceived value, and the larger-is-more-valuable principle has been repeatedly supported. Therefore, physical size seems to imply a range of meanings that influences our thinking and behavior.
In the current study, we investigate whether respondents can express their attitude toward objects by manipulating their distance and size. The study design is novel in several aspects: (a) participants could change both the distance and size of the displayed objects as both metaphors were present together in an interactive software environment; (b) the conceptual metaphors of distance and size were presented visually on a computer screen so that participants could change the properties of the displayed objects continually instead of having to choose from a limited number of options.
The main research questions of this study are as follows. What interpretations of the distance and size of the object do the participants express? Do the interpretations of the two metaphors differ? Is there a relation between an overall verbal evaluation of an object and its distance and size, as set by the participants?
Building on our previous research, we expect the following: (a) negatively perceived objects will be positioned farther away and positively perceived objects closer; and (b) participants will increase the size of objects that they deem more important but decrease the size of the ones they perceive as less important.
Method
Participants
The sample consisted of 74 students from three public Czech elementary schools between 12 and 15 years of age. This population was chosen because this study is part of a research project whose ultimate goal is to develop and validate a novel instrument that uses interactive visual metaphors to assess schoolchildren’s attitudes. Furthermore, multiple studies (discussed below) found that older children did not differ from adults in the ability to understand metaphors.
There were two main criteria for participation. First, the participants had to be able to use a standard personal computer with a mouse. As a result, visually impaired students were generally not eligible to participate. Second, they needed to attend a standard full-time education. Consequently, students with individualized, nonstandard education plans were not included.
In terms of cognitive development, we consider that the age of the respondents is sufficient to understand the metaphors to be studied. For example, Xiaoling and Jun (Citation2020) found that children as young as five years of age understand metaphors and can use them to communicate, although Johnson (1999, as cited in Dancygier & Sweetser, Citation2014) argued that this ability is not developed until eight years of age. However, Di Paola, Domaneschi, and Pouscoulous (Citation2020) found that some children as young as three years old can understand metaphors. Furthermore, multiple studies (see, e.g., Pouscoulous, Citation2011, for a review) have shown that there is no significant difference between teenagers, adolescents, and adults in the use and understanding of metaphors. Since we aim to create an instrument that can be used for the assessment of attitudes in school children and the existing studies suggest that older children understand metaphors similar to adolescents or adults, our study included older schoolchildren as participants.
shows the composition of the sample in terms of gender and school grade. Eighteen students (24%) were selected from a rural school (population approximately 5,000), 32 (43%) from a school in a small town (population approximately 25,000), and 24 (33%) from a school in a city (population approximately 300,000).
Table 1. Demographic characteristics of the research sample.
Consent to participate in the research was obtained in three steps. First, we contacted the school management to obtain approval for the study. Subsequently, we obtained informed consent from the parents or other legal guardians of the students. Finally, the students themselves could decline or accept to participate in the study.
All parties involved were informed about the general aspects of the study. More specifically, we communicated to the respondents the intention to explore attitudes toward school subjects and the use of distance and size metaphors in the assessment process. Furthermore, participants were informed that the data provided would be anonymized and not shared with other parties.
Data collection
The research procedure involved a series of experimental sessions between a researcher and a participant, who interacted with the software application. Readers who are interested to try the application themselves can access its demo version through the following link: https://ai.vsb.cz/eds/test/pd3/.
The software allowed participants to manipulate the distance and size of two-dimensional objects on the screen (from now on, in the Method and Results section, we refer to these attributes of objects that were manipulated by participants through the software as “Size” and “Distance”). The objects were presented one at a time. In all cases, the object presented was a name of a single school subject (e.g., “Mathematics”) and it was displayed in non-stylized font without serifs. Each object was displayed in its default position, i.e., in the bottom center of the screen (see , panel A). The default position and size were identical for each concept displayed. We call the stimulus image a semi-projective material because it involves projecting the content of the human mind onto external objects, but it is more highly structured and guided than “fully” projective tests, such as the Rorschach test.
Figure 1. A school subject (“Mathematics”) in varying distances and sizes.
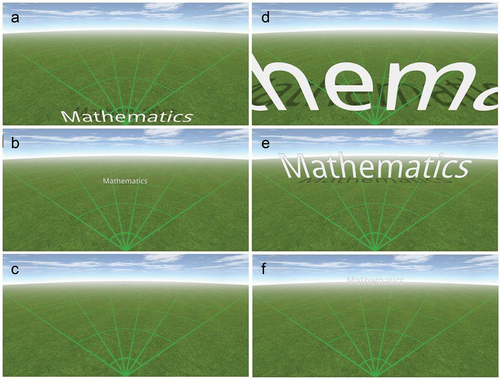
Subsequently, respondents placed the concept in semi-projective material, and the size of the object could not be changed in this step. After confirming the placement of the object by clicking on the appropriate button, respondents could resize the concept. After confirming the size of the concept, another school subject was displayed. Each respondent evaluated a total of seven school subjects (Czech language, mathematics, English language, history, physics, geography, and art education).
The first task was to change the distance of the object. The two-dimensional font was displayed in front of a semi-projective background that offered several visual cues for depth (distance) perception, including perspective and texture gradient (see ). A researcher instructed the participant that they could change the distance of the object. The exact instruction was as follows: By dragging the mouse, place the object on the screen depending on how close or distant it appears to you. When respondents asked about the meaning of Distance or requested confirmation of their interpretation of Distance, they received a general response that this was not something the researcher could decide for them. If the respondent asked, for example, Should I place the name of the object in the distance and express that I don’t like it?, the researcher responded: If you feel that way or It’s up to you. When the respondent finished placing the object, they finalized their choice by clicking the confirmation button. The researcher then asked why the respondent placed the object the way they did and what the chosen proximity or distance meant to the respondent. In the remainder of the text, we refer to the respondent’s answer to the researcher’s question as a “statement.” Since 74 respondents commented on 7 school subjects, the total number of statements was 74 × 7 = 518.
The second task was to adjust the size of the object. After the respondents finished placing the object in space, they were asked to explain their placement and then set the size of the object. The instruction to change the size was again worded in such a way that it did not impose any external interpretation. The researcher told the respondent: You can now make the object larger or smaller. The image in shows “Mathematics” positioned at different distances, with the left column of images showing the object at its default size and the right column of images showing the object at its maximum size.
Similarly to the presentation of the distance task, the researcher answered any questions about the meaning of Size only in general terms to avoid imposing any interpretation on the respondent. Enlarging or shrinking the Size of the object was controlled with the mouse wheel. When the respondent finished setting the size and was satisfied with their choice, they finalized it by pressing the confirmation button. The researcher asked the respondent what the set Size meant to them and what the reason was for making the object larger or smaller (or keeping its original size). This information supplemented the statement made by the respondent.
All interviews with the respondents were recorded on audio. Subsequently, all statements made by respondents were transcribed into a spreadsheet for analysis.
Data analysis
Qualitative analysis
Four independent coders conducted a qualitative analysis of the data. This analysis consisted of three stages.
The first stage included a qualitative analysis of the statements related to Distance and Size. The statements related to each metaphor were examined separately. Four independent coders were instructed to focus on the explanations the respondents gave as to why they placed the school subject or set its size as they did. The coders analyzed the interviews and created their own system of categories. The thematic analysis itself was a two-stage process. Initially, first-order categories (less general and rich in contextual details) were created. Then, a second-order categorization was conducted. That is, more abstract and less context-dependent categories were constructed. Each coder compiled their own list of categories along with the inclusion and exclusion criteria that determined which statement belongs to which category. Finally, the researchers compared the category systems they created to sort the content of the messages and then agreed on the final list of main categories, or themes. Thus, the main result of this stage was a set of themes (i.e., the most abstract categories) exemplified by statements from multiple respondents. Examples of statements and first- and second-order categories that were derived from them are shown in (see also in the Results section, for the final themes and their examples).
Table 2. Examples of statements and first- and second-order categories derive from them.
Table 3. Themes and their occurrence in response to the metaphor of Distance.
Table 4. Themes and their occurrence in response to the metaphor of Size.
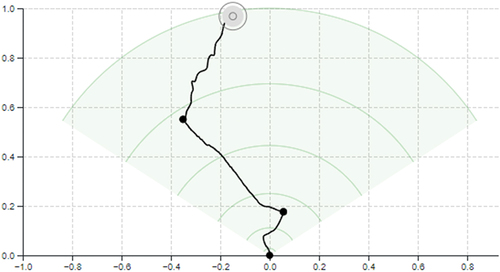
When creating the categories, the coders relied on the transcripts of the interviews, audio recordings, and software output. shows an example of the graphical output of the research software that captures the motion that the respondent made with a computer mouse when placing the object. The software also records the response time of the respondent. The black dots signify the moments of hesitation when the respondent did not make any input, and the movement of the concept along the semi-projective material is shown by the solid black line. The summary of the response process, together with audio-visual recordings of the interview, provides additional data and context for a qualitative analysis of the respondents’ statements.
Figure 2. Graphical output of the research software.
It was common for multiple themes to be identified in a single statement (for example, in the statement I placed the subject far away because I don’t like the teacher and the subject is difficult, two themes were identified, namely Liking and Teacher Perception). In the case of long or complicated statements, the analysts could re-read the transcript multiple times or even listen to the original audio recordings to better identify the themes it could contain.
The second stage included independent identification of the themes in the statements of the participants. This stage was carried out by three new coders who were not involved in the previous stage (i.e., they did not participate in the process of creating the themes). They identified the themes independently, and the level of agreement between the coders was estimated.
In the third stage, the same coders as in the second stage determined whether the overall verbal evaluation expressed in each statement was positive, mixed/neutral, or negative. A positive verbal evaluation meant that the respondent viewed the school subject entirely favorably, described it as enjoyable, important, useful, and/or manageable (e.g., This subject is very important for the high school admission exams), and made no negative remarks. On the contrary, a negative verbal evaluation meant that the respondent viewed the school subject strictly unfavorably and described it as boring, useless, annoying, and tedious (e.g., This subject is entirely pointless, I found no use for it in my life). Finally, a neutral/mixed verbal evaluation was coded if the statement did not contain any explicit evaluation or if the evaluation was mixed (e.g., This subject is very important, but I don’t like it so much). The general verbal evaluation was then related to the variables obtained with the interactive software (object Size and Distance, expressed as a numerical variable).
Statistical analysis
We analyzed the data in R, a free software environment for statistical computing and graphics (version 4.0.2; R Core Team, Citation2016) using the tidyverse package (version 1.3.0; Wickham et al., Citation2019) for data manipulation and visualization, the raters package (version 2.0.1; Quatto & Ripamonti, Citation2014) to estimate inter-rater agreement, and the emmeans package (version 1.5.2–1; Lenth, Citation2020) to compare the effects of metaphors on eliciting different themes (i.e., to compare the metaphor with respect to the probability of “eliciting” each theme).
First, we computed the frequency of each theme separately for Size and Distance. As all three coders analyzed all statements, we considered a theme “present” if at least two of the three coders identified it in the statement; otherwise, it was considered “absent.” Second, we computed the Fleiss’ Kappa coefficient to assess the inter-rater agreement on the identification of themes and the overall verbal evaluation. Third, we report the frequency of each theme depending on the metaphor and the school subject. Fourth, we estimated six logistic regression models (one for each theme) that predicted the presence of a theme in a statement based on (a) the metaphor, (b) the school subject to which the statement was related, and (c) their interaction. We were mainly focused on the metaphors’ propensity to elicit different themes. Therefore, for each model, we report only the regression coefficient corresponding to a variable distinguishing between metaphors, more precisely, the derived odds ratios with their 95% confidence intervals. This is supplemented by the Wald Z-test of significance of the regression coefficient (i.e., the test statistic and the corresponding p-value). Furthermore, we provide the predicted probabilities of theme occurrence with their 95% confidence intervals for each metaphor separately and considering all school subjects. However, the reader can still explore the differences between school subjects by inspecting the line charts. Finally, we explored the relationship between the overall verbal evaluation and the main variables measured by the software (i.e., the values of Size and Distance).
Results
First, we present the results of the initial stage of the qualitative analysis and describe the themes that we identified together with sample statements. Second, we present the results of retrospective coding, as a new set of independent coders categorized all the statements according to the system of themes developed previously. Finally, we present data related to the overall verbal evaluation and its relationship with the values of Distance and Size.
Thematic analysis
During the two-stage thematic analysis, several themes related to Distance and Size were identified. The data contained information indicating to which metaphor the statement was related, but ultimately the themes elicited by both metaphors overlapped. As show, the same theme occurred for both metaphors, albeit with a different frequency. Therefore, all themes are presented together.
Importance
This theme dealt with the perceived value of the school subject. The coders agreed that two criteria defined this theme. First, the respondent explicitly mentioned the general importance, relevance, or necessity of the subject (e.g., I have to improve my English a lot because this language is the most important in today’s world.). Second, the subject was considered crucial for the personal development of the respondent, their career plans or hobbies (e.g., Science is important because I want to apply for a biology class, so I want to know it well.)
Usefulness
This theme was related to the practical application of the knowledge and skills provided by the subject (e.g., English is very useful when we want to travel somewhere). The defining criterion was to reference applicability outside of the school context or the lack thereof (i.e., statements about the subject being of no use outside the classroom and tests). What differentiated Usefulness from Importance was whether the respondent mentioned a specific application of learnt knowledge or skills; general statements about the importance of the subject were coded as Importance, not Usefulness. For example, English is important because it’s a part of the final exams was coded as Importance only, I want to improve my English so I can travel abroad and have no difficulties communicating with other people there was coded as Usefulness only, and English is important because I want to study it, but I would also like to live and work abroad was coded as both Importance and Usefulness. Nevertheless, we perceive these themes as especially close in meaning, and an argument could be made to merge them into one.
Liking
Statements about liking or disliking the subject occurred the most frequently. This theme encompasses multiple subcategories of meaning: (1) attractiveness of the subject, in the sense of liking or aversion (e.g., I really don’t like physics, it’s a terrible subject); (2) how interesting is the knowledge acquired (this may conflict with the teaching system, e.g., Although I don’t like the teacher, geography is an interesting subject where we learn a lot of new things); (3) positive or negative emotional relationship (e.g., I love art class where I can express myself creatively).
Teacher Perception
was another common theme that was reflected upon in the interviews (e.g., I placed the subject close because I like the teacher of that subject, she’s just great). The key criterion was an explicit mention of an attitude toward the teacher as a person or their teaching methods, not the subject taught or any other context.
Difficulty
This was a relatively “straightforward” theme that included statements about how difficult or easy the subject is to learn (e.g., Physics is the most difficult subject in school. Just the formulas and calculations are difficult and not easy to remember.)
Mastery
The last theme represents the Mastery of the subject by the respondent, in other words, evaluation of own competence regarding the subject. As such, this theme refers to self-perceived skills, aptitudes, abilities, or other prerequisites (or lack thereof) to master (or fail) the subject (e.g., I am generally good at languages, I got it from my parents; or I am completely stupid at mathematics). The explicit mention of the self as an actor in the learning process (not simply stating that the subject was easy or difficult) differentiated this theme from Difficulty.
Quantitative analysis
We present the frequencies of each theme separately for comments regarding the Distance and Size metaphors. show the frequencies of each theme in all statements related to the Distance and Size metaphor, respectively. Three independent coders in total rated all statements, and a theme was considered present if at least two coders identified it in the statement. However, if only one coder identified it but the other two did not, it was considered absent. Often, more than one theme was identified in a single statement. That is why the relative frequencies do not sum up to 100% and the absolute frequencies do not sum up to 518 (the total number of statements).
The inter-rater reliability (i.e., Fleiss’ Kappa coefficient of inter-rater agreement) for the identification of themes is presented in . As you can see, the agreement on the presence or absence of a theme between the raters was substantial (Fleiss’ Kappa coefficients ranged from .65 to .89).
Table 5. Inter-rater reliability for each theme and metaphor.
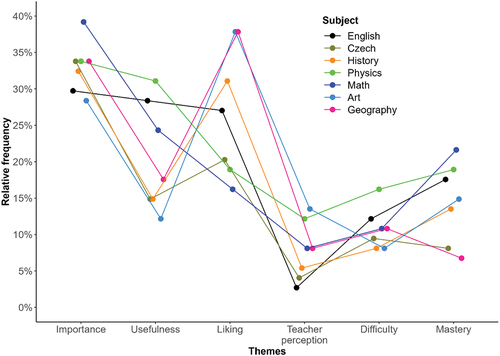
show the relative frequencies of the themes for each subject in response to the metaphor of Distance and Size, respectively. As you can see, the Liking theme shows a clear peak for the metaphor of Distance, whereas the Importance theme shows a peak for the metaphor of Size.
Figure 3. Relative frequencies of themes related to Distance for each school subject.
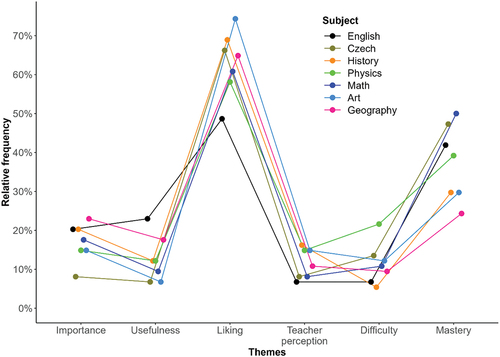
Figure 4. Relative frequencies of themes related to Size for each school subject.
shows the comparison between the metaphors in the predicted probability of each theme. As you can see, respondents were more likely to mention Importance and Usefulness of the school subject when talking about Size (compared to Distance). Specifically, the odds were 2.51 (95% CI [2.11, 2.98]) times higher for Importance and 1.86 (95% CI [1.51, 2.29]) times higher for Usefulness. However, when talking about Distance (compared to Size), they were more likely to mention Liking and Mastery, as well as Teacher Perception. Compared to the metaphor of Size, the odds of mentioning Liking, Mastery, and Teacher Perception when talking about Distance were 4.89 (95% CI [4.18, 5.72]), 3.73 (95% CI [3.10, 4.48]), and 1.67 (95% CI [1.27, 2.18]) times higher, respectively. There was essentially no difference between the metaphors in the probability of mentioning Difficulty.
Table 6. Analysis of the metaphors’ propensity to elicit different themes using logistic regression.
Finally, the boxplots in show the relationship between the overall verbal evaluation and the values of both metaphors (i.e., the final Distance and Size values set by the respondents and captured by the research software). As can be seen, there is a clear trend in the data: More positive overall attitudes toward school subjects are related to increased Size but decreased Distance.
Figure 5. The relation between verbal evaluation and the values of Size and Distance.
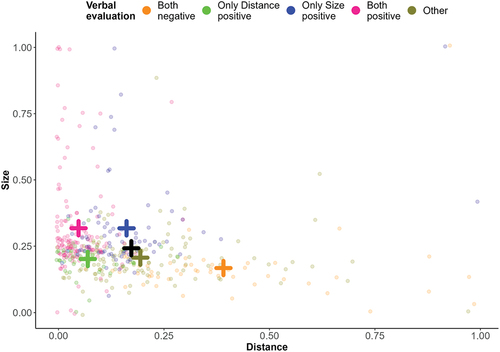
One of the reviewers suggested exploring the combined effect of Distance and Size to test whether each metaphor exerts an independent effect on the verbal evaluation. This is important in order to verify that these effects are not conflated with each other, providing evidence that Distance and Size are distinct metaphors. Therefore, we categorized the verbal evaluation for both metaphors into five groups where: (a) the verbal evaluation was negative for both Distance and Size; (b) the verbal evaluation related to Distance was positive, but negative or mixed/neutral for Size; (c) the verbal evaluation relevant to Size was positive, but negative or mixed/neutral for Distance; (d) the verbal evaluation related to both metaphors was positive; and (e) the verbal evaluation was mixed/neutral for both metaphors or negative for one metaphor and mixed/neutral for the other.
shows a scatterplot of Distance and Size values (set by the respondents) with the verbal evaluation (as defined previously) mapped to color. Several things can be seen. When the verbal evaluations for both metaphors were negative, Size values tended to be the lowest (i.e., “smallest”), while Distance values tended to be the highest (i.e., “farthest”) of all groups. Size values tended to be the highest (i.e., “largest”) when the verbal evaluation of Size or both Size and Distance was positive. When only the verbal evaluation of Distance was positive, Distance values tended to be low (i.e., “closer”), but Size values did not tend to be high. Similarly, when only the verbal evaluation of Size was positive, the Size values tended to be high (i.e., “larger”), but Distance values did not tend to be low. All in all, this shows that both Distance and Size are related to the verbal evaluation even after the effect of the other metaphor is taken into account.
Figure 6. Scatterplot of Distance and Size values with color based on verbal evaluation.
General discussion
The purpose of our study was to investigate the use of interactive visual metaphors of distance and size to evaluate school subjects. The current study builds upon and extends a previous study (Kundrát & Rojková, Citation2021), which focused only on the metaphor of distance and its relation to evaluation. The present study extends the previous results by making use of innovative software and including the metaphor of size in addition to distance. Using qualitative analysis of interviews with students, we identified six central themes. Then, independent coders identified the themes in the recorded statements. Furthermore, we observed that respondents always assumed an evaluative stance when interacting with the metaphors of distance and size. Consistent with previous results, we thus confirm that both metaphors, distance and size, imply an evaluative context.
Respondents associated proximity with a higher positive evaluation and distance with a more negative evaluation when placing objects on a continuous dimension from “near” to “far away.” This result is consistent with an experimental study by Wang and Yao (Citation2016). However, they also explored the effect of size (using pictures of people as stimuli) on favorability judgment and found no significant effect. In comparison, the respondents in our study enlarged the objects that were rated positively and reduced the size of objects that were rated negatively. Furthermore, neither were positively evaluated objects placed higher nor were negatively evaluated objects placed lower (in terms of the vertical dimension), although this pattern was observed in a study by Meier and Robinson (Citation2004). However, in our task, the objects placed farther away always appeared to be positioned higher on the screen than the closer ones, but still received negative evaluations. The inconsistency with the findings of Meier and Robinson could be explained by the fact that we used visual cues (such as a linear perspective) to create a sense of depth of the visual field. The objects under study also appeared smaller when moved farther away (higher on the screen) to mimic the appearance of a moving object in the “real” world, as objects moving away from us appear smaller and objects moving toward us appear larger, although their real physical size does not change. As a result, participants probably interpreted the vertical position as indicating proximity and distance, not “elevation.”
There are not many measurement instruments that use semi-projective principles. However, the Grasha-Ichiyama Psychological Size and Distance Scale (Grasha & Homan, Citation1995; Salzmann & Grasha, Citation1991) is one of the few exceptions. Although the scale uses visual metaphors to evaluate people (not school subjects) and introduces the interpretation of metaphors beforehand, the results of our study support the rationale of this instrument, since they show that people are inclined to interpret visual metaphors and use them to express their opinion in the expected way even without explicit instructions given beforehand.
In the first part of our study, we identified six main themes (Importance, Usefulness, Liking, Teacher Perception, Difficulty, and Mastery) through qualitative analysis of respondents’ statements. It is highly likely that the objects under investigation influenced the themes that were identified because the characteristics that are salient clearly differ for different types of objects. In other words, school subjects could evoke specific evaluation categories (e.g., Difficulty, Liking, etc.) in pupils. In other words, had other types of stimuli been chosen (e.g., possible romantic partners, home appliance, political parties, or celebrities), different themes would probably have “emerged” when manipulating distance and size, as it would be unrealistic to assume that the salient evaluative dimensions remain the same regardless of what or who is evaluated. However, some themes appear more general (e.g., Liking or Importance) than others (e.g., Difficulty or Teacher Perception), since previous studies (Coulter & Coulter, Citation2005; Hasegawa, Citation2020) also found Liking and Importance to be the most frequent themes.
For both distance and size, we identified the same set of themes, although they were induced by two different visual metaphors. However, the frequency of occurrence of most themes differed between visual metaphors. Specifically, the theme of Liking occurred more frequently in relation to distance, whereas the theme of Importance occurred more frequently in relation to size, although the stimulus words were identical.
From the perspective of primary metaphor theory and research, our results support the notion that the evaluation of an object is strongly related to the orientational metaphor in the domain of distance (i.e., physical closeness means liking and positive psychological appraisal, whereas physical distance means disliking and negative psychological appraisal) as well as the domain of size (i.e., larger physical size is positive, smaller physical size is negative). Furthermore, conceptual metaphors, such as “closeness is liking,” “closeness is mastery,” or “size is importance,” were frequently identified in the statements of the participants.
We see the main contribution of our study to the research of conceptual metaphors in the introduction of a novel method to induce metaphors by means of interactive visual stimuli whose features can be easily manipulated. Furthermore, we used mixed-methods research, combining qualitative and quantitative methods, to explore metaphors in the natural context of the school environment. Data collection was carried out directly in the school setting, and the object of measurement (attitudes toward school subjects) was highly relevant for this context, which should increase ecological validity of our study. As a result, our study complements the experiments already conducted by illustrating the use of metaphors in the practice of educational assessment.
Furthermore, we used innovative software that allows interactive visualization of visual metaphors. Unlike previous research (Kundrát & Rojková, Citation2021), the present study employed interactive software that allowed participants to immediately alter the size of the displayed object, which is not possible with the pencil-and-paper method. In addition, respondents did not need to answer forced-choice items, which could create discomfort, but expressed their attitudes metaphorically on a continuous scale offered by the interactive semi-projective environment.
However, it should be noted that our approach might have influenced the responses in some ways. The research software presented the two metaphors immediately one after the other, and the instructions for working with interactive metaphors did not explicitly specify whether the respondents were to perceive the metaphors of distance and size separately or as a joint evaluation of the same concept, so that the respondents were neither encouraged nor discouraged to differentiate between the metaphors. Additionally, the researchers never commented on the nature of individual interpretations. Consequently, the interpretation of one metaphor might have influenced the other. However, doing otherwise might have biased the results nonetheless, as respondents could feel obligated to assign each metaphor a different meaning.
The interactive metaphor of distance was predominantly interpreted as implying liking or disliking the object. The second most frequently mentioned theme was the Mastery of the subject, that is, a self-perceived personal competence to excel in the subject. This theme was identified in more than a third of the statements examined. Future studies could, for example, investigate whether greater mastery leads to greater liking of the subject. Although this interpretation greatly oversimplifies the relationship between subject liking and mastery, the relationship between these two fundamental concepts is not disputed in the literature (Hulleman & Harackiewicz, Citation2009; Lavrijsen et al., Citation2021). However, longitudinal studies are needed to test whether increasing mastery makes the subject more liked over time or vice versa, whether liking the subject leads to increased mastery (because student can, e.g., invest more time into learning the subjects they like than the ones they dislike).
For the metaphor of size, the dominant theme was Importance, which was identified approximately in one-third of the statements related to it. If we combined it with Usefulness, which is a theme semantically very similar to Importance, the occurrence of both themes would be even higher. However, by combining Importance and Usefulness only for the metaphor of distance, these two themes would occur together in less than a third of all statements. This shows that each metaphor elicits similar themes but with different probability, since the respondents and the school subjects under investigation remained the same. In summary, the metaphor of size elicited the themes of Importance and Usefulness more frequently, whereas the metaphor of distance elicited the themes of Liking, Mastery, and Teacher Perception more often. All of these differences were statistically significant and, in terms of effect size, the largest differences between the metaphors were found for the themes of Importance, Liking, and Mastery.
In many cases, the statements contained multiple interpretations of a single metaphor. To provide an illustrative example, the following composite statement about mathematics was coded for Importance and Teacher perception: I will place the subject somewhere in the middle because it is important, but not too close because I don’t like the teacher. In such cases, the researcher identified multiple interpretations and coded them appropriately.
One of the limitations of our study is that we examined only an overall verbal evaluation, although we could have coded, for instance, whether a statement implied low, medium, or high Importance, Usefulness, Liking, etc. However, this would be very demanding and beyond the scope of our study; therefore, we choose not to do so. Nevertheless, we admit that this line of investigation could provide interesting results and we plan to pursue it in future studies. Two other important limitations of our study should also be mentioned. The order of tasks as well as the default distance and size of objects were constants. The reason for this is that the software we have used is intended to provide a new measurement instrument of attitudes in schoolchildren, which requires standardized conditions. However, it is possible that the placement of an object on the screen could also be affected by the initial position in which the object was displayed at the beginning of the task (in the bottom center) and from which it could be moved into another position on the screen. Therefore, future studies could investigate whether the default position or size of the object on the screen has an effect on the final placement and size selection. However, we believe that this limitation did not influence our results because we did not interpret the absolute values of distance and size, only relative differences between the groups (defined by verbal evaluation of objects). Furthermore, even though the tasks were not counterbalanced and the participants always set the distance before setting the size, the results showed that the verbal evaluation regarding size varied in the expected way regardless of distance.
In summary, we explored the possible interpretations of the distance and size metaphors through mixed-method research. Our approach used a unique software application to visualize distance and size metaphors through semi-projective material. The results showed that the distance and size metaphors elicit similar themes but with different probability. Furthermore, people seemed to project their attitudes into both the distance and the size of objects when asked to manipulate these attributes metaphorically. Specifically, they increase the size and decrease the distance of objects (or rather the visual representation of objects, to be precise) that they regard positively, but decrease the size and increase the distance of objects that they think negatively about. Our findings also support the applicability of our method in the field of psychological and educational assessment. However, it remains to be empirically tested if it provides any advantages compared to standard objective tests that measure attitudes directly. So far, we have obtained only anecdotal evidence from the feedback of students that they find it more engaging, enjoyable, and offering a higher level of psychological safety due to its interactivity, electronic administration, and less direct nature. Although, the study was deliberately conducted in a sample of schoolchildren because it is the primary population in which the instrument is intended to be used, we see no obstacles in using our instrument or a similar approach in adults.
CRediT author statement
Josef Kundrát: Conceptualization, Methodology, Formal analysis, Resources, Supervision, Funding acquisition, Writing – Original Draft. Karel Rečka: Data curation, Formal analysis, Visualization, Validation, Writing – Review & Editing. Karel Paulík: Investigation, Formal analysis, Data Curation. František Baumgartner: Investigation, Formal analysis, Data Curation. Marek Malůš: Investigation, Formal analysis, Data Curation. Lenka Skanderová: Software, Data Curation. Tomáš Fabián: Software, Data Curation. Jan Platoš: Data Curation. Martina Litschmannová: Writing – Review & Editing, Visualization, Methodology, Data Curation. Adéla Vrtková: Writing – Review & Editing, Visualization, Methodology, Data Curation. Tereza Benešová: Methodology, Writing – Review & Editing.
Acknowledgments
On behalf of the entire authors’ team, we would like to thank both anonymous reviewers for their insightful comments, which helped us to significantly improve our paper. Based on the comments of Reviewer 1, the Results section has been expanded.
Disclosure statement
No potential conflict of interest was reported by the authors.
Additional information
Funding
References
- Bailey, K. G., Caffrey, J. V., & Hartnett, J. J. (1976). Body size as implied threat: effects on personal space and person perception. Perceptual and Motor Skills, 43(1), 223–230. doi:10.2466/pms.1976.43.1.223
- Balcetis, E. (2016). Approach and avoidance as organizing structures for motivated distance perception. Emotion Review, 8(2), 115–128. doi:10.1177/1754073915586225
- Boller, P. F. (1984). Presidential campaigns. Oxford: Oxford University Press.
- Coulter, K. S., & Coulter, R. A. (2005). Size does matter: The effects of magnitude representation congruency on price perceptions and purchase likelihood. Journal of Consumer Psychology, 15(1), 64–76. doi:10.1207/s15327663jcp1501_9
- Dancygier, B., & Sweetser, E. (2014). Figurative language. Cambridge: Cambridge University Press.
- Day, R. H., & McKenzie, B. E. (1981). Infant perception of the invariant size of approaching and receding objects. Developmental Psychology, 17(5), 670–677. doi:10.1037/0012-1649.17.5.670
- Deng, M., Guinote, A., Li, L., Cui, L., & Shi, W. (2021). When abstract concepts rely on multiple metaphors: Metaphor selection in the case of power. Social Cognition, 39(3), 408–435. doi:10.1521/soco.2021.39.3.408
- Di Paola, S., Domaneschi, F., & Pouscoulous, N. (2020). Metaphorical developing minds: The role of multiple factors in the development of metaphor comprehension. Journal of Pragmatics, 156, 235–251. doi:10.1016/j.pragma.2019.08.008
- Granrud, C. E. (2006). Size constancy in infants: 4-month-olds´ responses to physical versus retinal image size. Journal of Experimental Psychology, Human Perception and Performance, 32(6), 1398–1404. doi:10.1037/0096-1523.32.6.1398
- Grasha, A. F., & Homan, M. (1995). Psychological size and distance in the relationships of adult children of alcoholics with their parents. Psychological Reports, 76(2), 595–606. doi:10.2466/pr0.1995.76.2.595
- Hasegawa, K. (2020). The size-value compatibility effect. Scientific Reports, 10(1), 5383. doi:10.1038/s41598-020-62419-8
- Hulleman, C. S., & Harackiewicz, J. M. (2009). Promoting interest and performance in high school science classes. Science, 326(5958), 1410–1412. doi:10.1126/science.1177067
- Kundrát, J., & Rojková, Z. (2021). Psychological distance as a means of evaluation. New Ideas in Psychology, 63, 100900. doi:10.1016/j.newideapsych.2021.100900
- Lakoff, G., & Johnson, M. (2003). Metaphors we live by. Chicago: University of Chicago Press.
- Langacker, R. W. (1988). A view of linguistic semantics. In B. Rudzka-Ostyn (Ed.), current issues in linguistic theory (pp. 49–90). John Benjamins Publishing Company. doi:10.1075/cilt.50.04lan
- Lavrijsen, J., Tracey, T. J. G., Verachtert, P., De Vroede, T., Soenens, B., & Verschueren, K. (2021). Understanding school subject preferences: The role of trait interests, cognitive abilities and perceived engaging teaching. Personality & Individual Differences, 174, 110685. doi:10.1016/j.paid.2021.110685
- Lenth, R. (2020). Emmeans: Estimated marginal means, aka least-squares means. The Comprehensive R Archive Network. https://CRAN.R-project.org/package=emmeans
- Marmolejo-Ramos, F., Arshamian, A., Tirado, C., Ospina, R., & Larsson, M. (2019). The allocation of valenced percepts onto 3D space. Frontiers in Psychology, 10, 352. doi:10.3389/fpsyg.2019.00352
- Meier, B. P., & Robinson, M. D. (2004). Why the sunny side is up: Associations between affect and vertical position. Psychological Science, 15(4), 243–247. doi:10.1111/j.0956-7976.2004.00659.x
- Pouscoulous, N. (2011). Metaphor: For adults only? Belgian Journal of Linguistics, 25(1), 51–79. doi:10.1075/bjl.25.04pou
- Quatto, P., & Ripamonti, E. (2014). Raters: A modification of Fleiss’ kappa in case of nominal and ordinal variables. The Comprehensive R Archive Network. https://CRAN.R-project.org/package=raters
- R Core Team. (2016). R: A language and environment for statistical computing. Vienna, Austria: R Foundation for Statistical Computing. https://www.R-project.org
- Salzmann, J., & Grasha, A. F. (1991). Psychological size and psychological distance in manager-subordinate relationships. The Journal of Social Psychology, 131(5), 629–646. doi:10.1080/00224545.1991.9924647
- Silvera, D. H., Josephs, R. A., & Giesler, R. B. (2002). Bigger is better: The influence of physical size on aesthetic preference judgments. Journal of Behavioral Decision Making, 15(3), 189–202. doi:10.1002/bdm.410
- Solarz, A. K. (1960). Latency of instrumental responses as a function of compatibility with the meaning of eliciting verbal signs. Journal of Experimental Psychology, 59(4), 239–245. doi:10.1037/h0047274
- Tang, P., Ye, H., & Du, J. (2015). The spatial size metaphor of power concepts: A perspective from embodied cognition. Acta Psychologica Sinica, 47(4), 514. doi:10.3724/SP.J.1041.2015.00514
- Wang, L., & Yao, W. (2016). So near, so good: Does near-distance perception reduce interpersonal psychological distance? Social Behavior & Personality: An International Journal, 44(6), 889–898. doi:10.2224/sbp.2016.44.6.889
- Wark, C., & Galliher, J. (2007). Emory Bogardus and the origins of the social distance scale. The American Sociologist, 38(4), 383–395. doi:https://doi.org/10.1007/s12108-007-9023-9
- Wickham, H., Averick, M., Bryan, J., Chang, W., McGowan, L., François, R. … Spinu, V. (2019). Welcome to the tidyverse. Journal of Open Source Software, 4(43), 1686. doi:10.21105/joss.01686
- Williams, L. E., & Bargh, J. A. (2008). Keeping one’s distance: The influence of spatial distance cues on affect and evaluation. Psychological Science, 19(3), 302–308. doi:10.1111/j.1467-9280.2008.02084.x
- Wilson, J. P., Hugenberg, K., & Rule, N. O. (2017). Racial bias in judgments of physical size and formidability: From size to threat. Journal of Personality & Social Psychology, 113(1), 59–80. doi:10.1037/pspi0000092
- Xiaoling, H., & Jun, C. (2020). Cognitive development of multiple metaphors of power concepts in 3–5 year-old children. Acta Psychologica Sinica, 52(2), 149. doi:10.3724/SP.J.1041.2020.00149