Abstract
A fast measurement of sugar content of yogurt using Vis/NIR-spectroscopy techniques was established. 160 samples were measured by Vis/NIR-spectroscopy. A sugar content meter measured the sugar content on positions scanned by spectrum. The model between sugar content and spectral measurement was established based on partial least squares (PLS). The correlation coefficient was 0.894, standard error of calibration (SEC) was 0.356, and standard error of prediction (SEP) was 0.389. The correlation coefficient between predicted and measured values of 25 yogurt samples was 0.934. So the spectroscopy technique is reliable and acceptable in predicting the sugar content of yogurt.
INTRODUCTION
Yogurt is a pop drink produced by fresh milk as the raw material, and it is easier to digest and assimilate than fresh milk. Because of this, more and more consumers prefer to drink yogurt than fresh milk. There are many brands of yogurt with different qualities in the Chinese market, and so the checking of the qualities of yogurt faster than traditional methods has become an important study topic. The sugar content of yogurt is a main guideline of taste. At present, the measurements of sugar content at home and abroad always use chemical methods, which are carried out at destructive state and involve a considerable amount of manual work and are time consuming. Based on Vis/NIR Spectrum technique, the whole spectral bands data can be used for quantitative and qualitative analyses. Because of its advantages, including low cost, high efficiency, fast speed, ease of operation, nondestructive nature, short measuring time, limited sample preparation, and chemical-free, this technique has been widely used in many fields such as the food industry, petroleum chemistry, engineering, military, biometrics, and pharmaceutical industry. Slaughter demonstrated that Vis/NIR-spectroscopy could be used to measure non-destructively the internal quality of peaches and nectarines.[Citation1] Moons et al.[Citation2] established relationships between NIR-spectra and fruit quality parameters such as acidity and sugar content. Kawano et al.[Citation3] investigated the sugar content in peach with an optical fiber in interactance mode. Chippie et al.[Citation4] quantitatively analyzed fat and moisture in mayonnaise using Fourier transform infrared spectrometer. Kleynen, et al.[Citation5] quantitatively discriminated the varieties of apples using NIRS. This study applied Vis/NIR-spectroscopy[Citation6] to measure the sugar content of yogurt, using a model established with PLS. The method is simple, quick, non-destructive and accurate.
MATERIALS AND METHODS
Experimental Materials
Five brands of yogurt produced on the same day were purchased in a local market. They were Mengniu (Neimenggu), Junyao (Shanghai), Guangming (Shanghai), Yili (Neimenggu), and Shuangfeng (Hangzhou). All of the samples were stored in a refrigerator after they were purchased from the market. The whole experiment was carried out at the temperature between 20 and 23°C.
Experiment Instruments
In this research, a FieldSpec HandHeld (Analytical Spectral Device Inc., Boulder, CO, USA) with the reflection spectra of 350–1075 nm was used, with a sampling interval of 1.5 nm, a sensitivity of 3.5 nm, and a visual angle of the spectrograph of 20°. The light source was a Lowell pro-lam interior light source. A sugar content meter (WYT-4) was used in the measurement of sugar content. The software for analysis was ViewSpec Pro (Analytical Spectral Device Inc., Boulder, CO, USA) and Unscrambler V9.2 (CAMO PROCESS AS, Oslo, Norway).
Experimental Procedure
Collection of optical data
Thirty two samples were used for each brand of yogurt. We put about 45 ml of each yogurt sample into individual glass containers (6.5 cm in diameter and 1.4 cm in heigh). The Handheld FieldSpec was placed 150 mm above the glass containers. The primary spectral data of each sample after scanned 30 times was averaged and then saved in computer.
Measurement of sugar content
After spectral scanning, the sugar content of each sample was measured immediately by a sugar content meter at the same area that was scanned by spectrum instrument previously.
Data analysis
In order to eliminate the noise of environment and increase the quantity of efficient spectral data, the smoothing way of Savitzky was used to pretreat spectral data with the segment sizes of smoothing as 9. After this process, high signal-noise ratio generated by various factors was reduced efficiently. Because there were mass of scattering at the beginning and the end of the spectral data curve, and this noise will influence the accuracy of data analysis, only the data with the wavelength ranging from 400 to 1000 nm was used in this study. The pretreatment and calculation were carried out using The Unscrambler V9.2. The predictive models were established by using partial least squares (PLS).
Partial Least Squares (PLS) Analysis
Partial least squares (PLS),[Citation7] a multianalysis method of Vir/NIR spectrum analysis, can establish regression model[Citation8] that progresses prediction with varieties of sample groups at one time. PLS performs the decomposition both on the spectral and concentration data simultaneously, as it takes the advantage of the correlation relationship that already exists between the spectral data and the constituent concentrations.[Citation9–12] Besides, the model built by PLS is steadier, especially for the study on few samples and masses of variables.[Citation6] The training speed in the process is much quicker than that of PCA, and the principle components (LV-latent variables) are related to the dependent variables, not to the independent variables, which have the largest change in the matrix just like PCA. The use of multi-linear regression (MLR) is not recommended because of the collinearity between adjacent wavelengths.[Citation13] Wang et al.[Citation14] established PLS models with three wavelength regions and two wavelength models to determining pecky rice kernels. Wang et al[Citation15] also used PLS arithmetic to classify fungal-damaged soybean seeds. Edteban-Diez et al.[Citation16] predicted sensory properties of espresso by separated calibration models based on PLS.
RESULTS AND DATA ANALYSIS
Vis/NIR-Spectroscopy
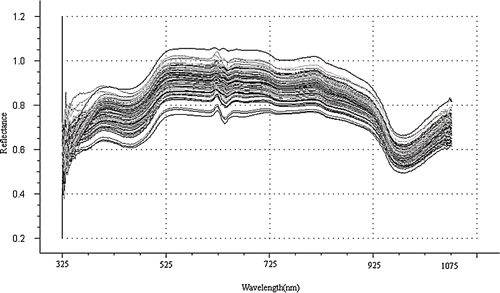
As the result of experiment would be affected by different positions of spectral measurement on each sample and different parameters of spectral scan, an excellent spectrogram should be obtained only based on strict control of the experiment condition. Therefore the spectral measurement must carry through under the uniform experiment condition. shows the spectra (reflectance (R)) for 160 samples from five different brands of yogurt. The information which is used to predict the composition and quantities of the samples is contained in these spectral curves. It is difficult to extract the relevant information from many overlapping peaks by directly identifying from the figure of spectral data curve. So the pivotal step for spectroscopy technique is to extract quantitative data from them. In this study, PLS algorithm was used to achieve this purpose.
Figure 1 Reflectance spectra of one hundred and sixty yogurt samples.
Sugar Content Distribution of Yogurt
After using sugar content meter to measure sugar content, values in two locations of each sample were averaged as the final sugar content value. The result of sugar content of total 160 samples was listed in . The distribution of sugar content could be understood qualitatively.
Table 1 The sugar content distribution of 160 yogurt samples
Measuring Result of Sugar Content of Yogurt and Analysis
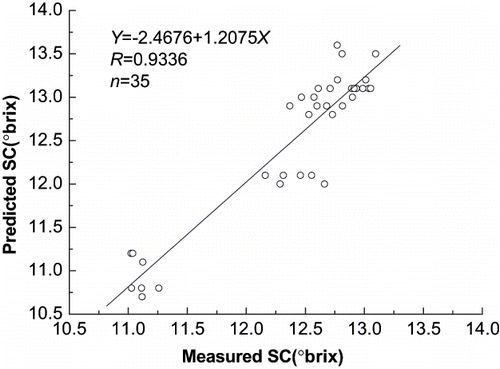
illustrates the Vis/NIR-spectra (reflectance (R)) of 160 samples from 5 different brands of yogurt. The abscissa in represents wavelength, ranging from 325 to 1075 nm, and the ordinate represents spectral reflectance. The spectrum, with the wavelength ranging from 400 to 1000 nm, was chosen in data analysis. By using ASD ViewSpec Pro software, spectral data was averaged and transformed into ASCII data, and matrix of reflectivity was generated and smoothed in the pretreatment. Then The Unscrambler V9.2 was used to build both a calibration model and a prediction model. The first 27 samples from each of the 5 different brands of yogurt were chosen as a calibration sample cluster, and PLS mathematic model was built by using Vis/NIR-spectroscopy and sugar content of each samples. The correlation coefficient between spectral data and sugar content of yogurt was 0.894, standard error of calibration (SEC) was 0.356, and standard error of prediction (SEP) was 0.389. and separately show the calibration and validation results. The sugar content of another 25 samples was predicted by mathematical model. The correlation coefficient of linear regression between predicted and measured values shows a reasonable to excellent prediction performance of 0.934 ().
Figure 2 PLS modeling of sugar content of 125 yogurt samples.
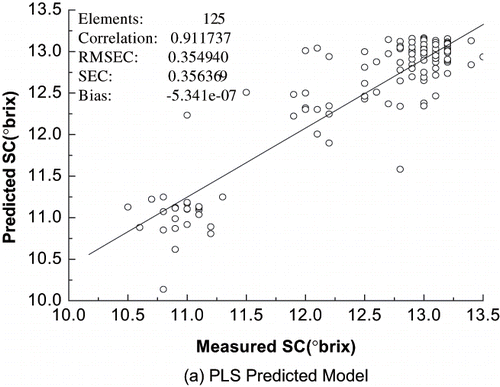
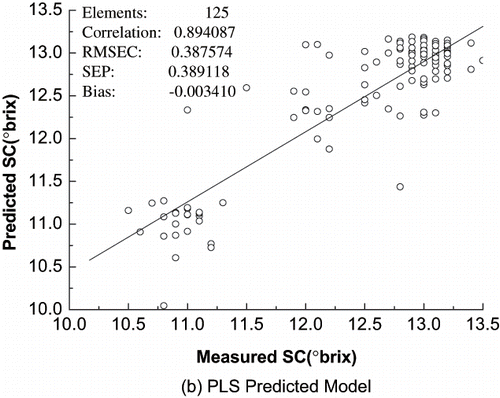
Figure 3 The relationship between predicted and measured values of 35 yogurt samples.
CONCLUSION
A new fast, non-destructive method with spectral technique and partial least squares (PLS) for measuring sugar content of yogurt was developed. The correlation coefficient of linear regression between predicted and measured values showed a reasonable to excellent prediction performance of 0.934. The results indicated that this method could quantitatively analyze sugar content of yogurt in a fast and non-destructive way. This approach may also be applied on fast and non-destructive measurement of internal components of other liquid food.
ACKNOWLEDGMENTS
This study was supported by the Teaching and Research Award Program for Outstanding Young Teachers in Higher Education Institutions of MOE, P. R. C., the Specialized Research Fund for the Doctoral Program of Higher Education (Project No: 20040335034), and the Science and Technology Department of Zhejiang Province (Project No. 2005C21094, 2005C12029).
Related Research Data
REFERENCES
- Slaughter , D.C. 1995 . Non-Destructive Determination of Internal Quality in Peaches and Nectarines . Transactions of the ASAE , 38 ( 2 ) : 617 – 623 .
- Moons , E. , Dubois , A. , Dardenne , P. and Sindic , M. Nondestructive Visible and NIR Spectroscopy for the Determination of Internal Quality in Apple . Sensors for Non-destructive Testing Int'l. Conf . Orlando, Florida. February . N.Y. : Northeast Regional Agricultural Engineering Service: Ithaca .
- Kawano , S. , Watanabe , H. and Iwamoto , M. 1992 . Determination of Sugar Content in Intact Peaches by Near Infrared Spectroscopy with Fibre Optics in Interactance Mode . J. Japanese Soc. Hort. Sci. , 61 ( 2 ) : 445 – 451 .
- Chippie , A.L. , Jamieson , P.R. , Gold , C.M. , Hsu , C.-H. and Lo , Y.M. 2002 . Quantitative Analysis of Fat and Moisture in Mayonnaise Using Fourier Transform Infrared Spectrometer . International Journal of Food Properties , 5 ( 3 ) : 655 – 665 .
- Kleynen , O. , Leemans , V. and Destain , M.F. 2003 . Selection of the Most Efficient Wavelength Bands for ‘Jonagold’ Apple Sorting . Postharvest Biology and Technology , 30 ( 3 ) : 221 – 232 .
- Lu , W. , Yuan , H. and Xu , G. 2001 . Modern NIR-Spectroscopy Analysis Technique , Beijing : China Sinopec Press .
- Haalan , D.M. and Thomas , E.V. 1988 . Partial Least Squares Method for Spectral Analysis: Relation to other Quantitative Calibration Methods and the Extraction of Qualitative Information . Analytical Chem. , 60 : 1193 – 1202 .
- Chen , D. , Wang , F. and Shao , X.G. 2004 . Research on the Nonlinear Model of Near Infrared Spectroscopy and the Total Sugar of Tobacco Sample . Spectroscopy and Spectral Analysis , 24 ( 6 ) : 672 – 674 .
- Haalan , D.M. and Thomas , E.V. 1988 . Partial Least Squares Method for Spectral Analysis . Analytical Chem. , 60 : 1193 – 1202 .
- Curda , L. and Kukackova , O. 2004 . NIR Spectroscopy: A Useful Tool for Rapid Monitoring of Processed Cheeses Manufacture . Journal of Food Engineering , 61 : 557 – 560 .
- Ghafourian , T. and Cronin , M.T.D. 2005 . The Impact of Variable Selection on the Modeling of Oestrogenicity . SAR and QSAR in Environmental Research , 16 ( 1–2 ) : 171 – 190 .
- He , Y. , Song , H.Y. , Garcia , P.A. and Hernandez , G.A. 2005 . A New Approach to Predict N, P, K and OM Content in a Loamy Mixed Soil by Using Near Infrared Reflectance Spectroscopy . Lecture Notes in Computer Science , 3644 : 859 – 867 .
- Lammertyn , J. , Nicolai , B. , Ooms , K. , Smedt , V.D. and Baerdemaeker , J.D. 1998 . Non-Destructive Measurement of Acidity, Soluble Solids, and Firmness of Jonagold Apples Using NIR-Spectroscopy . Trans. Am. Soc. Agric. Eng , 41 ( 4 ) : 1086 – 1094 .
- Wang , D. , Dowell , F.E. , Lan , Y. , Pasikatan , M. and Maghirang , E. 2002 . Determining Pecky Rice Kernels Using Visible and Near-Infrared Spectroscopy . International Journal of Food Properties , 5 ( 3 ) : 629 – 639 .
- Wang , D. , Dowell , F.E. , Ram , M.S. and Schapuagh , W.T. 2004 . Classification of Fungal-Damaged Soybean Seeds Using Near-Infrared Spectroscopy . International Journal of Food Properties , 7 ( 1 ) : 75 – 82 .
- Esteban-Diez , I. , Gonzalez-Saiz , J.M. and Pizarro , C. 2004 . Prediction of Sensory Properties of Espresso from Roasted Coffee Samples by Near-Infrared Spectroscopy . Analytica Chimica Acta , 525 : 171 – 182 .