Abstract
Pressure driven flow can arise in a food process due to various reasons such as rapid internal evaporation in microwave heating of a food. Whether intended or unintended, pressure driven flow can be a very significant mode of transport of water, vapor, and other components. The physics of pressure driven flow cannot be lumped into effective diffusivity type formulation in general. Permeability, a material property that is needed to properly describe this physics of pressure driven flow using mechanistic models and is generally unavailable. For the first time, intrinsic permeability of potato and muscle tissues to water were measured by making water flow through the samples under pressure and measuring the flow rate in a dedicated commercial setup for measuring permeability. Intrinsic permeability values were found to be in the range of 10−17 – 10−19 m2. Permeability of soft food materials change significantly with pressure, however, electron microscope pictures showed no change in structure in potato tissue.
INTRODUCTION
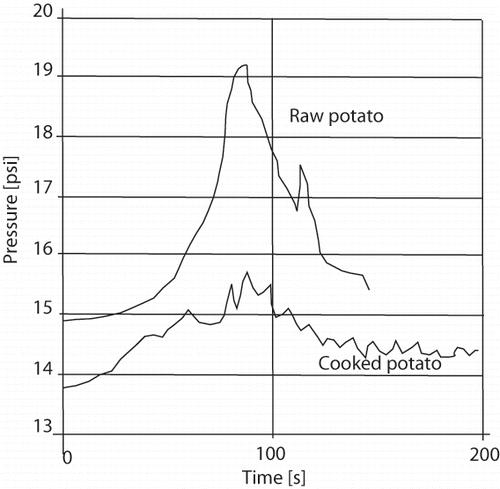
Hydraulic permeability refers to the resistance of a solid matrix due to pressure driven flow. Food processes where permeability is relevant can be 1) where internal evaporation generates pressures such as microwave heating, frying, or any other intensive heating[Citation1–3]; 2) where applied pressures squeeze fluid out, as in extraction; 3) where water moves due to negative pressure (capillarity) in an unsaturated solid, e.g., toward the later stages of a drying process. For example, significant pressure can develop in microwave heating, as shown in . The physics of pressure driven flow cannot, in general, be lumped into effective diffusivity type formulation to study transport. When mechanistic models are used to study transport processes in foods, where individual modes of transport are clearly identified by treating the food as a porous media, we need permeability data.
Figure 1 Experimentally measured pressure increase during microwave heating of a raw potato, showing example of a process where pressure driven flow is relevant.
Since permeability is not as common a food property, and the term permeability is used in many different contexts involving different modes of transport, it is useful to have a discussion of this property. Knowledge of permeability is important in expression or pressing in which liquid contained in pores in a solid matrix is expelled by squeezing. This is used, for example, to recover vegetable oil or fruit juice from the plant tissue. As a bed of the plant tissue (a cake) is compacted (squeezed) mechanically, liquid flows through the cake depending on its permeability through the cake, among other factors. A detailed review of such processes, including how permeability is affected by the type of bed material in food applications, is provided in Schwartzberg.[Citation4] Detailed permeability data for food applications are generally unavailable[Citation5], although permeability of fibrous beds in general are extensively reviewed in Jackson and James.[Citation6] In this article, permeability related to such beds will not be included in any further detail.
Cell (or membrane) permeability refers to the ability of substances to move into or out of the cell by crossing the plasma membrane, due to gradients in osmotic pressure. Thus, cell permeability plays a critical role in biological processes. This, however, is not the topic here and readers are referred to excellent sources of data such as Weiss.[Citation7] Permeability of water through extracellular matrices is also important for a variety of tissues, such as that in renal function.[Citation8] Permeability of fluid in bone plays an important role in its strengthening and is studied in detail.[Citation9] Such biomedical studies can also shed light in tissues used as food, in terms of experimental setup for measurements, effect of structure, and other insight into the nature of hydraulic permeability. However, only a small amount of information on permeability through tissues and bones are available.
In osmotic flow, transport of a solvent occurs from a region of low solute concentration to a region of high solute concentration through a semi-permeable membrane. For flow calculations, osmotic pressure is treated the same way as hydraulic pressure. Thus, the Darcy's law described later for pressure driven flow can be generalized to include osmotic pressure, as well and the hydraulic conductivity discussed here can be relevant in describing such osmotic flows.
There are many other uses of the term permeability. The hydraulic permeability discussed here should not be confused with such terms. For example, in food applications, permeability is used in the context of transport of gases through packaging film. Although the same term permeability is used, the driving force in this context of transport through polymeric films is diffusion. For example, if a polymeric film of thickness Δ x is separating a gas with partial pressure difference of Δp between the two sides of the film, the flux of the gas through the film is given by:
The product DS is referred to as permeability in the context of packaging.[Citation10] Clearly this should not be confused with hydraulic permeability.
FUNDAMENTAL CONSIDERATIONS
Again, since permeability is not that common a property, this section will define it (and related terms) and provide their physical interpretations. Movement of liquid in a porous material can be described by Darcy's law, written as:[Citation11]
Hydraulic potential is the sum of pressure and matric potential h, and gravitational potential z:
The matric potential measures the physical forces, such as capillarity, which bind the water to the porous matrix. The retention of water is a result of attractive forces between the solid and liquid phases. Matric potential is always negative or zero. The pressure potential is due to hydrostatic or pneumatic pressure applied to water. The gravitational component of the water potential is simply due to a difference in depth z in the vertical (gravity) direction from a reference point.
Like Fourier's and Fick's laws, Darcy's law (EquationEq. 2) is an empirical relationship. The units for the volumetric flux q in EquationEquation 2 are m3/m2·s or m/s. Since the units for q are the same as those for velocity, it is also called Darcy velocity. Note that, even though q has the units of velocity, it is not the true average velocity of fluid through the pores as flow takes place through only the porous part of the cross-sectional area A. Let φ be the volumetric porosity, defined as the ratio of volume of void space (pore volume) to the bulk volume of a porous medium. Average areal porosity, which is the ratio of void area to the total area at a cross section, can be considered the same as average volume porosity φ. Thus, the true average velocity of fluid through the pores is
Physical Interpretation of Hydraulic Conductivity K and Permeability k
Since hydraulic conductivity K relates the flux to the potential causing the flow, it must depend on both matrix and fluid properties. As a first approximation, a porous medium can be considered as a bundle of tubes of varying diameter embedded in the solid matrix. Using this simple approximation, we can show that[Citation12]
The ratio ρ/μ represents the effect of fluid properties. Using this definition of permeability, k, Darcy's law can be rewritten as
When the solid is saturated with liquid, which is the situation studied here, the pores are completely filled with water. Both the matrix contribution and the fluid contributions are constant. This leads to a constant hydraulic conductivity of a given solid saturated by a particular fluid. For an unsaturated solid, the hydraulic conductivity can vary dramatically, and will not be considered here.
Intrinsic and Relative Permeability
Permeability, k, is further broken into intrinsic permeability, ki , and relative permeability, kr , given by the following expression:
The intrinsic permeability, ki , represents the permeability of a liquid or gas in fully saturated state. Models with limited success exist in relating intrinsic permeability to the structure of the material.
Many expressions exist for relating relative permeability to saturation in the material. An widely used expression for relative permeability of gases as function of saturation is given by
Here Sir is irreducible saturation that is often assumed. See, for example, the work of Nasrallah and Perre[Citation13] and Ilic and Turner, [Citation14] where a value of 0.09 was assumed. Again, our measurement will be restricted to fully saturated state.
Various Methods to Measure Permeability
In the soil literature, several methods exist for measuring permeability (see, for example, Reynolds et al.[Citation15] The general idea in permeability measurement is to apply pressure on the fluid placed over the material whose permeability we are trying to measure. The amount of material collected over a certain time provides the flow rate which is used with EquationEq. (2) with known pressure and thickness to obtain the permeability. A commercial setup for generic permeability measurement will be used here that is based on this principle. Due to a number of difficulties, such a technique is not commonly used for food systems. In the biomedical world, ultrafiltration cell (Amicon, Beverly, Massachusetts) has been used by White and Deen[Citation8] to measure permeability of membranes 70–90 μm thickness.
EXPERIMENTAL PROCEDURE
Sample Preparation
In this article, saturated permeability was measured for potato and beef tissues. US #1 Premium white potatoes and beef slices (USDA Choice Sirloin tip London Broil) were purchased from a local grocery store. Using a chain saw normally used for cutting plastics, slices were cut from the potato of nominal thicknesses 2.5 and 5 mm. The beef slices (nominally 12 mm thickness, unsqueezed) were chosen from the thin cuts in the store and were used as is, without further altering their thicknesses. The thickness of a slice was measured using a digital caliper (0.02 mm accuracy) at three or more different places just before starting the experiment, and the average of these values were used in the calculations and shown in the figures in results section. An important observation about the thickness is that there was swelling for both the meat and potato during the experiment, with meat swelling more than potato. The potato slices were kept in water until ready for experimentation. The mean moisture content for potato, measured from three samples, was 88.3%. The beef slices were kept in plastic bags until experimentation, without any added water.
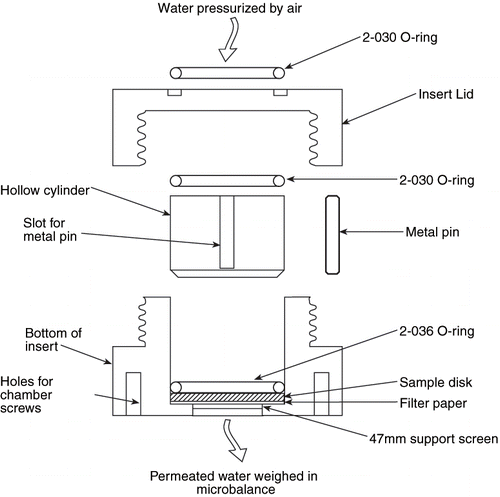
Experimental Setup for Permeability Measurement
A schematic for the experimental setup is shown in . The placement of the sample in the sample holder is shown in . Hand tightening of the lid pressures the O ring on top of the sample that seals off any flow from the side and flow is considered to be through the thickness only of the sample. Distilled water above the sample was pressurized at a constant value using air. Water permeating through the sample reaches a covered stainless steel tray through plastic tubing and the weight of the tray was constantly monitored by a microbalance and sent to the computer. The time and the amount collected were noted approximately every ten minutes. The amount of fluid collected on the microbalance varied in the range 0.5–1.5 g, depending on the duration, thickness, and so on. The sensitivity of the balance is 0.001 g. The experiment was repeated at increasing values of pressure. Temperature variation of permeability for most liquids is of the order of 1–3%, thus temperature was assumed not to be critical. The distilled water temperature was approximately 27°C and the temperature of the room where experiments are conducted was about the same. During the experimental runs, sometimes flow rates suddenly increased, or the pressure suddenly changed—all such runs were discarded.
Figure 2 Schematic of the measurement process showing also the data collection screen that was manually read.[Citation12]
![Figure 2 Schematic of the measurement process showing also the data collection screen that was manually read.[Citation12]](/cms/asset/a7de6e1b-e352-4350-948f-6051f84eae4a/ljfp_a_159599_o_f0002g.gif)
Figure 3 Details of the sample placement inside the sample holder.
Procedure for Calculating Permeability Data
If EquationEq. (9) is written in terms of finite thickness
Viscosity of water, μ, of 0.001 N · s/m2 is used. Density of water, ρ, at 27°C of 996.454 kg/m3 is used to convert the weight of collected fluid into volume.
Experimental Setup for Microscopy
Structure of the potato samples before and after permeability measurement were checked using Environmental Scanning Electron Microscopy (ESEM). This microscope allows foods to be viewed in their natural state, without dehydration. It is a relatively new technique for food applications.[Citation16] Slices from the same potato as used for permeability measurement were used for ESEM. After slicing samples from the same potato (as described above), some were used for permeability measurement, while others were stored in water and transported to the ESEM in less than one hour. Temperature in the ESEM platform on which the sample was placed was kept around 5°C to reduce evaporation.
RESULTS
Permeability Data
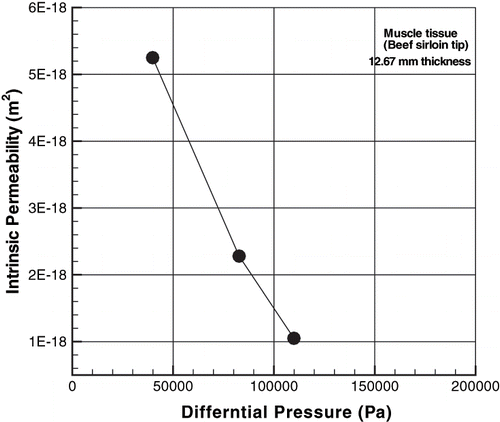
The permeability values for water through potato tissue as a function of pressure are shown in and , and those for meat tissue are shown in and . The measured values were in the range of 10−17 – 10−19 m2 (i.e., in the micro Darcy range), with values for potato being slightly lower than that of meat. For potato, the permeability appears to rise with pressure, although this trend was not consistent. For meat, the permeability values reduced with pressure. Since the material is soft, at increased pressure it should be more compact with decreased permeability, as seen in the case of meat tissue. Such a decrease did not appear to be the case for potato tissues. An important observation is that both meat and potato tissues swelled during experiment with the meat in particular swelling up considerably when the duration of experiment was long. This thickness increase could affect the permeability values.
Figure 4 Water permeability of raw potato tissue.
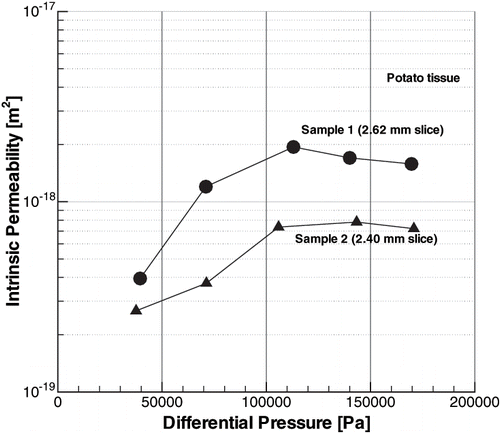
Figure 5 Water permeability in raw potato tissue of a different thickness.
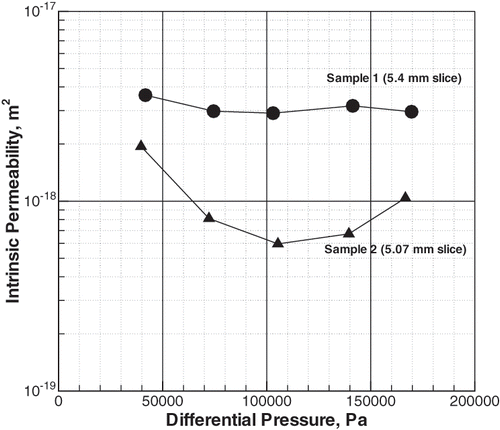
Figure 6 Water permeability of beef tissue.

Figure 7 Water permeability of beef tissue.
Possible Structural Changes During Experiment
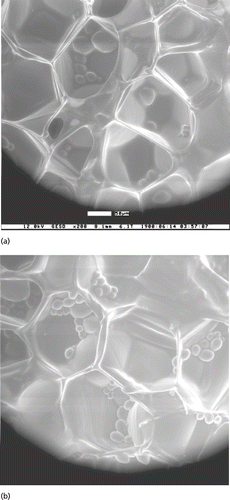
It is difficult to explain these variations without knowing the changes in structure. We did make Environmental Scanning Electron Microscopy (ESEM) measurements before and after the experiment are shown in but these did not show any major changes between the initial and final. The possible changes in structure during the experiment as the pressure is increased, of course, could not be recorded.
Figure 8 Environmental Scanning Electron Microscope (ESEM) pictures before (a) and after (b) the permeability measurement showing no perceptible difference in structure because of the flow through the material and any other effects during the experimentation.
How Important is Darcy Flow?
To see how important the Darcy flow is, in comparison with capillary diffusion, Peclet number given by
Thus, the effect of Darcy flow (convection) is likely to be small compared to capillary diffusion at high moisture content, but not so at lower moisture contents.
Comparison with Other Materials
It is instructive to see how the permeability of potato and meat tissue compare with that of other materials. This is illustrated in . Obviously, the permeability values for meat and potato appear to be quite low, in the range of unweathered clay or high-strength concrete.
Figure 9 Permeabilities for food materials measured in this study compared to other materials. Information presented for other materials is from the work of Bear.[Citation11] Construction material data is also in Hall and Hoff.[Citation17]
![Figure 9 Permeabilities for food materials measured in this study compared to other materials. Information presented for other materials is from the work of Bear.[Citation11] Construction material data is also in Hall and Hoff.[Citation17]](/cms/asset/f442821f-f28f-4c47-ae8f-2c423e9fc8d0/ljfp_a_159599_o_f0009g.gif)
Understanding about Darcy flow would solve an important piece of the puzzle in quantitative understanding of moisture transport in food (that often determines its quality) during processing. This study would provide accurate measurement of the needed permeability data for several food tissues for the first time.
CONCLUSION
Intrinsic permeability of potato and muscle tissues were measured to be in the range of 10−17 – 10−19 m2. There is considerable variability in the data. Permeability of soft food materials change significantly with pressure, but the data collection is influenced by the dimensional changes in the sample. Internal structure did not appear to change due to pressure driven flow.
ACKNOWLEDGMENTS
Support of Porous Materials, Inc. in making the equipment available for author's data collection process is gratefully acknowledged. Use of Electron and Optical Microscopy Facility of the Center for Materials Research at Cornell University also helped make this study possible.
Related Research Data
REFERENCES
- Datta , A.K. 2006a . Porous media approaches to studying simultaneous heat and mass transfer in food processes. II: Property data and representative results . Journal of Food Engineering , In Press
- Datta , A.K. 2006b . Porous media approaches to studying simultaneous heat and mass transfer in food processes. I: Problem formulations . Journal of Food Engineering , In Press
- Ni , H. and Datta , A.K. 1999 . Heat and Moisture Transfer in Baking of Potato Slabs . Drying Technology , 17 ( 10 ) : 2069 – 2092 .
- Schwartzberg , H. 1997 . Expression of Fluid from Biological Tissues . Separation and Purification Methods , 26 ( 1 ) : 1 – 213 .
- Goedeken , D.L. and Tong , C.H. 1993 . Permeability Measurements of Porous Food Materials . Journal of Food Science , 58 ( 6 ) : 1329 – 1331 .
- Jackson , G.W. and James , D.F. 1986 . The permeability of fibrous porous media . Canadian Journal of Chemical Engineering , 64 ( 3 ) : 364 – 374 .
- Weiss , T.F. 1996 . Cellular Biophysics, Vol. 1: Transport , Cambridge, MA : The MIT Press .
- White , J.A. and Deen , W.M. 2002 . Agarose-dextran Gels as Synthetic Analogs of Glomerular Basement Membrane: Water Permeability . Biophysics Journal , 82 : 2081 – 2089 .
- Liebschner , M. and Keller , T.S. 1999 . The Importance of the Permeability Constant in Hydraulic Strengthening of Cortical Bone . Advances in Bioengineering , 42 : 321 BED-V
- Saravacos , G.D. 1995 . “ Mass Transfer Properties of Foods ” . In Engineering Properties of Foods , Edited by: Rao , M.A. and Rizvi , S.S.H. New York : Marcel Dekker, Inc. .
- Bear , J. 1972 . Dymanics of Fluids in Porous Media , New York, NY : American Elsevier Publishing Company .
- Datta , A.K. 2002 . Biological and Bioenvironmental Heat and Mass Transfer , New York, NY : Marcel Dekker, Inc. .
- Nasrallah , S.B. and Perre , P. 1988 . Detailed Study of a Model of Heat and Mass Transfer During Convective Drying of Porous Media . International Journal of Heat and Mass Transfer , 31 ( 5 ) : 957 – 967 .
- Ilic , M. and Turner , I.W. 1989 . Convective Drying of a Consolidated Slab of Wet Porous Material . International Journal of Heat and Mass Transfer , 32 ( 1 ) : 2351 – 2362 .
- Reynolds , W.D. , Elrick , D.E. , Youngs , E.G. , Amoozegar , A. , Booltink , H.W.G. and Bouma , J. 2002 . “ Saturated and Field-saturated Water Flow Parameters ” . In Methods of Soil Analysis, Part 4, Physical Methods , Edited by: Dane , J.H. and Topp , G.C. Madison, Wisconsin : Soil Science Society of America, Inc. .
- McDonough , C.M. and Rooney , L.W. 1999 . Use of the Environmental Scanning Electron Microscope in the Study of Cereal-based Foods . Cereal Foods World , 44 ( 5 ) : 342 – 348 .
- Hall , C. and Hoff , W.D. 2002 . Water Transport in Brick, Stone and Concrete , London : Spon Press .
- Porous Materials Inc. 1996 . “ PMI automated capillary flow porometer: User's Manual ” . Ithaca, NY : PMI .