Abstract
Successful commercialization of a date confectionery requires development on a sound technological basis. In Part I of this series, a relationship was established between the ingredients of a formulation, and the instrumental texture of the final product. In the present communication, we go a step further by developing a correlation between textural attributes, and the corresponding sensory parameters, as judged by trained panelists. In doing so, confections were made using table and processing dates and subjected to a “two-bite” texture profile analysis, thus recording a series of useful attributes. Taste panelists were trained to identify the corresponding sensory parameters thus constructing a scoring card as part of a quantitative descriptive analysis. Results demonstrated that instrumental texture can be “handshaken” to sensory evaluation to provide an avenue of developing and controlling the quality of a date confectionery made with affordable raw materials.
INTRODUCTION
In Part 1 of this series, it was argued that one of the avenues of diversifying the economies of Middle Eastern countries would be to develop the date industry.[Citation1] Utilization of dry dates to produce preservative-free, delicious, and inexpensive confectioneries is a feasible undertaking. Processing dates (e.g., Umesilla) are affordable, and their successful incorporation to industrial formulations would result in value added products.
Naturally, textural, and sensorial quality control comes in play while developing a new formulation. Texture profile analysis (TPA) reflects an attempt to engineer an objective method of analyzing the applied aspects of the structural characteristics of foodstuffs.[Citation2] Subsequently, Bourne adapted the Instron rheometer to perform TPA by compressing standard-sized samples of food twice in a reciprocating motion that imitates roughly the action of the jaw.[Citation3,Citation4] This generates a force-distance curve of which points can be selected to highlight the nature of the material.[Citation5]
The literature is abundant with rheological work on the date drupe and date concentrates.[Citation6–12] Our investigation established the textural behavior of a date candy up to four months of storage at ambient temperature. Furthermore, it was argued that embodiments made with the inexpensive Umesilla date retain the same textural profile as for those of the table date, Khalas.[Citation13]
Thorough evaluation of a new product requires assessing its sensory profile, and then relating it to the instrumental texture.[Citation14] Sensory evaluation is the scientific discipline used to measure and interpret the response to the characteristics of foods as they are perceived by the senses, i.e., taste, smell, sight, touch and hearing.[Citation15] At early stages of the development of processed foods, it was appreciated that sensory tests have to be performed to accurately judge how well the general public will receive them. As for rheology, several studies have been carried out on the organoleptic properties of the raw materials, i.e., date drupe, paste, and syrup.[Citation16–18]
As far as we are aware, no attempt has been made to correlate objective texture readings to subjective sensory responses for processed date foodstuffs. This would allow safe passage from one type of analysis to the other thus reducing the workload required for successful development of a given product. In Part II, we aim to demonstrate that such a relationship can be established for date confections thus leading to predictive control of their mouthfeel.
EXPERIMENTAL
Formulation and Texture Profile Analysis (TPA) of the Date Confectionery
The dry drupes of Khalas and Umesilla were pitted and made into a paste following the three stages of preparation described in detail in Part I of this series. The final formulation was compressed gently using a burger-forming machine, thus yielding cylindrical disks of 150 g weight, 14 mm height, and 9.4 cm diameter. As for the “first bite” analysis utilized in the discussion of the structure of the three formulation stages, the texture profile analyser (TA-XT2i) from Stable Micro Systems (Surrey, UK) was employed to advance a link with sensory stimuli. A “two-bite” test allowed us to record the instrumental parameters of firmness, hardness, brittleness, adhesiveness, cohesiveness, and springiness at ambient temperature (23°C). Operational definitions of the textural parameters can be found in Part I of this study.[Citation13] Briefly, the experimental settings were: 0.1 mm/s compression rate; 90% compression; 5 points per second acquisition rate. Stress (Pa)—strain (units) curves were drawn taking into account the concept of “true strain”.[Citation19] Triplicate results belonging to the “population” from which they came at a 95% probability limit are reported.
Sensory Evaluation
Efforts focused on the standardization of product preparation and tasting in order to maximize the likelihood of achieving our goals. It was important to establish the purpose/objective of a sensory panel, since they should not just be trained to reproduce the texture results but be able to understand and assess the product in terms that mouthfeel is comparable to rheological studies. Eventually, the panel would make subjective judgments based on this analysis (e.g. preference testing). For this reason, it was agreed that the terms and descriptions used in the sensory analysis should be developed to reflect the measurements being made during the TPA experiments.
Panelists had previous experience in sensory evaluation (quantitative descriptive analysis and preference tests), and they formed a pool to discuss and develop the new concepts. This included establishing appropriate standards to provide a scalar response to sensory stimuli and ensuring that descriptions of each of the attributes are perceived in an equal manner by the sensory panel. Several brainstorm sessions encompassing texture and sensory work were undertaken by testing several standards and receiving feedback from the panel. To achieve a valid handling and testing process of the date confections, bias was eliminated as follows: i) a controlled presentation of the sample was maintained by placing randomly numbered products in a white paper plate; ii) a glass of mineral water and bland biscuit were served to clear the mouth between evaluations; iii) physical variability such as preparation time and temperature, serving room temperature (about 23°C), standard room daylight (between 80 and 150 foot-candles), etc. was controlled.
RESULTS AND DISCUSSION
Textural Profile Analysis of the Date Confectionery
In traditional production situations, the quality of gel-like food products is often assessed simply by squeezing, prodding with the finger, or shaking. It is our observation that these subjective techniques usually fail to provide the required information, even when employed by experienced personnel.[Citation20] Adoption of the texture profile analysis provided reliable readings for the most common characteristics of the date preparations.
reproduces the “two-cycle” TPA profile for the final product of cooked Khalas candy, but qualitatively similar force-deformation curves have been recorded for the remaining materials (e.g., uncooked Umesilla candy in ). Results of this investigation in terms of the 6 instrumental parameters analyzed are summarized in . The values of firmness relate to the small deformation properties of the material and they remain relatively high in the uncooked varieties (0.40 and 1.18 N/mm in ). Firmness drops to low values once the thermal treatment is applied to the formulation (cooking at 50°C for 5 minutes).
Figure 1 Two-cycle stress-strain profile of the cooked Khalas date candy at 23°C (compression rate = 0.1 mm/s).
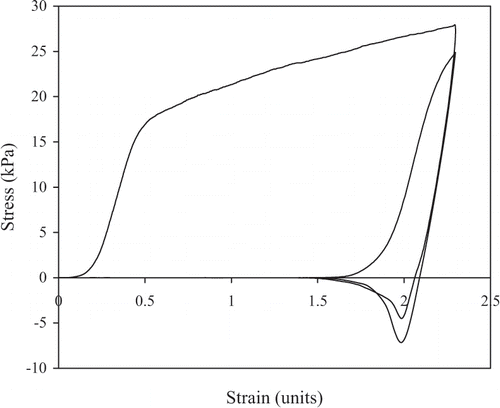
Figure 2 Two-cycle stress-strain profile of the uncooked Umesilla date candy at 23°C (compression rate = 0.1 mm/s).
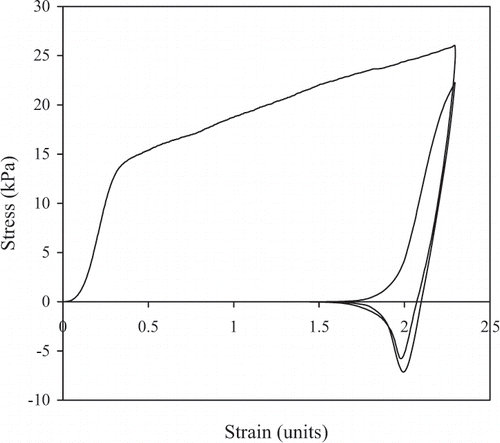
Table 1 Quality control attributes derived from the two-cycle instrumental texture profile analysis and sensory evaluation of date candy.
Hardness, on the other hand, is the manifestation of the large deformation behaviour at its most dramatic, i.e., rupture of the network.[Citation21] The first cycle compression reveals a smooth breaking profile with a broad shoulder characterized by a point of yield stress between 15 and 20 kPa ( and ). The database of textural characteristics is further enriched with readings of brittleness and adhesiveness, which argue for a pasty confectionery possessing intermediate elasticity and considerable “stickiness” on the parallel plate of the measuring geometry ().
Following the first compression cycle, the force is removed from the sample as the TPA crosshead moves back to its original position. As the second compression cycle develops, springiness and cohesiveness of the material is determined.[Citation22] Springiness is a measure of how much the original structure of the sample was broken down by the first bite. If the sample recovered and returned to its original position following compression, the second bite would generate an identical peak and the springiness would be 100%. As shown in and , this is not quite the case with the recovery being about 80% of the original height. Nevertheless, structures have recovered to a good extent to be thought of as moderately “rubbery” food materials.
Cohesiveness is measured by taking the total work done on the sample during the second cycle and dividing it by the work done during the first cycle.[Citation23] In practice, work is measured as the area under the respective curves and it is usually expressed as a percentage. As depicted in , the values of cohesiveness are rather low at about 0.04 to 0.07% of the first textural profile. Therefore, the date confectioneries can be perceived as “tender” and easy to break up in the mouth.
This completes the instrumental analysis which is of paramount importance. In combination with Part I of this series, it has been shown that the structural properties of the Umesilla candy are comparable to those for Khalas and both are quite distinct from the hard, tough, and non-adhesive textural profile of the commercial embodiment. However, texture is not the only factor determining the organoleptic acceptability of food solids and we shall turn, next, our attention to sensory issues.
Quantitative Descriptive Analysis (QDA) of the Date Confectionery
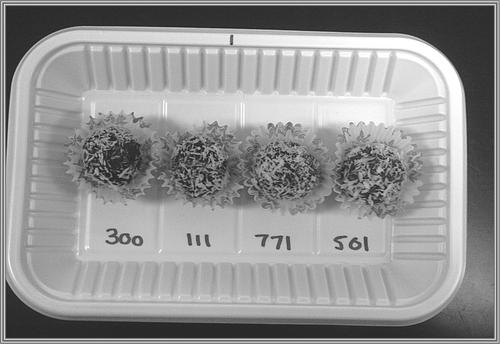
The literature is abundant with work aiming to evaluate the training needs of taste panelists, the effect of processing on mouthfeel, and the sensory properties of a plethora of foodstuffs.[Citation24–27] Nevertheless, we felt that meaningful comparison with TPA requires explicit development of a sensory technique emphasizing the treatment of the material in the mouth and the particular sensation to be evaluated. Final products were coded and presented to panelists following the standard protocol used in a randomized evaluation ().
Figure 3 Final formulations of the date candy in preparation for sensory assessment by the trained panelists.
The organoleptic evaluation in which the trained panelists assigned intensity levels on the chosen descriptors/textural attributes is epitomized in the scoring card of . It was found that once the definitions of the sensory attributes were developed, they correlated well with the mechanical textural characteristics. In analyzing the data, the first step was to measure the distance from the low standard to the point at which the panelists have marked their response for each sample. Measurements were made to the nearest millimeter, and the values entered in to a spreadsheet table with the appropriate assessment number being provided. The spreadsheet automatically reordered the data, determined the mean values and provided graphic representation of the final results.
Table 2
Sensory results of the individual attributes of the four products are presented in . They are also plotted using the “spider-web” diagram of , as described by Stone et al.[Citation28] The equal angular differences relate directly to the equivalent significance of the seven sensory topics in , and the distance on the line from the center of the attribute was the mean value assigned by the panelists. The center of the diagram represents zero intensity. Plotting and then connecting the mean sensory scores yields a spider-web wherein a comparison can be made between our four products.
Figure 4 Pictorial correlation of the sensory attributes for the four date candies using a “spider-web” diagram: uncooked Khalas (——), cooked Khalas (—), uncooked Umesilla (—– -), and cooked Umesilla (- - -).
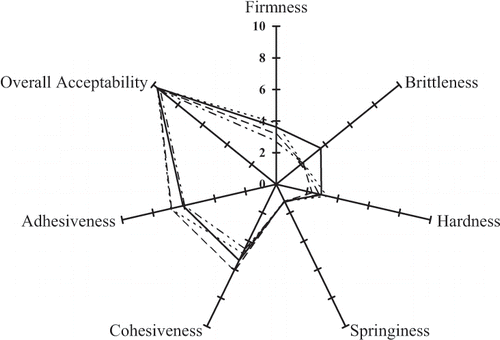
In addition to the TPA results, sensory response also argues that the four candy variants are organoleptically related. Naturally, some variation is observed, for example, in brittleness. To assess the importance of the experimental spread, multivariate analysis was implemented using a computerized algorithm.[Citation29] It was verified that candies had neither significant differences between themselves nor between the judges at p = 0.01 level of confidence. The overall acceptability is high, an outcome that further supports our position of the suitability of the Umesilla candy as an inexpensive substitute of more established products in terms of texture and mouthfeel.
Finally, an attempt was made to assess the extent of correlation between the sensory QDA and instrumental TPA for the date candies. The adopted method advocates grouping of data into clusters of common characteristics that can improve classification of various identities. The analysis has found application in the description of sensory characteristics or evaluation of their similarities to each other for sausages made from different recipes, peas of different varieties and degree of maturity, and various cheese products.[Citation30]
reproduces our efforts to consider the multiple attributes of texture and sensory simultaneously and judge upon their correlation. In doing so, a dendrogram was constructed using the computerized algorithm provided by GenStat (7th edition). Preparation of Khalas and Umesilla samples resulted in four different candies. Each one of them was examined using QDA and TPA thus creating eight sets of data. Within each set, the corresponding sensory or textural attributes were treated statistically to produce one entry on the y axis (product identification) of the dendrogram. It is encouraging that in the absence of “out-of-spec” results, the dendrogram exhibits strong clustering. The highest similarity is within the sensory or textural families of data which, for most of them, an impressive correlation is achieved ranging between 97 and 99%.
Figure 5 The dendrogram that reproduces the level of correlation between the textural and sensorial attributes of the four date candies (t: texture; s: sensory; c: cooked; uc: uncooked; u: Umesilla; k: Khalas).
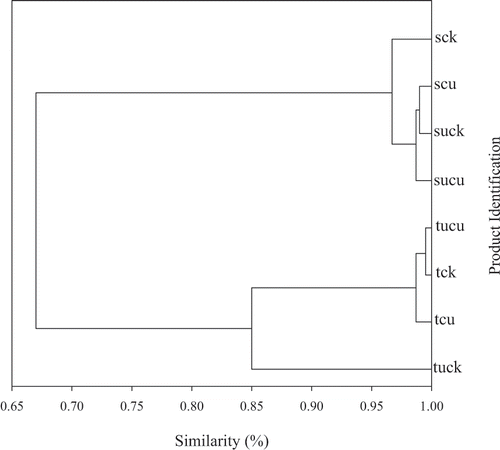
The textural characteristics of uncooked Khalas candy also fall in place with the rest of its group at an 85% level of similarity. Gratifyingly, a clear passage is demarcated between the rapidly generated laboratory data of texture and the sensory response of trained panelists at 67% correlation. Furthermore, the connection between the two major groups so formed establishes a clear direction from the individual textural characteristics (attributes) of a product in one group to the sensory response of the same or another product in the second group. Thus a reliable way of measuring the similarity or dissimilarity (distance) between every object and quality-control properties within that entity has been construed.
CONCLUSIONS
The work constitutes an attempt to gain insights into the relationship between the chemical, compositional, textural, and sensorial characteristics of processed date candies. Successful product development requires utilization of inexpensive raw materials into date formulations, however, maintaining acceptable mouthfeel characteristics. This was achieved presently by incorporating Umesilla date in end products and achieving instrumental and sensory responses similar to those of Khalas candies. In doing so, the work provided guidelines of interpretation and translation of the language of different disciplines into an industrial formulation based on acceptance criteria of consumer wishes. The connection achieved between instrumental textural attributes and sensory responses should provide immediate feedback on the effect of ingredients on consumer expectations thus contributing to more successful commercial products and more satisfied consumers.
ACKNOWLEDGMENTS
Support from the project: “Improvement of date palm production and dates quality in the Sultanate of Oman” (SR/AGR/PLNT/01/01) is acknowledged. I. Al-Bulushi, I. Al-Marhoobi, and L. Al-Kharousi are thanked for technical support.
REFERENCES
- Anonymous . 2003 . The National Strategic Plan of the Development of Date Palms and the Working Plan , 1 – 7 . Muscat, Oman : Ministry of Agriculture and Fisheries .
- Szczesniak , A.S. 1963 . Classification of textural characteristics . J. Food Sci , 28 : 385 – 389 .
- Bourne , M.C. 1988 . “ Basic Principles of Food Texture Measurement ” . In Lecture Text of Dough Rheology and Baked Products Texture , Chicago, , USA : Workshop .
- Bourne , M.C. 1978 . Texture Profile Analysis . Food Technol , 32 : 62 – 66 . 72
- Szczesniak , A.S. 1966 . Texture Measurements . Food Technol , 20 : 55 – 58 . 50
- Al-Hooti , S. , Sidhu , J.S. , Al-Otaibi , J. , Al-Ameeri , H. and Qabazard , H. 1996 . Processing of some important cultivars grown in the United Arab Emirates into chutney and date relish . Journal of Food Processing and Preservation , 31 : 55 – 68 .
- Al-Hooti , S. , Sidhu , J.S. , Al-Otaibi , J. , Al-Ameeri , H. and Qabazard , H. 1997 . Date bars fortified with almonds, sesame seeds, oat flakes and skim milk powder . Plant Foods for Human Nutrition , 51 : 125 – 135 . [INFOTRIEVE] [CROSSREF]
- Myhara , R.M. , Al-Alawi , A. , Karkalas , J. and Taylor , M.S. 2000 . Sensory and textural changes in maturing Omani dates . J Sci Food Agric , 80 : 2181 – 2185 . [CROSSREF]
- Al-Hamadan , A.M. 2002 . Rheological properties of a newly nutritious dairy drink from milk and date extract concentrate (Dibbs) . International Journal of Food Properties , 5 : 113 – 126 . [CROSSREF]
- Hassan , B.H. 1991 . Viscosity models for single strength and concentrate date-water extracts . Bulletin of Faculty of Agriculture, University of Cairo , 42 : 753 – 772 .
- Hassan , B.H. 1992 . Viscometric behavior of single strength and concentrated date-water extracts . Journal of King Saud University , 4 : 3 – 13 .
- Hobani , A.I. 1998 . Rheological behavior of date-water concentrates . Journal of Food Engineering , 36 : 349 – 357 . [CROSSREF]
- Al-Rawahi , A.S. , Kasapis , S. and Al-Bulushi , I.M. 2005 . Development of a date confectionery. Part 1. Relating formulation to instrumental texture . International Journal of Food Properties , 8 : 457 – 468 .
- Malone , M.E. , Appelqvist , I.A.M. and Norton , I.T. 2003 . Oral behaviour of food hydrocolloids and emulsions. Part 2. Taste and aroma release . Food Hydrocolloids , 17 : 775 – 784 . [CROSSREF]
- Lawless , H. T. and Heymann , H. 1998 . Sensory Evaluation of Food, principles and practices , 444 – 449 . New York, , USA : International Thomson Publishing .
- Hamad , A.M. and Yousif , A.K. 1986 . “ Evaluation of brine and salt—stock pickling of two date varieties in the kimri stage ” . In Second Symposium on Date Palm , 245 – 256 . Al-Hassa, , Saudi Arabia : King Fiasal University .
- Yousif , A.K. , Ahmad , S.S. and Mirandilla , W.A. 1986 . “ Developing of a nutritious beverage from concentrated date syrup and powdered milk ” . In Second Symposium on Date Palm , 121 – 130 . Al-Hassa, , Saudi Arabia : King Fiasal University .
- Yousif , A.K. , Morton , I.D. and Mustafa , A.I. 1986 . “ Studies on date paste (1). Evaluation and Standardization ” . In Second symposium on date palm , 85 – 91 . Al-Hassa, , Saudi Arabia : King Fiasal University .
- Richardson , R.K. and Kasapis , S. 1998 . “ Rheological methods in the characterisation of food biopolymers ” . In Instrumental Methods in Food and Beverage Analysis , Edited by: Wetzel , D.L.B. and Charalambous , G. 1 – 48 . Amsterdam : Elsevier .
- Gupta , B.B. , Kasapis , S. and Alevisopoulos , S. Water-continuous spread . UK Patent 2 323 092 B . 2001 .
- Chumchuere , S. , MacDougall , D.B. and Robinson , R.K. 2000 . Production and properties of semi-hard cheese made from soya milk . International Journal of Food Science and Technology , 35 : 577 – 581 . [CROSSREF]
- Martinez , O. , Salmeron , J. , Guillen , M.D. and Casas , C. 2004 . Texture profile analysis of meat products treated with commercial liquid smoke flavourings . Food Control , 15 : 457 – 461 . [CROSSREF]
- Devatkal , S. , Mendiratta , S.K. and Kondaiah , N. 2004 . Quality characteristics of loaves from buffalo meat, liver and vegetables . Meat Science , 67 : 377 – 383 . [CROSSREF]
- Labbe , D. , Rytz , A. and Hugi , A. 2004 . Training is a critical step to obtain reliable product profiles in a real food industry context . Food Quality and Preference , 15 : 341 – 348 . [CROSSREF]
- Curt , C. , Trystram , G. , Nogueira-Terrones , H. and Hossenlopp , J. 2004 . A method for the analysis and control of sensory properties during processing – application to the dry sausage process . Food Control , 15 : 341 – 349 . [CROSSREF]
- Longares , A. , Monahan , F.J. , O'Riordan , E.D. and O'Sullivan , M. 2004 . Physical properties and sensory evaluation of WPI films of varying thickness . Lebensm.-Wiss. u.-Technol , 37 : 545 – 550 . [CROSSREF]
- Rose , G. , Laing , D.G. , Oram , N. and Hutchinson , I. 2004 . Sensory profiling by children aged 6–7 and 10–11 years. Part 1: a descriptor approach . Food Quality and Preference , 15 : 585 – 596 . [CROSSREF]
- Stone , H. , Sidel , J.L. , Oliver , S. , Woolsey , A. and Singleton , R.C. 1974 . Sensory evaluation by quantitative descriptive analysis . Food Technol , 28 : 24 – 34 .
- SAS . 1996 . SAS user's guide: statistics , Raleigh, NC : SAS Institute .
- Dahl , T. and Næs , T. 2004 . Qutlier and group detection in sensory panels using hierarchical cluster analysis with the Procrustes distance . Food Quality and Preference , 15 : 195 – 208 . [CROSSREF]