Abstract
Near-infrared radiative properties are important in existing, as well as novel radiant heating processes, such as when using a halogen lamp. Spectral reflectance, transmittance, and penetration depth of electromagnetic energy in the near-infrared region are measured using a spectroradiometer for potato tissue as a function of its moisture content. Reflectance has a spectral dependence and increases as moisture content increases, thus decreasing the fraction of incident energy available to the food. Penetration depth is a strong function of moisture and can vary significantly with wavelength. Penetration depth for near-infrared is smaller than for microwave, although they are of the same order of magnitude.
INTRODUCTION
Thermal infrared radiation is generally considered to be in the range of 0.1–100 μm and is typically divided into near-infrared (0.75–3 μm), mid-infrared (3–25 μm), and far-infrared (25–100 μm). Infrared heating is important in many common food processing operations such as baking, roasting, blanching, and surface pasteurization, due to its intense heating (high heat flux) capability and small penetration depth. In baking, for example, desirable characteristics such as crust formation and color development occur with radiative heating.[Citation1, Citation2] In microwave heating, where significant moisture can accumulate at the surface of a food leading to a soggy (as opposed to a crunchy) texture, the addition of infrared can aid in the enhanced removal of surface moisture,[Citation3] making crust and color formation possible. Increased numbers of food processing appliances are being introduced with combination heating that includes infrared heating.[Citation4, Citation5, Citation6] Although the depth penetration of infrared heating in food surfaces is generally small, it is not always so dependent on food and wavelength combinations. For example, in near-infrared radiation from a halogen source, penetration can be significant. Food surfaces are semi-transparent in general and radiation absorption is not just a surface property (as in opaque, solid materials). As expected, these radiation properties vary with the wavelength spectrum of the source radiation.
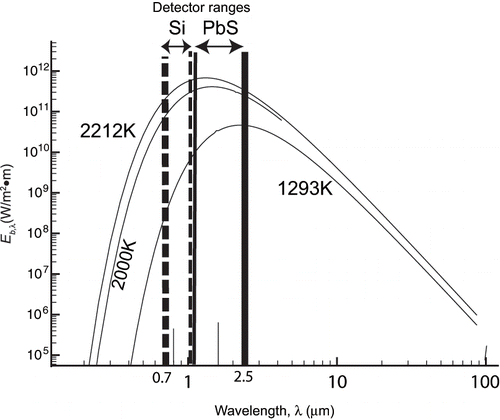
A ceramic rod (the most commonly used infrared source) and a halogen source emit infrared radiation in different wavelength ranges. Ceramic rods have a maximum emissive power of the order of 1010 W/(m2 · m) near a wavelength of 2.3 μm, at 1293 K. Halogen lamps, on the other hand, have a maximum emissive power of the order of 1011 W/(m2 · m), near a wavelength of 1.3 μm, at 2212 K. (Representative emission spectra appear later in .) A portion of the emissive power of halogen lamps is in the visible light range, which is why the halogen (near-infrared) heating mode is sometimes referred to as “light” heat.
Figure 3 Spectral emissive powers (blackbody radiation) of ceramic tube (1293 K) and halogen lamp (2212 K) emitters at their typical temperatures with the detector ranges for Si and PbS super-imposed.
Properties relevant to the infrared heating of foods have rarely been reported in the literature, with the exception of two comprehensive studies that include large volumes of data.[Citation7, Citation8] The data include the spectral transmittance and reflectance properties (explained later), and the variation of the properties with food thickness. The work in Ginzburg[Citation7] did not include variations with moisture content, while the data in Il'yasov and Krasnikov[Citation8] showed a deviation from an energy balance, which was attributed by Sandu[Citation9] to technical difficulties in the measurements. In studying the attenuation of infrared radiation in different foods (pork, potato, and bread), Dagerskog and Osterstrom[Citation10] notes radiative scattering effects as in Cinzburg[Citation7] for the reflectance variation with thickness.
Literature on radiative properties that exists elsewhere may benefit us in studying food materials. For example, in paper drying, the dependence of optical properties with wavelength and moisture content has been studied.[Citation11] The reflectance of paper decreases with an increase in moisture content. The radiative scattering in paper is discussed in Pettersson and Stenstrom.[Citation12] A theoretical model is presented to explain the infrared attenuation, assuming paper is made of homogeneous layers. In ceramics, the dependence of radiative properties on material porosity is studied in Hendricks and Howell,[Citation13] where the transmittance of a reticulated porous ceramic decreases with decreasing pore size.
In the food, as well as in the non-food literature, the dependence of radiative properties on moisture content has not been fully investigated. For non-food materials,[Citation14] the attenuation of electromagnetic radiation in a matrix cannot be predicted simply from the properties of the dried matrix and the amount of water, i.e., it is not simply an additive effect. In a food material such as potato, a highly porous and open structure that is filled with water, the complex scattering and interference of radiation within the structure has not been studied.
This article is organized as follows: the spectroradiometer used to collect data is described, followed by descriptions of the measurement process, and the preparation of the potato tissue samples. Spectral reflectance and transmittance data are collected in the near-infrared range of 0.7–2.5 μm, some as functions of moisture content, and potato thickness. The radiation penetration depth is calculated from the transmittance data as a function of moisture content. Spectral absorptance is also calculated from the reflectance and transmittance data.
DEFINITION OF TERMS
A few definitions may be helpful. More comprehensive treatments are available elsewhere.[Citation15] We adopt the framework sketched in , where an incident flux of radiant energy, I, impinges on a food surface. The incident flux, I, may be directional or come from the whole hemisphere above the surface. A part of the incident flux will typically be reflected back to the hemisphere above the surface as a result of surface reflection. We denote the reflected radiant flux by R. The difference between I and R, (I – R), crosses the surface at x = 0 and enters the food layer. Of this, a radiant flux of amount T may be transmitted across the food layer of thickness s and emerge to the spatial hemisphere below the bottom surface. Thus, from an energy balance, the amount of radiant energy, A, absorbed in the food layer is given by A = (I – R) – T. The energy A is converted to heat in the food layer.
Figure 1Schematic illustrating the radiation interchange for a food layer of thickness s. I is the incident radiation, R is the reflected radiation, and T is the transmitted radiation. The energy crossing the food surface is I–R.
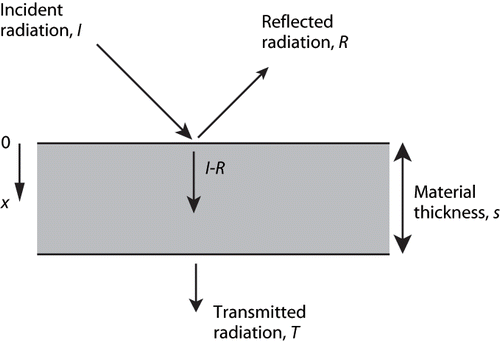
We next introduce the standard reflectance, transmittance and absorptance coefficients for the processes sketched in . All variables are wavelength dependent but the λ subscript is suppressed.
-
Hemispherical Reflectance, ρ, is the fraction of the incident radiation onto a surface from the overlying hemisphere that is reflected back to the hemisphere. Mathematically, in , it is given by ρ = R/I.
-
Hemispherical Transmittance, τ, is the fraction of the incident radiation from the hemisphere that crosses the food layer of total thickness, s, and is given by τ = T/I.
-
Hemispherical Absorptance, α, is the fraction of the incident radiation from the hemisphere that is absorbed in the food layer; it is given by the ratio α = A/I, where A is the absorbed energy. Since energy is conserved, we can also write that ρ + τ + α = 1, and the absorptance for the layer of thickness s is α = 1 – ρ – τ.
The foregoing are global quantities for the food layer. We next assume, as is common, that the transmitted flux follows Beer's Law. This is supported by measurements on related problems.[Citation13, Citation15] Thus, the transmitted flux across a food layer of thickness s may be approximated by
where δ is an attenuation coefficient, also known as the penetration depth. It is the food thickness, s, for which the radiant flux I – R in decays to 37% (i.e., 1/e) of its initial value.
The quantities on the left side of EquationEq. 1 appear in . By dividing the numerator and denominator by the incident radiant flux I, and using α = 1 – ρ – τ, we have
Our experimental strategy will be to measure ρ and τ for somewhat thick (≥ 1 cm) food layers. Then, in a set of studies on thin (≤ 2 mm) food layers, to measure τ and fit EquationEq. 2 to the data to get the penetration depth δ. In the studies, the food moisture content is varied. Details are provided in the next section.
METHODOLOGY
Spectral hemispherical reflectance (ρ) and transmittance (τ) measurements on heat-treated potato tissue at various moisture contents and thicknesses (s) were carried out using a spectroradiometer.
Spectroradiometer
The spectroradiometer is a Model OL 750 from Optronic Laboratories, Inc., Orlando, Florida; a schematic is shown in . The system consists of a visible-IR dual source attachment Model 740–20 D/IR; a monochromator Model 750 M-S; an integrating sphere attachment Model 740–70; and silicon and PbS detectors. The two detectors vary in their useful ranges with the silicon detector being used in the near-infrared and the PbS detector being used in the mid-infrared (see for detector range definitions). All imaging optics employ first-surface mirrors. The system creates unidirectional, monochromatic incident radiation (1.2 mm beam diameter) that impinges on flat, 2.5 cm diameter disk samples of varying thickness. The sample locations for the separate transmittance and reflectance measurements are shown in . The samples are mounted at either of two different ports of an integrating sphere. Incident radiation is centered on the test sample disks and arrives at an angle of 10° from the surface normal. The test sample external boundaries are kept non-reflective. All measurements were taken at room temperature in a controlled-atmosphere laboratory.
Figure 2 Spectroradiometer system layout for diffuse reflectance and transmittance measurements.[Citation20]
![Figure 2 Spectroradiometer system layout for diffuse reflectance and transmittance measurements.[Citation20]](/cms/asset/ffd96479-b55f-42db-9752-e0ee39311d4e/ljfp_a_185298_o_f0002g.gif)
Thermal infrared source
The OL 740–20 Source Attachment provides a stable irradiance source for reflectance and transmittance measurements. For our studies, we used a 150 W quartz-halogen lamp as the radiation source. The lamp is a compact DZE type lamp that is appropriate for the 0.25 to 3.5 μm wavelength range.
Measurement Process
Reflectance measurements employ a comparison method using a calibrated sample of known reflectance in the reference port, and a test sample in the comparison port; to complete one measurement, the incident beam is first directed at the reference port, and then the comparison (sample) port. Transmittance measurements, on the other hand, are carried out by first doing a calibration scan with the incident beam passing through an empty transmittance port (100% transmittance), and then completing a scan after a test sample is placed in the transmittance port. The software automatically provides the percentage reflectance relative to the reference surface (which has a 99% reflectance) or the percentage transmittance; both as a function of the radiation wavelength. The reflectance corresponds to the hemispherical reflectance for reflection to the hemisphere above the test sample; the transmittance corresponds to the transmittance to the full hemisphere below the test sample. With respect to , the reflectance corresponds to ρ = R/I and the transmit-tance to τ = T/I. Raw potato being a material with very high moisture content (> 85%), we limited our investigation to the wavelength range of 0.7 to 2.5 μm, beyond which water shows a nearly constant and high value of absorptance.[Citation16]
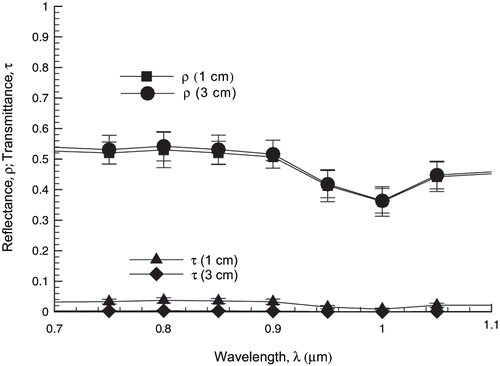
To verify the isotropic assumption for the potato media, measurements were made by rotating a potato sample (1 cm thickness) in the sample holder to three different positions, corresponding to the initial position, and 90° and 180° rotations about the sample normal from the initial position. No significant difference in the measurements was noticed.
Measurement uncertainties in reflectance and transmittance are estimated to be ± 10%. This is determined by measuring repeatability on a variety of samples and using different spectroradiometer configurations in overlapping wavelength bands. The instrument itself is designed for accuracy to ± 1%.
Sample Preparation
Sample thickness
Potato tissue is the chosen food material due to its availability and easy sample preparation. Disks were cut from raw potatoes, 2.5 ± 0.2 cm in diameter and 1.0 ± 0.2 cm thickness. To measure transmittance for the penetration depth calculation, thin slices were taken out of the thicker samples using a micrometer blade. Due to the difficulty in getting thin samples of thickness ∼ 0.2 mm, samples were sliced near the desired thickness and their actual thicknesses were measured with a digital caliper (Fowler Ultra Cal Mark III, Fred. V. Fowler Co., Inc.). Thickness values for the thin samples were found by averaging the measurements for three different positions along a sample diameter. The measured reflectance has little dependence on thickness for thick samples, as shown in .
Heat treatments
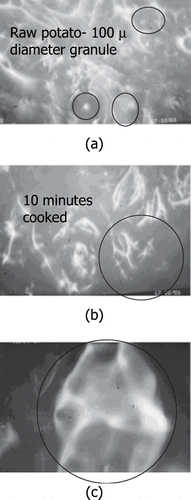
To avoid the enzymatic darkening that can occur from exposure to oxygen, the potato tissues were first boiled in water. To make sure that properties were not affected by the two different boiling processes used of 5 and 10 minutes under microwave heat, the results were compared with those of raw potato (). The largest variation in spectral reflectance occurs between the raw and the cooked samples. There appears to be not as much variation between the two heat treatments. The results in can be explained because of different starch gelatinization stages in the potato tissue, as can be seen in .
Figure 5 Variation of spectral hemispherical reflectance, ρ, of potato tissue with different heat treatments (raw and heated in water for 5 and 10 minutes, respectively), showing the largest variation occurring between raw and heated samples.
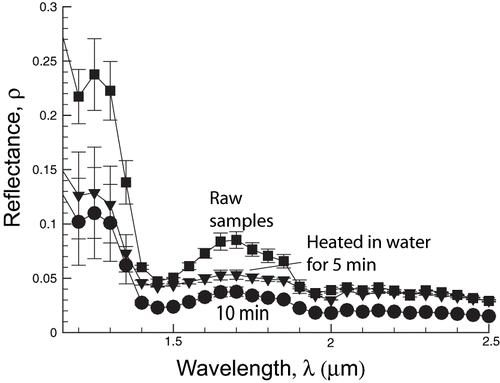
Figure 6 Pictures of (a) raw potato sample, (b) same potato sample after 10 minutes of cooking in boiling water, and (c) an enlargement (three times) of detail in (b). Pictures taken with Metallurgical microscope, Model ML-MET (Meiji Labax Co. Ltd, Tokyo, Japan).
To obtain the effect of moisture content, samples were first placed in water for 10 minutes at 100°C under microwave heating. For high moisture content, the samples were left to equilibrate at a room temperature of 21°C. Reduced moisture samples were prepared from previously cooked samples and dried using high velocity air at approximately 75°C for different times. The thinner samples were held between two metal screens during this process to avoid warping.
Moisture content measurement
Samples were left to equilibrate at room temperature in a container with silica gel, and their weights were measured before and after each optical property determination. The gravimetric method is used to determine moisture content by keeping the samples in an oven (Blue Line, Blue M Electric Co.—model OV 18 SA) for 24 hours at 60°C.
Calculation of Penetration Depth
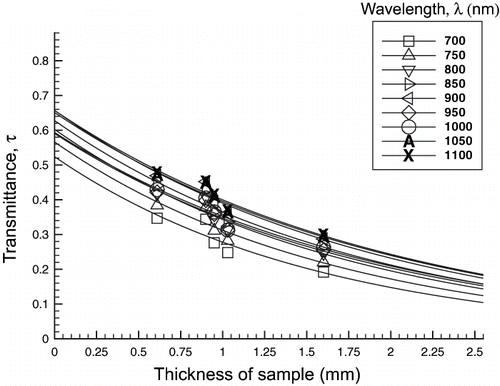
The penetration depth was found by fitting the exponential equation, EquationEq. 2, to the transmittance data for a range of sample thicknesses. Typical exponential curves and subsequent R 2 values for a moisture content of 82% can be seen in , for radiation wavelengths ranging from 700 to 1100 nm.
Figure 7 Transmittance, τ, for various thicknesses of potato tissue illustrated for 82 ± 2% moisture content. Lines are fitted through data points using EquationEq. 2. The R 2 values ranged from 0.862 to 0.996 for various wavelengths and moisture contents.
RESULTS AND DISCUSSION
Variation of Spectral Radiation Properties with Moisture Content
Hemispherical reflectance values for potato tissue at three levels of moisture content are shown in . The decrease in reflectance with decreasing moisture content can be explained by considering the change in the porous matrix of the potato tissue. The cellular pores that contain the starch are mainly sustained by a complex matrix of cellulose and water. With water being removed from this matrix, a collapse is expected, resulting in both smaller cellulose pore and starch granules, which results in less scattered energy at the surface. The change in color intensity of the dried samples from light yellow to deep yellow is a good indicator of this change in structure.
Figure 8 Spectral hemispherical reflectance, ρ, in potato tissue at various moisture contents (shown in percentages with associated error). Samples are of 1 cm thickness.
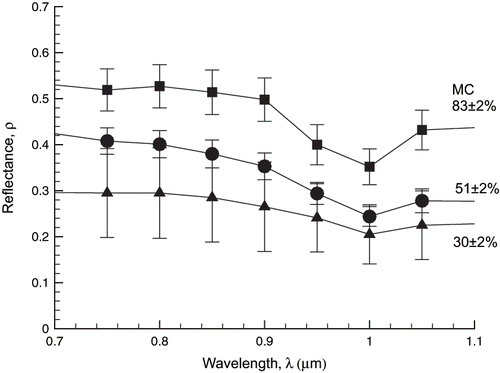
The dependence of the spectral hemispherical transmittance on moisture content, on the other hand, cannot be explained in the same way. Although we would expect transmittance to increase with less water in the energy path, the collapse of pores right at the surface would change the matrix allowing for the absorption to change at the surface. This is also discussed below in the results for penetration depth.
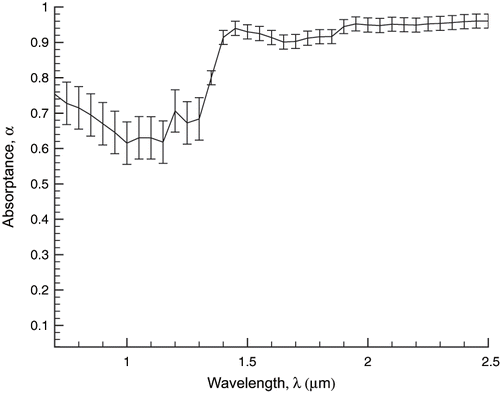
Absorptance is calculated using α = 1 − ρ − τ. shows absorptance values for the 0.7–2.5 μm range for a 1 cm thick sample with a moisture content of 51%. The figure implies that for radiative heat exchange calculations in food materials that involve the near-infrared range of wavelengths, such as when a halogen light is used, the spectral variation of the absorptance probably should be considered.
Spectral Variation of Penetration Depth with Moisture Content
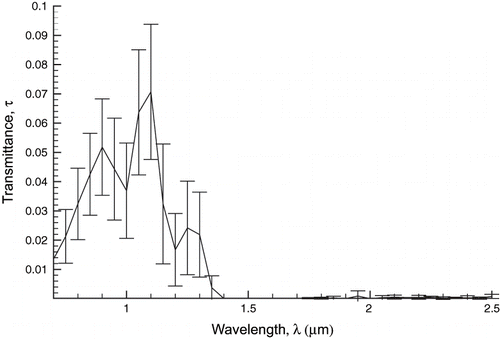
The data points in show the transmittance, τ, as a function of sample thickness, s, at a moisture content of 82 ± 2% in the wavelength range of 0.7–1.1 μm. This wavelength range is chosen due to the significant spectral dependence of transmittance in the 0.7–2.5 μm range (two orders of magnitude at 1.4 μm), as can be seen from . The latter figure also shows cutoffs below about 0.7 μm and beyond 1.4 μm.
Figure 10 Spectral hemispherical transmittance, τ, for raw potato tissue at 86% moisture content and 1 cm thickness.
The penetration depth, δ, was found from the transmittance data (τ-values) as a function of thickness (s-values) in by fitting EquationEq. 2, an exponential decay, for each wavelength. There is also an amplitude multiplier (1 − ρ) in EquationEquation 2 when fitting the measured τ-values to the s-values. This multiplier is calculated during the fitting process, but is not considered further here, as it essentially involves the reflectance ρ of a thin layer (s → 0) (which is ill-defined and lower than the reflectance of a thick layer). This curve fitting procedure is repeated to obtain penetration depths for moisture contents of 82, 77, 72, 70, and 67%, respectively. shows the spectral variation of the calculated penetration depth for the various moisture contents. As shown in , penetration depth seems to go through a minimum as moisture content is decreased from initially high values. At higher moisture levels, there appears to be generally an increase in penetration depth with wavelength. At a moisture content of 72%, we observe the minimum penetration depth. At lower moisture levels (70 and 67%), there appears to be an increase in penetration depth at all wavelengths relative to the minimum curve and mixed trends at longer wavelengths.
Figure 11 Spectral variation of penetration depth, δ, for potato tissue at various moisture contents (shown in percentage). Penetration depth is calculated as noted in .
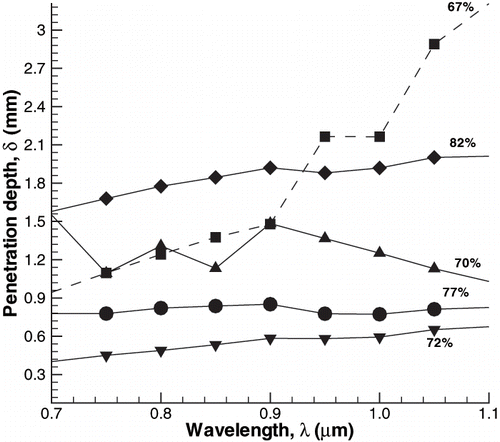
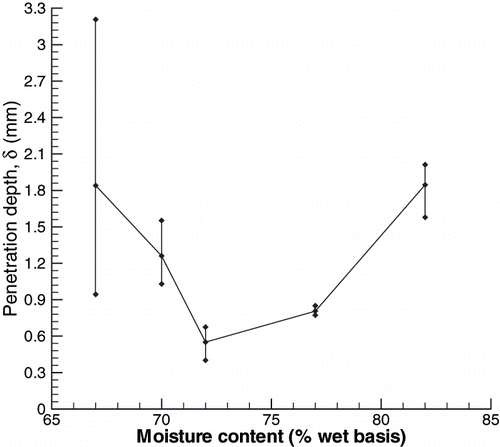
An alternate presentation of the penetration depth data appears in where the wavelength-averaged penetration depth values are plotted as a function of moisture content. The bars denote the range of data at the corresponding wavelength in . Correlation coefficients for fitting the transmittance data with exponential decays are not given here for all the moisture contents and wavelengths due to lack of space and can be found in.[Citation17] While most of the correlations stayed between 0.85–0.98, a few correlations at 67% (at 1, 1.05, and 1.1 μm) moisture were rather low and penetration depth data for this moisture content at 1, 1.05, and 1.1 μm are questionable. These low correlation coefficients for the 67% moisture data are a possible explanation at these wavelengths for the extremely large values of penetration depth (in ) and the range of variation (in ). Thus, generally speaking, the average penetration depths, δ, were found with apparent good reliability. The average penetration depth values () are of the order of 1 mm.
Penetration Depth for Near-infrared Heating and Microwave Heating Compared
One of the goals in studying how infrared energy behaves at food surfaces is to be able to combine in an effective way the infrared energy (that heats mostly near the surface) with microwave energy (that typically heats more volumetrically) in a judicious manner. Thus, it is useful to compare the penetration depth of microwave energy (defined in a similar way as Beer's law in EquationEq. 1) with that of infrared energy.
Penetration depths for raw potato in the near-infrared region are approximately 1 mm from this study. By comparison, penetration depths for microwaves at a frequency of 2.45 GHz have been reported as 4.8 mm[Citation10] and 8.7 mm.[Citation18] To compare with another food material, literature data for ham shows penetration depth of 2.4 mm in the near-infrared[Citation10] and 4.8 mm for microwaves at 2.45 GHz.[Citation19] Thus, penetration depths in the near-infrared are smaller than for microwave energy.
CONCLUSIONS
The spectral hemispherical reflectance and transmittance of food layers were measured for potato tissue as a function of moisture content in the near-infrared region. Reflectance has a spectral dependence (changes with wavelength) and increases with increasing moisture content, thus decreasing the fraction of incident energy available for absorption in the food. This has important consequences for radiative exchange where such moisture and spectral dependencies may need to be considered. The penetration depth that characterizes the transmission of energy into the food is a strong function of moisture and can vary significantly with wavelength. The penetration depth for near-infrared is smaller than for microwave, implying greater heating near the surface, although both depths are of the same general order of magnitude. This has implications when infrared is combined with microwave heating, as the two modes of heating can effectively be similar as opposed to being separate and complementary. The surface structure of the food can also have a significant effect on the radiation balance at the surface and this effect varies with moisture content and wavelength.
ACKNOWLEDGMENTS
The authors would like to thank Steve Westin and Hongsong Li of the Cornell Program of Computer Graphics (PCG) for assistance. The radiation measurements were carried out by the lead author in the Light Measurement Laboratory of the PCG, which is supported in part by NSF Grants ACI–0113851, ASC–8920219, and CTS–9213183.
Notes
17. Almeida, M.F. Modeling Infrared and Combination Infrared-Microwave Heating of Foods in an Oven. PhD thesis, Cornell University, 2004.
19. Zhang, H. Electromagnetic and Thermal Studies of Microwave Processing of Foods. PhD Thesis, Cornell University, 2000.
REFERENCES
- Dagerskog , M. and Sorenfors , P. A . 1978 . comparison between four different methods of frying meat patties. I. Heat transfer, yield and crust formation . Lebensmittel-Wissenschaft u. Technologie , 11 : 306 – 311 .
- Shibukawa , S. , Sugiyama , K. and Yano , T. 1989 . Effect of heat transfer by radiation and convection on browning of cookies at baking . Journal of Food Science , 54 ( 3 ) : 621 – 624 . 699
- Ni , H. , Datta , A.K. and Torrance , K.E. 1999 . Moisture transport in intensive microwave heating of biomaterials: A multiphase porous media model . International Journal of Heat and Mass Transfer , 42 : 1501 – 1512 .
- Moulinex , S.A. Electric Microwave Oven with Improved Energy Distribution . US Patent 6002120 . filed February 23, 1998 and issued December 14, 1999
- General Electric . Radiant Oven . US Patent 6068146 and 6018146 . filed December 28, 1998 and issued January 25, 2000
- LG Electronics Inc . Microwave Oven Having Halogen Lamps . US Patent 6172347 . filed July 29, 1999 and issued January 19, 2001
- Ginzburg , A.S. 1969 . Application of Infra-red Radiation in Food Processing , London : Leonard Hill Books .
- Il'yasov , S.G. and Krasnikov , V.V. 1991 . Physical Principles of Infrared Irradiation of Foods , New York : Hemisphere Publishing Corporation .
- Sandu , C. 1986 . Infrared radiative drying in food engineering: A process analysis . Biotechnology Progress , 2 ( 3 ) : 109 – 119 .
- Dagerskog , M. and Osterstrom , L. 1979 . Infrared radiation for food processing I. A study of the fundamental properties of infrared radiation . Lebensmittel-Wissenschaft u. Technologie , 12 : 237 – 242 .
- Ojala , K.T. and Lampinen , M.J. 1995 . Modeling, Measurements and Efficiencies of Infrared Dryers for Paper Drying, Handbook of Industrial Drying , Edited by: Mujumdar , A.S. Vol. 2 , 931 – 976 . New York : Marcel Dekker, Inc .
- Pettersson , M. and Stenstrom , S. 1998 . Absorption of infrared radiation and the radiation transfer mechanism in paper. Part I: Theoretical model . Journal of Pulp and Paper Science , 24 ( 11 ) : 349 – 355 .
- Hendricks , T.J. and Howell , J.R. 1996 . New radiative analysis approach for reticulated porous ceramics using discrete ordinates method . Journal of Heat Transfer , 118 : 911 – 917 .
- Junqueira , S.L.M. and Lage , J.L. 1999 . The fluid effect on the effective attenuation coefficient of a fully saturated porous medium under laser radiation . Experimental Heat Transfer , 12 : 157 – 174 .
- Siegel , R. and Howell , J.R. 1981 . Thermal Radiation Heat Transfer , Washington, DC : Hemisphere Publishing Corporation .
- Touloukian , Y.S. 1976 . Thermophysical Properties of Matter , New York : IFI/Plenum Publishing Corporation .
- 17. Almeida, M.F. Modeling Infrared and Combination Infrared-Microwave Heating of Foods in an Oven. PhD thesis, Cornell University, 2004.
- Nelson , S.O. Jr. , Forbus , W.R. and Lawrence , K.C. 1994 . Microwave permittivities of fresh fruit and vegetables from 0.2 to 20 GHz . Transactions of the ASAE , 37 ( 1 ) : 183 – 189 .
- 19. Zhang, H. Electromagnetic and Thermal Studies of Microwave Processing of Foods. PhD Thesis, Cornell University, 2000.
- Optronic Laboratories . 1995 . Improving integrating sphere design for near-perfect cosine response , Orlando, FL : Internal Publication .
