Abstract
Accurate food and nutrient information is important on several levels, from improving individual health to enabling manufacturers to comply with regulations governing food production and retailing. This information is obtained by means of many analytical methodologies, which have been developed to measure most of important food nutrients. The overwhelming majority of the analytical techniques currently utilized in food nutrient study are time-consuming, labor-intensive, and relatively expensive. They usually require multistep sample treatment procedures, produce waste, and often some valuable information is lost. Therefore, there is a pressing need for robust, rapid, and nondestructive analytical techniques for analysis of nutrients in foods. The recent explosion in new infrared and fluorescent applications has accelerated the pace of research in food science and technology. An increasing interest in these analytical techniques, coupled with chemometric tools, is attributed to their characteristics as rapid, nondestructive, and precise methods. In this article, we demonstrate the potential of the infrared and fluorescence spectroscopies, along with chemometric tools, to measure and characterize nutritional components of foods such as dairy products, muscle tissue, and cereals.
INTRODUCTION
Food is a complex mixture of nutrients and nonnutritive substances that has a strong impact upon human wellness and performance. Food directly affects individuals by providing nutrients essential for maintaining good health and maximizing genetic potential. The elucidation of the health-promotion role of many biologically active nutrients in foods requires databases of values and analytical techniques to generate data. To quantify food nutrients and create nutrient databases many analytical techniques have been developed. However, much basic information about the nutrient content of foods remains to be collected. Reliable data on fatty acid content, vitamin and mineral levels, and the variation in nutrient content with storage, handling, and processing are not available for a large number of foods. Therefore, there is a considerable demand for new analytical methodologies to determine compositions and nutritional values of foods.
Many analytical techniques are available to quantify important food constituents such as proteins and amino acids, essential fats, sugars, vitamins, and minerals.[Citation1] Among them, there are chromatography, enzymatic techniques, atomic absorption spectroscopy, immunochemical assays, and mass spectrometry. Almost all the analytical methodologies based on these techniques require a number of manipulations to make sample properties suitable for the final quantitative measurements. These manipulations are often of multiple steps including treatment with chemicals and enzymes, isolation, thermal treatment, homogenization, filtration, and so on. For instance, according to a vitamin D assay a sample is subjected to saponification and extraction followed by purification using alumina and silica columns.[Citation1] Fatty acid composition assays based on the gas chromatography also involve relatively time-consuming procedures of fat extraction prior to measurement using a gas chromatography device.[Citation2–4] Most advanced analysis methodologies for proteins and amino acids also require the utilization of sophisticated techniques, such as liquid chromatography, mass spectrometry, electrophoresis, and immunochemical assays.[Citation1, Citation5–7] As one can observe, the analytical techniques discussed previously are comprised of multiple step sample manipulations, which allow quantifying a component of interest using an appropriate instrument. Although these analytical techniques have proven their validity, the widespread application of them in the food and nutritional studies is currently limited. Most of these techniques are characterized as relatively expensive, time-consuming, labor-intensive, and require highly skilled operators. In most applications in food and nutritional studies, users need accurate, simple-in-use, rapid, nondestructive, and relatively low-cost analytical tools, which can be utilized in both fundamental research and industrial applications.
Infrared and fluorescent spectroscopy-based techniques have become increasingly important for a wide variety of analytical applications in biology and chemistry.[Citation8,Citation9] This is due to great technical advances in both instrumentation and data analysis tools in the past two decades. Coupled with multivariate statistical tools such as principal component analysis (PCA), principal component regression (PCR), factorial discriminant analysis (FDA), and partial least squares (PLS) regression, infrared and fluorescent spectroscopies allow to extract information on composition and physicochemical properties of food systems in an accurate, high sensitive, and rapid manner.[Citation10,Citation11] Considering the overall time and cost needed to obtain an analytical result, none of the above mentioned techniques could compete with the infrared and fluorescence techniques presented here.
This article is intended to: (i) provide an overview on the basic measurement principles of infrared and fluorescent spectroscopies; (ii) highlight useful features of the statistical multivariate tools in processing spectral data; and (iii) present some practical applications of infrared and fluorescent spectroscopy-based techniques for the identification and characterization of some food nutrients developed by the authors and other researchers.
PRINCIPLES OF INFRARED AND FLUORESCENT SPECTROSCOPIC TECHNIQUES for DETERMINATION OF NUTRITIONAL CONSTITUENTSIN FOODS
Fluorescence Spectroscopy
Absorption of light by a fluorescent molecule causes the excitation of an electron moving from a ground state to an excited state.[Citation9] After the electron has been excited, it rapidly relaxes from the higher vibrational states to the lowest vibrational state of the excited electronic state. After reaching the lowest vibrational state of the excited electronic state, the excited state may decay to the ground state by the emission of a photon (fluorescence). Due to energy losses, the emitted fluorescence photon always carries less energy than the absorbed photon.[Citation9]
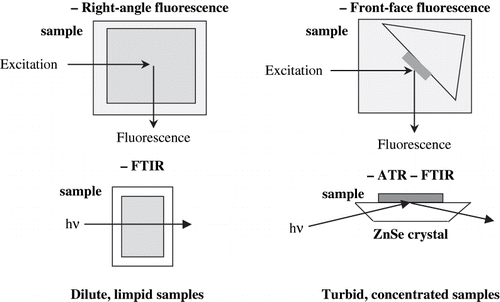
Similarities and differences between right angle and front face fluores‐ cence spectroscopies
Fluorescence spectroscopy offers several inherent advantages for the characterisation of molecular interactions and reactions. First, it is 100 to 1000 times more sensitive than other spectrophotometric techniques, allowing to quantify components present in minute amounts (micro-molar to nano-molar ranges). Second, fluorescent compounds are extremely sensitive to their environment. For example, tryptophan residues that are buried in the hydrophobic interior of a protein have different fluorescent properties than residues that are on a hydrophilic surface. This environmental sensitivity enables to characterize conformational changes such as those attributable to the thermal, solvent or surface denaturation of proteins, as well as the interactions of proteins with other food components. Third, most fluorescence methods are relatively rapid and a spectrum is recorded in less than 1 second with a CCD detector.
If absorbance is less than 0.1, the intensity of the emitted light is proportional to fluorophore concentration and excitation and emission spectra are accurately recorded by a classical right-angle fluorescence device. When the absorbance of the sample exceeds 0.1, emission and excitation spectra are both decreased and excitation spectra are distorted. To avoid these problems, a dilution of samples is currently performed so that their total absorbance would be less than 0.1. However, the results obtained on diluted solutions of food samples can not be extrapolated to native concentrated samples since the organization of the food matrix is lost. To avoid these problems, the method of front-face fluorescence spectroscopy can be used ().[Citation12] Front-face fluorescence allows investigation of the fluorescence of powdered, turbid, and concentrated samples. The method has been used to quantitatively determine hemoglobin in undiluted blood[Citation13] and to study hemoglobin R->T transition kinetics[Citation14] or proteins in wheat gluten.[Citation15] But searching in the literature, we encountered very few papers dealing with the application of front-face fluorescence in the characterization of food products. This could be explained by the fact that food products are complex products containing numerous fluorescent compounds. In such cases, the signals of the different chromophores may overlap and, for example, it becomes difficult to predict the concentration of one particular compound. Recently, fluorescence spectroscopy in combination with multivariate statistical methods has been used for studying quality parameters of “native” samples of milk, cheese, sausage, and meat products.
Figure 1 Fluorescence and infrared spectroscopies for the investigation of dilute solution and food products.
Nature of fluorophores in food products
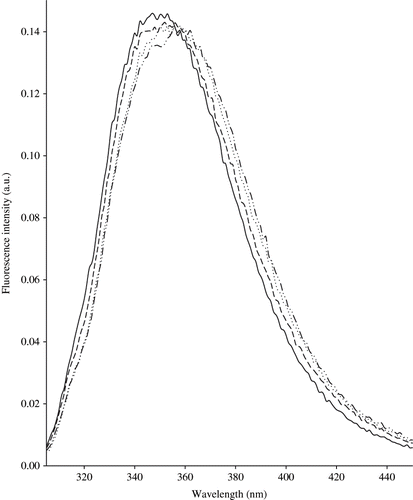
Fluorescence probes or fluorophores represent the most important area of fluorescence spectroscopy. Fluorophores can be broadly divided into 2 main classes: intrinsic and extrinsic. Intrinsic fluorophores are those that occur naturally. They include the aromatic amino-acids – tryptophan, tyrosine, and phenylalanine in proteins, vitamins A, E, and B2, NADH derivatives of pyridoxal and chlorophyll, some nucleotides and numerous other compounds that can be found at low or very low concentrations in food. The fluorescent properties of aromatic amino acids of proteins[Citation9,Citation16] can be used to study protein structure or protein-hydrophobic molecule interactions.[Citation16] Tryptophan is an essential amino acid with a well-characterized fluorescence response. Indeed, the emission spectra of tryptophan residues were recorded at 305–400 nm, with the excitation wavelength at 290 nm ().[Citation17] The fluorescence properties of tryptophan, along with its chromophore moiety-indol ring, have been studied extensively due to its use as a standard optical probe for protein structure and dynamics.[Citation8]
Figure 2 Normalised fluorescence spectra of tryptophan recorded following excitation at 290 nm on central M1 zone (—), external M1 zone (…), central M3 zone (− − −), and external M3 zone (−··−··−) cheeses.
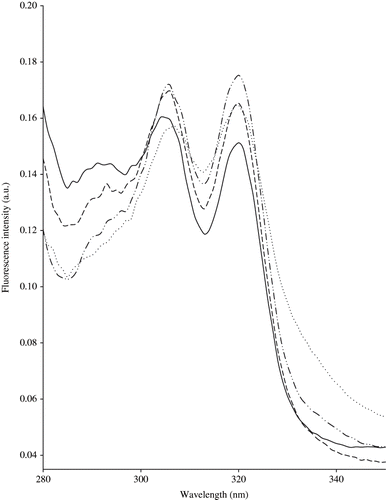
Meat and milk products contain vitamin A in the fats and, due to its conjugated double bonds, vitamin A is a good fluorescent probe.[Citation18] The emission spectrum for meat fat recorded at excitation wavelength of 322 nm show emission peaks at 387 and 440 nm.[Citation19] Based on this, excitation spectra can be then recorded for both emission wavelengths of 387 and 440 nm, showing excitation peaks at approximately 308 and 322 nm (). The spectra have a similar shape, but the highest fluorescent intensity was observed by excitation at 322 nm.
Figure 3 Normalised fluorescence spectra of vitamin A recorded following emission at 410 nm on central M1 zone (—), external M1 zone (…), central M3 zone (− − −), and external M3 zone (−··−··−) cheeses.
Connective tissues are characterized by the presence of fluorescent pyridinoline groups in collagen molecules. Previous reports[Citation20,Citation21] have shown 380 nm to be the best excitation wavelength for this fluorophore, whilst several reports by Swatland,[Citation22–25] Swatland et al.,[Citation26] and Swatland and Findlay[Citation27] have reported 365 nm as a useful excitation wavelength for connective tissues. Identification and quantification of different components of muscle connective tissue, collagen (type I, III, IV, and V) and elastin, have been investigated by intrinsic fluorescence spectroscopy.[Citation21–23] Elastin and collagen type V show the most powerful fluorescence[Citation28] with emission peak around 400 nm when excited at 322 nm, and peaks at 440 and 475 nm after excitation at 380 nm. However, it could be valuable to distinguish fat and connective from meat, using a set of univariate combinations. Skjervold et al.[Citation19] showed that both samples of tendon and purified collagen show maximum florescence at the same wavelengths, using an excitation wavelength of 380 nm. Both tendon and purified collagen showed similar spectra with peaks around 440 nm indicating that this is a useful univariate combination for connective tissue.
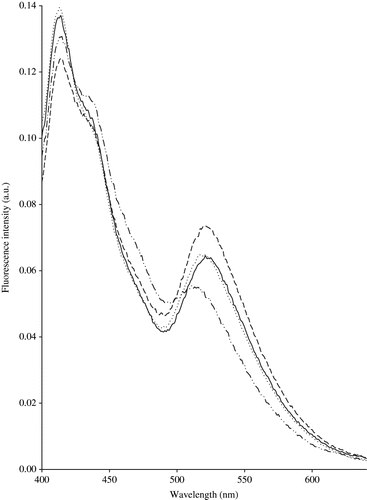
Riboflavin, also known as vitamin B2, is a water soluble vitamin that occurs naturally in foods containing other members of the B2 complex. It has a strong and broad fluorescence emission peak in the region 525–531 nm ().[Citation29,Citation30] Riboflavin is stable to heat, oxidation, and acid, but unstable in the presence of alkali or light, especially ultraviolet light. The vitamin is photo-chemically degraded into different forms, i.e., lumichrome and lumiflavin. These two compounds are also fluorescent with emission maxima in the regions 444 to 479 nm and 516 to 522 nm, respectively. The emission spectra of riboflavin are recorded in the zone ranging between 400 and 640 nm with the excitation wavelength set at 380 nm. The reduction of the fluorescence at about 525 nm might reflect the reduction of riboflavin content. Finally, NADH can be mentioned. The fluorescence emission spectra of NADH show two maxima observed at about 414 and 438 nm following excitation at 336 nm.[Citation31]
Figure 4 Normalised fluorescence spectra of riboflavin recorded following excitation at 380 nm on central M1 zone (—), external M1 zone (…), central M3 zone (− − −), and external M3 zone (−··−··−) cheeses.
One has to consider that food products such as meat contain many compounds that may fluoresce at a given wavelength. For example, following excitation at 280 nm, tryptophan residues of proteins, as well as conjugated linoleic acid (CLA), tyrosine residues, and so on emit photons. So, a spectrum recorded on a food sample following excitation at 280 nm included information on several fluorophores and may be considered as a characteristic fingerprint, which allows the sample to be identified.
Infrared Spectroscopy
Infrared radiation (IR) or the term infrared alone refers to energy in the region of the electromagnetic radiation spectrum at wavelengths longer than those of visible light, but shorter than those of radio waves. The applications of this technique for animal nutrition, agriculture, and food sciences have increased considerably in the last decade.[Citation32,Citation33]
Near infrared spectroscopy
Near infrared (NIR) is defined as the wavelength region from 730 to 2500 nm, lying between the visible light with shorter wavelengths and the infrared light with longer wavelengths (). NIR is widely used for the determination of organic constituents in feeds, foods, pharmaceutical products, and related materials.[Citation34]
Figure 5 Averaged near-infrared spectra for Emmental cheeses from Switzerland (—), Austria (…), and Finland (− − −).
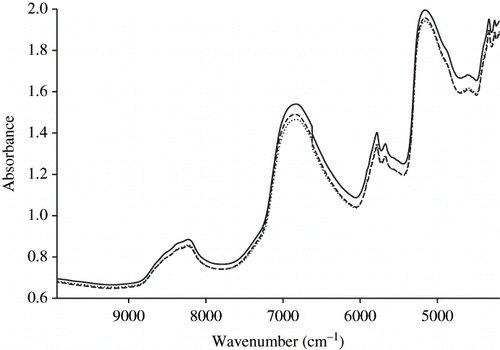
The NIR region is characterized by overtone and combination bands of fundamental vibrations occurring in the mid infrared (MIR). These arise due to the anharmonic nature of molecular vibrations. All organic bonds have absorption bands in the NIR region, whereas minerals may only be detected in organic complexes and chelates or indirectly by their effect on hydrogen bonds. Because of the light mass of the hydrogen atom, overtones, and combination bands of hydrogen bearing functional groups (C-H, O-H and N-H) dominate the NIR spectra of feeds. The NIR region offers some advantages for quantitative analysis of major elements and the sensitivity limit being about 0.15% for most constituents. NIR instruments have a very high signal to noise ratio, which is typically 10000:1.
According to the Beer-Lambert law, the concentration of an absorber (c) is directly proportional to the sample absorbance (A) : c = A/e.l, where e is the molar absorptivity and 1 is the path length. This relationship is fundamental to quantitative absorption spectroscopy and it may be applied not only to transmission measurements, but also to the diffuse reflectance of light scattering materials. The main difference is that the path length of radiation, which is maintained constant in absorption spectroscopy, is affected by light scattering. Scattering occurs when radiation transmitted through the surface and emerging after partial absorption is diffused by random reflections, refractions, and diffractions at further interfaces inside the sample or undergoes further transmittance and absorption at other interfaces. Diffuse reflectance, most commonly used, is applied for particulate material in the wavelength range from 1100 to 2500 nm, whereas transmittance is more commonly measured from 800 to 1100 nm.
The main disadvantage of the NIR is the low sensitivity of the signal to what is compared from, for example, MIR. Indeed, NIR is 10 to 100 times less sensible than MIR as reported by Rodriguez-Otero et al.[Citation34] Low concentration components cannot be expected to be determined with a good accuracy by the use of NIR.
Mid infrared spectroscopy
MIR represents the spectrum of the absorption of all the chemical bonds having an infrared activity between 4000 and 400 cm−1 (). The acyl-chain is mainly responsible for the absorption observed between 3000 and 2800 cm−1, whereas the peptidic bound C-NH is mainly responsible of the absorption occurring between 1700 and 1500 cm−1.
Figure 6 Averaged mid-infrared spectra for Emmental cheeses from Switzerland (—), Austria (…), and Finland (− − −).
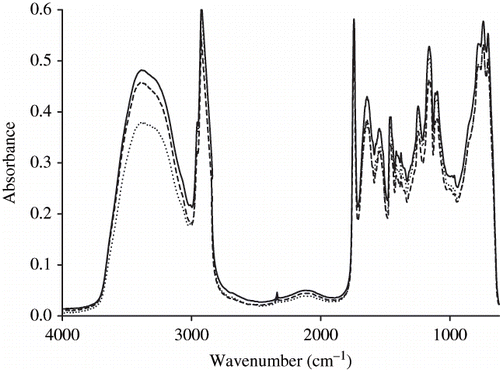
Most of the absorption bands in the MIR region, but not in the NIR region, have been identified and attributed to chemical groups. The infrared bands appearing in the 3000–2800 cm−1 region are related to the absorbance of methyl and methylene groups. The CH3 group represent in all cases two strong bands occurred at 2962 cm−1 and 2872 cm−1 corresponding to asymmetrical and symmetrical stretching modes, respectively. The CH2 group gives rise to two characteristic bands at 2926 and 2853 cm−1 corresponding to the in-phase and out-of-phase vibrations of the hydrogen atoms. The triacylglycerols ester linkage C-O (∼ 1175 cm−1), C = O (∼ 1750 cm−1) group and acyl chain C-H (3000–2800 cm−1) stretch wavenumbers are commonly used to determine fat. These bands also are particularly useful because they are sensitive to the conformation and the packing of the phospholipid acyl chains.[Citation35–37]
The development of Fourier transform infrared (FTIR) spectroscopy in recent years also affords the possibility of obtaining unique information about protein yield, protein structure and protein-protein and protein-lipid interactions without introducing perturbing probe molecules.[Citation36] The Amide I and II bands (1700–1500 cm−1) are also known to be sensitive to the conformation adopted by the protein backbone. The secondary structures of proteins can be deduced from their FTIR spectra since there are good correlations between the Amide I band (1700–1600 cm-1),[Citation38] and the levels of α-helix, β-sheet and unordered structure in proteins.[Citation39]
Although the peptide bonds are essentially responsible for the absorbance of proteins in the 1700–1500 cm−1 region, the side chains of several amino acids (glutamic acid, aspartic acid, glutamine, asparagine, lysine, arginine, and tyrosine) can contribute to the signal in the Amide II region.[Citation40,Citation41] The carboxylate groups of the side chains of aspartic and glutamic acids absorb between 1580 cm−1 and 1520 cm−1, the nature of anion or cation interacting with carboxylate group determining the exact location of the band within this interval. Thus, Byler and Farrell[Citation42] showed, by infrared spectroscopy, that the O-C-O stretching vibrations of glutamate and aspartate residues shifted from 1575 to 1565 cm−1 when potassium ions bound to the proteins are replaced by calcium ions.
Water exhibits a strong absorption band overlapping amide I and II protein bands. Due to the high absorbance at about 1640 cm−1 in the amide I and II region and to comply with the Beer-Lambert law, the path length of the cuvette has to be in the 10 μm range. The development of the attenuated total reflectance (ATR) device allows the sampling problems encountered when collecting spectra from opaque and viscous samples to be overcome ().
MULTIVARIATE STATISTICAL TECHNIQUES AND GENERAL APPROACH TO THE DEVELOPMENT OF ANALYTICAL APPLICATION
The chemical information contained in the spectra are hidden in the band position, the band intensities and also the band widths. Whereas the band positions give information about the appearance and the structure of certain chemical compounds in a mixture, the intensities of the bands are related to the yield of these compounds via the Beer Lambert law. The easiest way to determine the content of a chemical compound is to measure the change of the intensity of a well-resolved band that clearly belongs to this compound. This is possible for pure component. But food products retain numerous components giving complex spectra with overlapping bands. The most valuable way to evaluate the data sets is to use chemometric tools to extract quantitative, qualitative or structural information from the spectra. These methods encompass descriptive techniques such as PCA and predictive techniques such as FDA, PCR, and PLS Regression.
Descriptive Techniques
Principal component analysis
The most frequently used method with multivariate data is PCA. The PCA transforms the original variables into new axes, or principal components (PCs). These PCs are orthogonal, so that the data set presented on these axes are uncorrelated with each other. Therefore, the PCA expresses the total variation in the data set in only a few PCs and each successively derived PC expresses decreasing amounts of the variance. The first PC (PC1) covers as much of the variation in the data as possible. The second PC (PC2) is orthogonal to the first one and covers as much of the remaining variation as possible, and so on. By plotting the PCs, one can view interrelationships between different variables, and detect and interpret sample patterns, groupings, similarities or differences.[Citation43]
Predictive Techniques
Factorial discriminant analysis
The aim of this technique is to predict the membership of an individual to a qualitative group defined as a preliminary. The use of infrared and front face fluorescence spectroscopies for quality control in the food industry require the development of prediction models for samples that have to be assigned to qualitative groups such as variates, species or quality classes.[Citation44] Such predictions can be handled by discriminant techniques such as FDA, which involve building a model from a calibration set and choosing a rule to assign the calibration and validation samples to the qualitative groups.
In a first step, a step-wise discriminant analysis was performed to select the PCs the most relevant for discrimination of variables following the qualitative groups initially defined. From the selected variables, FDA assesses new synthetic variables which are linear combinations of the variables of origins called “discriminant factors” and which are not correlated and allow the best separation of the qualitative groups. The individual can be reallocated within the various groups. For each individual, the distance separating it from the various centres of gravity from each group is calculated. So, the individual is affected to the one the distance is the shortest. Discrimination of the groups consists of maximizing the variance between their centres of gravity; one can then clarify the properties that distinguish the different groups. If the individual is close to the centre of gravity of its group, it is “correctly classified.” In the case where the distance to the centre of gravity of its group is superior to that to the centre of gravity of another group, the individual is “poorly classified,” and it will be reassigned to this other group. The comparison of the assignment group to the real group is an indicator of the quality of the discrimination. Similarity maps and patterns can be drawn, in analogy to those for PCA. Recently, Karoui et al.[Citation45] have applied FDA to monitor the oxidation at the inner and surfaces zones of semi-hard cheeses made with cow's milk collected during both the grazing period (summer) and stabling period (autumn). It was shown that better classification was obtained with cheese samples cut at the surface (100% and 91.7% for the calibration and validation spectra, respectively) than with at the inner parts (68.1% and 41.7% for the calibration and validation samples, respectively). The authors concluded that riboflavin seemed to be primarily affected by oxygen and light than the physicochemical changes that takes place throughout ripening.
Principal component regression
PCR is a method for relating the variations in a response variable (Y-variable) to the variations of several predictors (X-variables), with explanatory or predictive purposes. This method performs particularly well when the various X-variables express common information, i.e., when there is a large amount of correlation, or even collinearity. PCR is a two-step method. First, a PCA is carried out on the X-variables. The PCs are then used as predictors in a multiple linear regression. This technique has been applied by Dufour et al.[Citation46] to predict some sensory attributes from tryptophan fluorescence spectra scanned on soft cheeses. The results obtained from this investigation showed that a good prediction was obtained for the following sensory parameters: surface state (r2 = 0.65), dry over watery ratio (r2 = 0.66), texture length (r2 = 0.69), and pastiness (r2 = 0.86). The authors highlighted the relationship between the organizations of the protein network as evaluated by fluorescence spectroscopy and textural attributes of cheeses.
Partial least squares regression
PLS models both the X- and Y-matrices simultaneously to find the latent variables in X that will best predict the latent variables in Y. These PLS-components are similar to PCs, and will also be referred to as PCs. The PLS models, scores and loadings express how the samples and variables are projected along the model components. Basically, PLS scores are interpreted in the same way as PCA scores: they are the sample coordinates along the model components. The only new feature in PLS is that two different sets of components can be considered, depending on whether one is interested in summarizing the variation in the X- or Y-space. The PLS loadings express how each of the X- and Y-variables is related to the model component summarized by the t-scores. It follows that the loadings will be interpreted somewhat differently in the X- and Y-space. In order to compare between the different established models for a given parameter, the values of the root mean square error of cross-validation (RMSECV) of the calibration set are considered. The performance of the models are quantified by determining the squared correlation coefficient (R2 ) for predicted versus measured compositions in cross-validation and the ratio of standard deviation of data set (SD) to RMSECV of data set. In fact, R2 indicates the percentage of the variance in the Y variable that is accounted by the X variable. A value for R2 between 0.50 and 0.65 indicates that more than 50% of the variance in Y is accounted for variable X, so that discrimination between high and low values can be made. A value for R2 between 0.66 and 0.81 indicates approximate quantitative predictions, whereas, a value for R2 between 0.82 and 0.90 reveals good prediction. Calibration models having a value for R2 above 0.91 are considered to be excellent.[Citation47] The ratio of the SD to the RMSECV, called the ratio of prediction to deviation (RPD), is the factor, by which the prediction accuracy has been increased compared to using the mean composition for all samples. This ratio is desired to be larger than 5, but at least 3, for a good calibration.[Citation47] An RPD ratio less than 3 indicates poor predictions, and the model can not be used for further prediction. Practical utility of the calibrations can also be assessed using the range error ratio (RER).[Citation47] This ratio is calculated by dividing the range of a given constituent by the prediction error for that constituent and, while susceptible to the presence of extreme values at both ends of the range, it is a useful indicator of the practical utility of a predictive model.
FOOD APPLICATIONS
Dairy Products
Milk and milk products composed of a complex mixture of lipids, proteins, carbohydrates, vitamins, and minerals.[Citation48] Infrared spectroscopy is widely used in different applications in dairy production, that is compositional, functional, and sensory analysis, process intermediates and final products. It is believed to be an accurate and rapid on-line tool for routine quality control in dairy production.
Infrared spectroscopy is widely used in milk analysis.[Citation49] A vast amount of work on the potential of the infrared spectroscopy to measure fat, protein, lactose, and total solids contents of milk has been published. It has been shown that the short-wave near-infrared region can be used for on-line measurements of milk composition and the results of analysis are comparable with those obtained with conventional methods.[Citation50] Using the spectral region 10000 to 4000 cm−1, milk constituents were predicted with high correlation coefficients against reference methods as total solids (0.928), fat (0.961), protein (0.985), casein (0.932), urea nitrogen (0.906), and lactose (0.931).[Citation51]
Considerable information has been collected on the measurement of vitamin content of dairy products using fluorescence spectroscopy. Water-soluble vitamin B2 or riboflavin and fat-soluble vitamin A are known as the essential nutritional compounds of cow's and human milk.[Citation48,Citation52] Riboflavin and vitamin A are highly fluorescent compounds, and this property serves as the basis for the fluorescent analytical methods. The former compound exhibits the maximum absorbance at 270, 370 nm and emission at 520, while the latter absorbs at 340 nm and emits at 490 nm.[Citation53] A front-face fluorescent analytical technique has been developed and proposed as a new rapid and nondestructive method for measuring riboflavin content, which demonstrated a promising ability to predict riboflavin in plain yogurt with high accuracy. Correlation between fluorescent spectra and riboflavin content measured using the AOAC fluorometric method was found to be as high as 0.99.[Citation54] A mathematical model derived from PCA and PCR applied to fluorescence spectra predicted the content of riboflavin.
Riboflavin is well known as a compound, which readily undergoes photochemical degradation while exposed to the visible light. Therefore, measurement of the rate of riboflavin destruction as a function of light intensity has an important role in terms of nutritional quality, designing packaging materials and controlling processing, handling and storing conditions of foods containing riboflavin. Fluorescence spectroscopy has also been proven to be a rapid, nondestructive analytical technique with high sensitivity and specificity in quantification of riboflavin in dairy foods. Becker et al.[Citation54] studied the content of riboflavin in plain yogurt depending on storage conditions and type of packaging material. Analyzing tryptophan and riboflavin fluorescence spectra, the authors concluded that the major changes of the yogurt fluorescent properties were caused by the photochemical degradation of riboflavin. It has also been shown that light transmission and oxygen permeability of packaging materials considerably affect the stability of yogurt riboflavin. The PLS regression yielded a correlation of 0.97 between the newly developed fluorescence method and riboflavin content determined by conventional technique.[Citation54]
While the role of riboflavin in light-induced degradation of milk and yogurt has already been elucidated to some extent, its significance in oxidation processes in cheeses and other dairy products—as a consequence of illumination—was not clear until a number of experimental works were conducted.[Citation55] Having studied fluorescence properties of cheeses and sour cream, Wold et al.[Citation28] reported a decrease of the fluorescence intensity of these products at 525 nm as the time of exposure to the visible light increases. Since riboflavin exhibits maximum emission at this wavelength, the alteration of the fluorescence properties observed was attributed to light- and air-induced riboflavin degradation.
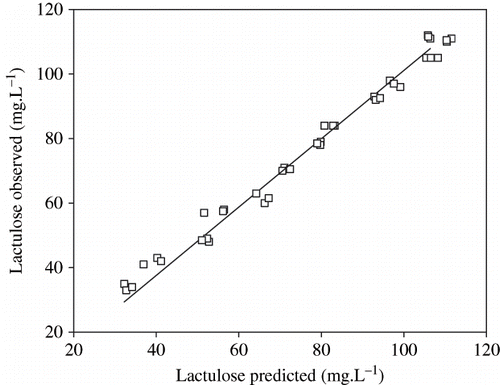
Heat treatment alters chemical composition and induces development of new compounds in milk. During heat treatment of milk, lactose, the major milk sugar (4-0-β-D-galactopyranocil-D-fructofuranose), is isomerized, forming a disaccharide known as lactulose (4-0-β-galactopyranosyl-D-fructose). Lactulose is used as an indicator to distinguish milk according to the rate of heat treatment received.[Citation56,Citation57] However, lactulose is also used as a medication in treatment of malfunctions related to the digestive apparatus and intestines. For instance, the acidification of colon contents as a result of digestion of lactulose by the bacteria of the large intestine attracts ammonia from the blood stream and traps it there to withdraw from the human body. This assists individuals in liver failure, as diseased livers are not able to detoxify ammonia. Excess ammonia in the blood stream leads to a form of dementia called “hepatic encephalopathy.” Thus, foods, particularly milk products, containing a given quantity of lactulose could be considered for the diet of the individuals experiencing intestine malfunctions. From this point of view, the development of accurate, rapid, and nondestructive measurement of lactulose contents becomes an important task. Several studies have been conducted to develop such analytical techniques.[Citation58,Citation59] However, proposed techniques still involve some premeasurement sample treatment manipulations and chemicals, which make the cost of the measurement per sample still relatively high. A front-face fluorescence spectroscopy based technique, which involves neither sample treatment nor other chemicals, has been developed to measure lactulose in milk formed during heat treatment ().[Citation60] The statistical processing of the tryptophan and Maillard-reaction products fluorescence spectra with PCA and PCR allowed predicting the lactulose content in milk with high accuracy (the regression coefficient was 0.987 when compared with a reference enzymatic technique).
Figure 7 Prediction of lactulose content in UHT milk samples from fluorescence spectra and comparison with observed values determined by the enzymatic method.
The relationship between dietary fats and health and disease is one of the most active areas of biochemical, nutritional, and medical research. In this sense, particularly, an increasing interest has been observed in the conjugated linoleic acid (CLA), especially in the cis-9, trans-11, and cis-12, trans-10 isomers, considered essential to human diet. CLA is associated with important biological functions including anticarcinogenic activity, antiatherogenic activity, the ability of immune stimulation, the antidiabetic and antiobesity activities.[Citation3,Citation4,Citation61] Cow's milk has been found to be the richest source of CLA containing 0.2 to 3.7% relative to the total milk fat. Three groups of factors, diet related, animal related, and post-harvest related, have the most influence on CLA content in milk and meat from ruminant.[Citation61] Direct fortification of milk with CLA oil is also reported to be more feasible solution to control CLA content in order to provide maximum health benefits.[Citation4] Therefore, availability of accurate and rapid analytical methods to measure fatty acid constituents of milk can considerably contribute into further research towards balanced fatty acid content management and designing foods with desirable fatty acid composition. The most often practiced analytical method in the characterization of the milk fatty acids is the gas chromatography.[Citation2–4] According to this method, prior to injection into chromatograph, milk fat is extracted from sample, heated in the presence of acid, and treated with chemicals; thus, this measurement technique becomes time-consuming and labor-intensive. Meurens et al.[Citation62] with colleagues have conducted measurements of CLA in cow milk using FTIR. This is the first successful application of infrared spectroscopy to quantification of CLA. They have established that the spectral patterns at 1652, 1438, and 3006 cm−1 are associated to the cis, trans conjugated C = C in the rumenic and trans-10, cis-12-octodecadienoic acids. Calibration for CLA determination has indicated that these three specific spectral patterns can be used for rapid and accurate measurement of CLA concentration in milk fat.[Citation62]
As the research of such biologically active nutrients as CLA attracts consistently growing interest, an acute need is existing for a relatively low-cost and rapid measurement tools. To meet this need, further attention should be given to the analytical methods development research and one of the subjects of such research could be investigation of the potential of fluorescence spectroscopy to measure fatty acids in foods, especially those recognized as most beneficial to human health. Fat-soluble fluorophores naturally occurring in foods such as vitamin A (exc. 340 nm, em. 409 nm) and vitamin E (exc. 295 nm, em. 340 nm) are widely used as the probes assisting to extract information on ingredient interaction and physicochemical properties of different foods. Intrinsic fat-soluble fluorophores naturally occurring in foods have been successfully used as sensors to characterize ingredient interaction and physicochemical properties of foods. The excitation spectra of vitamin A in the range 250 to 350 nm (em. 410 nm) has been shown to contain information related to the physical state of triglycerides in fat globules.[Citation63] Fatty acid composition and quantities of individual fatty acids might also modify the spectral properties of these probes and therefore fat-soluble fluorescent probes could allow measuring nutritionally active fatty acids. Many other extrinsic chromophores available in the market, could also be used to study fatty acids in foods. This type of probe is attached to the molecule of interest and unique information on the molecule under question can be obtained analyzing the modifications of its spectral properties.
Solid fat content was examined evaluating the spectra of cream obtained by infrared spectroscopy.[Citation64] The relationship with the physical state of triacylglycerols and modification of the absorbance at 2865 cm−1 was established. Results obtained by infrared spectroscopy were compared with those found with differential scanning calorimetry (DSC) and nuclear magnetic resonance spectroscopy (NMR). All the three methods applied displayed nearly identical results and the correlation coefficient was 0.996.
Edible Muscle Tissues
Meat is important because of its excellent nutritive properties. The protein content of muscle tissue is very high and contains types and amounts of amino acids proper to normal maintenance of human health and growth. Lipid components of muscle tissue vary more than do the amino acids. The composition of lipids is dependent on species, age and location. Muscle tissue is also an excellent source of both water-soluble (thiamin, riboflavin, niacin, B6, and B12) and fat-soluble (D, E, and K) vitamins.[Citation48] The meat processing industry has long needed non-destructive and accurate techniques to determine the nutritional and quality attributes of meat. Increasing numbers of studies indicate that using infrared spectroscopy to measure the nutrients in muscle tissue offers advantages over other conventional analytical methods. Infrared spectroscopy is an ideally suited technique for muscle tissue fat analysis. Replacing time-consuming and labor-intensive traditional analytical methods with simple and rapid Fourier transform infrared spectroscopy (FTIR) has been defined as one of the priorities in the development of analytical systems.[Citation65]
A rapid FTIR method based on transmission approach to measure the free fatty acids in the range of 0.2–8% in fats and oils has been proposed by Ismail et al.[Citation65] according to which carboxyl groups are measured analyzing spectra. The authors also developed a FTIR method coupled with an ATR accessory to measure free fatty acid concentrations higher than 0.2%. Both techniques allow users to obtain an analytical result comparable to the American Oil Chemists' Society (AOCS) reference method in a simple manner in less than 2 minutes.[Citation65]
Processing aims at improving of nutritional and functional properties of foods and its ingredients. In some circumstances, processing may also induce uncontrolled reactions resulting in detrimental consequences to the overall quality of a food product and particularly to its nutritive value. The majority of cis-form unsaturated fatty acids transform to trans fatty acids during fat/oil hydrogenation. Since trans fatty acids are associated with cardiovascular diseases, their content in foods has to be controlled by means of reliable measurement methods. van der Voort et al.[Citation49] have proposed a rapid FTIR-chemometrics based technique to measure cis and trans content of fats. Compared to the AOCS method, the infrared spectroscopic method showed high accuracy and a relatively wide measurable concentration range (0–15% of trans) of the new FTIR-chemometrics technique. In addition, a custom designed sample-handling accessory and program were developed to enable the analytical procedure to be automated, robust, and rapid (< 2 min/sample). A similar technique has been proposed to determine solid fat index in fat and oils.[Citation49]
Analytical techniques based on the fluorescent spectroscopy have mainly been examining technological properties and quality attributes of meat and meat products, rather than nutritive compounds. A number of works have been dedicated to study meat connective tissue and fat,[Citation19–21 Citation26] meat tenderness,[Citation66,Citation67] and texture,[Citation68,Citation69] meat and fish freshness.[Citation31] Probably such tendencies come from the apparent need of the meat processing industry for reliable on-line quality control techniques. It is believed that the lack of such measurement tools is holding back the introduction of totally automated processing cycles into meat processing plants. A number of accessories and new application approaches have been developed in the last two decades enabling infrared and fluorescent spectroscopies to be the most suitable online measurement techniques. However, research towards better understanding the biochemical and biophysical nature of the interactions between fluorescent molecules, and the food matrix might result in the new nondestructive and rapid fluorescent techniques to determine a wider range of nutrients in foods.
Cereal Foods
Each cereal (wheat, maize, barley, rice, rye, oat, millet, sorghum, and triticale) has unique properties, which make it suitable for a variety of food products. Cereals and cereal products are an important source of energy, carbohydrate, protein, and fiber. They also contain a range of micronutrients such as vitamin E, some of the B vitamins, sodium, magnesium, and zinc. Because of fortification of some cereal products they also contribute significant amounts of calcium and iron. There is evidence to suggest that regular consumption of cereals, specifically whole grains, may have a role in the prevention of chronic diseases (e.g., coronary heart disease and diabetes).
A series of works have recently been conducted on the application of NIR spectroscopy to determine nutritional compounds in cereal foods. These works have resulted in a number of rapid online measurement tools with a great potential to be introduced in the cereal processing industry.
Total dietary fiber content in mixed meals has been measured using NIR spectroscopy.[Citation70] Using multivariate tools, PLS models were developed to relate NIR spectra to the corresponding values of the total dietary fiber determined by an AOAC method. The coefficient of determination was 0.89 to 0.97 depending on the samples studied. Compared with traditional analysis of total dietary fiber in mixed meals, which takes a minimum of 4 days, NIR spectroscopy provided a faster method for monitoring samples for dietary fiber. Similar work has been conducted to determine total dietary fiber in barley using NIR transmittance spectroscopy.[Citation71] Whole-grain milled barley (n = 56) was scanned between 850–1048 nm and total dietary fiber was determined for each cultivar by AOAC enzymatic-gravimetric method. The validation statistics of PLS models using calibration (n = 28) and validation (n = 28) sets showed a standard error of performance of 0.89–1.03 and a coefficient of determination of 0.83–0.88. These two works demonstrate the high capacity of NIR spectroscopy to determine dietary fiber in cereal foods in a rapid, nondestructive, and accurate manner.
The classification of cereals according to their nutritional components has been accomplished using Raman spectroscopy and modeling software to separate the cereals into classes.[Citation72] In total, 120 cereal-based food samples have been scanned in low-iron NMR tubes with a 1064 nm excitation laser. Raman scatter was collected over the Raman shift range of 3399.89–202.45 cm−1. Samples were classified depending on their primary nutritional compounds (total dietary fiber, fat, protein, and sugar) by PCA. Simultaneously, soft independent modeling of class analogy (SIMCA) and PLS based classification were conducted to classify the samples according to the content of each component (high and low) using the spectral data. The wavelength bands responsible for classification of each component were 1630–1600 cm−1 for total dietary fiber, 2853 and 1440 cm−1 for fat, 2910 and 1660 cm−1 for protein, and 848 and 848 cm−1 for sugar. PLS-based classification was shown as more precise comparing to SIMCA, resulting in correct classification of 85–95% of the time. Thus, NIR-FT/Raman spectroscopy has been proved as a rapid and reliable method for classification of cereal foods based on their nutritional components.
Determination of fat in cereal foods using NIR spectroscopy has been a subject of several projects undertaken recently. Reflectance spectra at 400–1700 nm of intact cereal foods have been recorded and processed with multivariate analysis tools. Mathematical models derived allowed predicting the fat content of independent validation samples (n = 52) with sufficient accuracy. Comparing to an official method, the fat content was predicted using infrared spectra with standard error of performance and multiple coefficient of determination being 1.61–1.65% and 0.95–0.96, respectively. The model was expanded to include samples with a broad range of particle sizes and moisture contents with no reduction in accuracy of prediction. Wavelength regions of 1215 and 1390 nm have been reported to be the most valuable for model development.[Citation73] The wavelength region at 1104–2494 has also been proved for measurement of fat content in cereal foods.[Citation74] The PLS regression applied to the spectral data and the total fat determined by AOAC Method yielded prediction of fat content in the samples studied with the coefficient of determination of 0.99. The mathematical model obtained was tested with independent validation samples (n = 36), which demonstrated the prediction of fat with high accuracy. These studies clearly showed that infrared spectroscopy could be considered as a reliable and effective alternate to the time-consuming and labor-intensive official analytical methods currently applied in total fat determination in diverse cereal products and nutrition labeling.
Energy balance is an important parameter of human diet along with its nutritional composition. Therefore the energy available in a food should be known to consumers for management of diet. Control over diet energy balance allows decreasing the risk of obesity and chronic diseases related to food. NIR spectroscopy has also been applied to measure energy contained in foods, particularly in cereal products. Combination of the infrared spectroscopy and multivariate analysis used to evaluate gross and available energy of the ground cereal products has demonstrated a good correlation with the results obtained by bomb calorimetry.[Citation75] The developed chemometric models predicted gross and available energy of the cereal product samples with multiple coefficients of determination of 0.96. Standard errors of cross validation for NIR prediction of gross energy (range 4.05–5.49 kcal/g), energy of samples after adjustment for unutilized protein (range 3.99–5.38 kcal/g) and energy of samples after adjustment for unutilized protein and insoluble dietary fiber (range 2.42–5.35 kcal/g) were 0.053, 0.053, and 0.088 kcal/g, respectively. The same approach has been utilized to explore the energy of fat derived from different cereal products.[Citation76] Using NIR reflectance spectra (1104–2494 nm) and reference values for energy obtained from Soxhlet analysis of fat using a conversion factor of 9 kcal/g of fat to calculate fat energy, a modified PLS model was developed for the prediction of calories derived from fat per g of sample. Standard errors of cross validation and multiple coefficient of determination for prediction of energy from fat per g sample (n = 51) were 0.103 kcal and 0.97 respectively.
The presence of the intrinsic fluorescent molecules that can be regarded as of high nutritional concern in the cereals makes it possible to quantify them by fluorescence spectroscopy. The advantage of this technique becomes obvious when low quantities of a target substance, which are beyond the sensibility of the infrared spectroscopy, are to be measured. Since most of cereal products are opaque, front-face fluorescent spectroscopy is utilized. Using this technique, the content of vitamin B2 in low-riboflavin-containing wheat flours have been measured.[Citation77] Analyzing fluorescence spectra of four bread and durum wheats in the region 250–650 nm, two bands of absorption have been found: first, relatively high-intensity band related to aromatic amino acids of proteins and second, low-intensity band, due to chromophores bound to low-molecular-weight compounds.[Citation78] The intensity of the latter was found to be dependant on the content of the chromophores in flour and thus, the low-intensity band can be used for quantification of the chromophores. Particularly, carotenoids with absorption bands at 450–500 nm present in wheat flour can be measured.
CONCLUSION
As the public concern upon the nutritional value of the food supply is consistently increasing, ways are needed to improve the nutritional quality of diets. There also major gaps in our knowledge of the health related functions of many biologically active food components. The elucidation of the health promotion-role of many biologically active components requires rapid and precise analytical techniques to generate data. Although a number of analytical techniques have been developed to isolate and measure those components, robust, rapid and nondestructive analytical methodologies have been developed for only a few families of these biologically active components.
Infrared and fluorescence spectroscopies have proved their potential as rapid and nondestructive analytical tools to quantify major food components, physicochemical, and biochemical changes in foods during processing and handling, as well as to predict sensory and quality attributes. The advantages of the infrared and fluorescent spectroscopies become more apparent when they are combined with chemometric tools to extract information of interest from the recorded spectra. Fiber optic probes designed for spectroscopic applications give them a degree of portability, which enhances the use of spectroscopic techniques in atline and online process settings.
While the use of the infrared spectroscopy has widely spread across different food analysis applications, much attention is required to develop new analytical techniques based on the fluorescence spectroscopy. Having a strong sensitivity to compounds contained even in trace amounts, which is beyond that of the other techniques, fluorescence spectroscopy could be a powerful tool to study nutritional components in foods. A number of important biologically active components in foods such as lycopene, tocopherols, and CLA could be studied using fluorescence spectroscopy. A wider use of this technique in such studies would require new knowledge of the fluorescent characteristics of the nutritional components, which have not yet been studied.
ACKNOWLEDGMENTS
We thank the Commission of the European Community, Research Directorate-General, and the research council of K.U. Leuven for supporting A. Kulmyrzaev (Project MIF1-CT-2005-021890) and R. Karoui, respectively.
Related Research Data
REFERENCES
- Nielsen , S.S. 2003 . Food Analysis Laboratory Manual , 156 New York : Kluwer Academic .
- Kelly , M.L. , Kolver , E.S. , Bauman , D.E. , Van Amburgh , M.E. and Muller , L.D. 1998 . Effect of Intake of Pasture on Concentrations of Conjugated Linoleic Acid in Milk of Lactating Cows . Journal of Dairy Science , 81 : 1630 – 1636 .
- Lawless , F.J. , Murphy , J. , Harrington , D. , Devery , R. and Stanton , C. 1998 . Elevation of Conjugated Cis-9, trans-11-octadecadidienoic Acid in Bovine Milk because of Dietary Supplementation . Journal of Dairy Science , 81 : 3259 – 3267 .
- Campbell , W. , Drake , M.A. and Larick , D.K. 2003 . The Impact of Fortification with Conjugated Linoleic Acid (CLA) on the Quality of Fluid Milk . Journal of Dairy Science , 86 : 43 – 51 .
- Levieux , D. 1980 . Heat Denaturation of Whey Proteins Comparative Studies with Physical and Immunological Methods . Annales de Recherche Vétérinaire , 11 : 89 – 97 .
- Copeland , R.A. 1994 . Methods for Protein Analysis: A Practical Guide for Laboratory Protocols , 228 New York : Chapman and Hall .
- Levieux , D. , Levieux , A. and Venien , A. 1995 . Immunochemical Quantification of Heat Denaturation of Bovine Meat Soluble Proteins . Journal of Food Science , 60 : 678 – 684 .
- Ladokhin , A.S. 2000 . “ Fluorescence Spectroscopy in Peptide and Protein Analysis ” . In Encyclopedia of Analytical Chemistry , Edited by: Meyers , R.A. 5762 – 5779 . New York : John Wiley and Sons .
- Lakowicz , J.R. 1983 . “ Fluorophores ” . In Principles of Fluorescence Spectroscopy , Edited by: Meyers , R.A. 63 – 93 . New York : Plenum Press .
- Bertrand , D. and Scotter , C.N.G. 1992 . Application of Multivariate Analyses to NIR Spectra of Gelatinized Starch . Applied Spectroscopy , 46 : 1420 – 1425 .
- Bro , R. , van den Berg , F. , Thybo , A. , Andersen , C.M. , Jorgensen , B.M. and Andersen , H. 2002 . Multivariate Data Analysis as a Tool in Advanced Quality Monitoring in the Food Production Chain . Trends in Food Science and Technology , 13 : 235 – 244 .
- Parker , C.A. 1968 . “ Apparatus and Experimental Methods ” . In Photoluminescence of Solutions with Applications to Photochemistry and Analytical Chemistry , Edited by: Parker , C.A. 128 – 302 . Amsterdam : Elsevier .
- Blumberg , W.E. , Doleiden , F.H. and Lamola , A.A. 1980 . Hemoglobin Determined in 15 Mu-L of Whole-Blood by Front-Face Fluorometry . Clinical Chemistry , 26 : 409 – 413 .
- Hirsch , R.E. and Nagel , R.L. 1989 . Stopped-Flow Front-Face Fluorometer—A Prototype Design to Measure Hemoglobin R-T Transition Kinetics . Analytical Biochemistry , 176 : 19 – 21 .
- Genot , C. , Tonetti , F. , Montenaygarestier , T. , Marion , D. and Drapron , R. 1992 . Front Face Fluorescence Applied to Structural Studies of Proteins and Lipid-Protein Interactions of Viscoelastic Food-Products .2. Application to Wheat Gluten . Sciences des Aliments , 12 : 687 – 704 .
- Dufour , E. , Genot , C. and Haertlé , T. 1994 . β-lactoglobulin Binding Properties during Its Folding Changes Studied by Fluorescence Spectroscopy . Biochimica et Biophysica Acta , 1205 : 105 – 112 .
- Herbert , S. , Mouhous Riou , N. , Devaux , M.F. , Riaublanc , A. , Bouchet , B. , Gallant , J.D. and Dufour , E. 2000 . Monitoring the Identity and the Structure of Soft Cheeses by Fluorescence Spectroscopy . Le Lait , 80 : 621 – 634 .
- Dufour , E. and Riaublanc , A. 1997 . Potentiality of Spectroscopic Methods for the Characterisation of Dairy Products, I – Front Face Fluorescence Study of Raw, Heated and Homogenised Milks . Le Lait , 77 : 657 – 670 .
- Skjervold , P.O. , Taylor , R.G. , Wold , J.P. , Berge , P. , Abouelkaram , S. , Culioli , J. and Dufour , E. 2003 . Development of Intrinsic Fluorescent Multispectral Imagery Specific for Fat, Connective Tissue, and Myofibers in Meat . Journal of Food Science , 68 : 1161 – 1168 .
- Wold , J.P. , Lundby , F. and Egelandsdal , B. 1999 . Quantification of Connective Tissue (Hydroxyproline) in Ground Beef by Autofluorescence Spectroscopy . Journal of Food Science , 64 : 377 – 385 .
- Egelandsdal , B. , Wold , J.P. , Sponnich , A. , Neegard , S. and Hildrum , K.I. 2002 . On Attempts to Measure the Tenderness of Longissimus Dorsi Muscles Using Fluorescence Emission Spectra . Meat Science , 60 : 187 – 202 .
- Swatland , H.J. 1987 . Measurement of the Gristle Content in Beef by Macroscopic Ultraviolet Fluorometry . Journal of Animal Science , 65 : 158 – 164 .
- Swatland , H.J. 1991 . Evaluation of Probe Designs to Measure Connective-Tissue Fluorescence in Carcasses . Journal of Animal Science , 69 : 1983 – 1988 .
- Swatland , H.J. 1993 . An Anomaly in the Effect of Temperature on Collagen Fluorescence in Beef . Food Research International , 26 : 271 – 276 .
- Swatland , H.J. 1996 . Connective Tissue Distribution Patterns in Beef Detected by Ultraviolet Fibre Optics . Food Science Technology-Lebensmittel-Wissenschaft & Technologie , 29 : 272 – 277 .
- Swatland , H.J. , Madsen , N.T. and Nielsen , T. 1996 . Fluorometry of Connective Tissue in Beef, Relative to Direction of Measurement . Food Science Technology-Lebensmittel-Wissenschaft & Technologie , 29 : 536 – 541 .
- Swatland , H.J. and Findlay , C.J. 1997 . On-line Probe Prediction of Beef Toughness, Correlating Sensory Evaluation with Fluorescence Detection of Connective Tissue and Dynamic Analysis of Overall Toughness . Food Quality and Preference , 8 : 233 – 239 .
- Wold , J.P. , Jorgensen , K. and Lundby , F. 2002 . Nondestructive Measurement of Light-induced Oxidation in Dairy Products by Fluorescence Spectroscopy and Imaging . Journal of Dairy Science , 85 : 1693 – 1704 .
- Fox , J.B. and Thayer , D.W. 1998 . Radical Oxidation of Riboflavin . International Journal for Vitamin and Nutrition Research , 68 : 174 – 180 .
- Karoui , R. , Dufour , E. , Schoonheydt , R. and De Baerdemaeker , J. 2007 . Characterisation of Soft Cheese by Front Face Spectroscopy Coupled with Chemometric Tools: Effect of the Manufacturing Process and Sampling Zone . Food Chemistry , 100 : 632 – 642 .
- Dufour , E. , Frencia , J.P. and Kane , E. 2003 . Development of a Rapid Method Based on Front-face Fluorescence Spectroscopy for the Monitoring of Fish Freshness . Food Research International , 36 : 415 – 423 .
- Givens , D.I. , De Boever , J.L. and Deaville , E.R. 1997 . The Principles, Practices and Some Future Applications of Near Infrared Reflectance Spectroscopy for Predicting the Nutritive Value of Foods for Animals and Humans . Nutrition Research Review , 10 : 83 – 114 .
- Givens , D.I. and Deaville , E.R. 1999 . The Current and Future Role of Near Infrared Reflectance Spectroscopy in Animal Nutrition . Journal of Agriculture Research , 50 : 1131 – 1145 .
- Rodriguez-Otero , J.L. , Hermida , M. and Centeno , J. 1997 . Analysis of Dairy Product by Near Infrared Spectroscopy . Journal of Agriculture and Food Chemistry , 45 : 2815 – 2819 .
- Unemera , J.D.G. , Cameron , D.G. and Mantsch , H.H.A. 1980 . Fourier Transform Infrared Spectroscopic Study of the Molecular Interaction of Cholesterol with 1, 2 Dipalmitoyl-sn-glycero-3-phosphocoline . Biochimica and Biophysica Acta , 602 : 32 – 44 .
- Casal , H.L. and Mantsch , H.H. 1984 . Polymorphic Phase Behavior of Phopholipid Membranes Studied by Infrared Spectroscopy . Biochimica and Biophysica Acta , 779 : 382 – 401 .
- Mendelsohn , R. and Mantsch , H.H. 1986 . “ Fourier Transform Infrared Studies of Lipid-protein Interactions ” . In Progress in Protein-Lipid Interactions , Edited by: Watts , A. and Pont , J.J.H.H.M.D. 103 – 145 . Amsterdam : Elsevier Sciences Publishers .
- Fox , P.F. 1989 . “ The Milk Protein System ” . In Developments in Dairy Chemistry , Edited by: Fox , P.F. 1 – 54 . New York : Elsevier Applied Science .
- Dousseau , F. and Pézolet , M. 1990 . Determination of the Secondary Structure Contents of Proteins in Aqueous Solutions from Their Amide I and Amide II Infrared Bands. Comparison Between Classical and Partial Least Squares Methods . Biochemistry , 29 : 8771 – 8779 .
- Bellamy , L.J. 1975 . The Infrared Spectra of Complex Molecules , 433 London : Chapman and Hall .
- Goormaghtigh , E. , Cabiaux , V. and Ruysschaert , J.M. 1994 . “ Determination of Soluble and Membrane Protein Structure by Fourier Transform Infrared Spectroscopy. I- Assignments and Model Compounds ” . In Subcellular Biochemistry , Edited by: Hilderson , H.J. and Ralston , G.B. 329 – 362 . New York : Plenum Press .
- Byler , D.M. and Farell , H.M. 1989 . Infrared Spectroscopic Evidence for Calcium Ion Interaction with Carboxylate Groups of Casein . Journal of Dairy Science , 72 : 1719 – 1723 .
- Karoui , R. , Martin , B. and Dufour , E. 2005 . Potentiality of Front Face Fluorescence Spectroscopy to Determine the Geographic Origin of Milks from Haute-Loire Department (France). . Le Lait , 85 : 223 – 236 .
- Robert , P. , Devaux , M.F. and Bertrand , D. 1996 . Beyond Prediction: Extracting Relevant Information from Near Infrared Spectra . Journal of Near Infrared Spectroscopy , 4 : 75 – 84 .
- Karoui , R. , Dufour , E. and De Baerdemaeker , J. 2007 . Front Face Fluorescence Spectroscopy Coupled with Chemometric Tools for Monitoring the Oxidation of Semi-hard Cheeses throughout Ripening . Food Chemistry , 61 : 1305 – 1316 .
- Dufour , E. , Devaux , M. F. , Fortier , P. and Herbert , S. 2001 . Delineation of the Structure of Soft Cheeses at the Molecular Level by Fluorescence Spectroscopy-relationship with Texture . International Dairy Journal , 11 : 465 – 473 .
- Williams , P.C. and Norris , K. 2001 . “ Near Infrared Technology in the Agricultural and Food Industries ” . 296 Saint Paul : American Association of Cereal Chemists .
- Fennema , O.R. 1996 . Food Chemistry , 1069 New York : Marcel Dekker .
- van der Voort , F.R. , Memon , K.P. , Sedman , J. and Ismail , A.A. 1996 . Determination of Solid Fat Index by Fourier Transform Infrared Spectroscopy . Journal of the American Oil Chemists Society , 73 : 411 – 416 .
- Tsenkova , R. , Atanassova , S. , Toyoda , K. , Ozaki , Y. , Itoh , K. and Fearn , T. 1999 . Near-infrared Spectroscopy for Dairy Management: Measurement of Unhomogenized Milk Composition . Journal of Dairy Science , 82 : 2344 – 2351 .
- Jankovska , R. and Sustova , K. 2003 . Analysis of Cow Milk by Near-infrared Spectroscopy . Czech Journal of Food Science , 21 : 123 – 128 .
- Roughead , Z.K. and McCormic , D.B. 1991 . Qualitative and Quantitative Assessment of Flavins in Cow's Milk . Journal of Nutrition , 120 : 382 – 388 .
- Dean , J.A. 1992 . Lange's Handbook of Chemistry , 1466 New York : McGraw Hill Book Co .
- Becker , E.M. , Christensen , J. , Frederiksen , C.S and Haugaard , V.K. 2003 . Front-face Fluorescence Spectroscopy and Chemometrics in Analysis of Yogurt: Rapid Analysis of Riboflavin . Journal of Dairy Science , 86 : 2508 – 2515 .
- Mortensen , G. , Bertelsen , G. , Mortensen , B.K. and Stapelfeldt , H. 2004 . Light-induced Changes in Packaged Cheeses—A Review . International Dairy Journal , 14 : 85 – 102 .
- Corzo , N. , Delgado , T. , Troyano , E. and Olano , A. 1994 . Ratio of Lactulose to Furosine as Indicator of Quality of Commercial Milks . Journal of Food Protection , 57 : 737 – 739 .
- Pellegrino , L. , Noni , I. and Resmini , P. 1995 . Coupling of Lactulose and Furosine Indices for Quality Evaluation of Sterilized Milk . International Dairy Journal , 5 : 647 – 659 .
- Birlouez-Aragon , I. , Nicolas , M. , Metais , A. , Marchond , N. , Grenier , J. and Calvo , D. 1998 . A Rapid Fluorimetric Method to Estimate the Heat Treatment of Liquid Milk . International Dairy Journal , 8 : 771 – 777 .
- Luzzana , M. , Agnellini , D. , Cremonesi , P. , Caramenti , G. and Devisa , S. 2003 . Milk Lactose and Lactulose Determination by the Differential pH Technique . Le Lait , 83 : 409 – 416 .
- Kulmyrzaev , A. and Dufour , E. 2002 . Determination of Lactulose and Furosine in Milk Using Front-face Fluorescence Spectroscopy . Lait , 82 : 725 – 735 .
- Khanal , R.C. and Olson , K.C. 2004 . Factors Affecting Conjugated Linoleic Acid (CLA) Content in Milk, Meat, and Egg: A Review . Pakistan Journal of Nutrition , 3 : 82 – 98 .
- Meurens , M. , Baeten , V. , Yan , S.H. , Mignolet , E. and Larondelle , Y. 2005 . Determination of the Conjugated Linoleic Acid in Cow's Milk Fat by Fourier Transform Raman Spectroscopy . Journal of Agriculture and Food Chemistry , 53 : 5831 – 5835 .
- Dufour , E. , Mazerolles , G. , Devaux , M.F. , Duboz , G. , Duployer , M.H. and Mouhous Riou , N. 2000 . Phase Transition of Triglycerides during Semi-hard Cheese Ripening . International Dairy Journal , 10 : 81 – 93 .
- Dufour , E. and Riaublanc , A. 1997 . Potentiality of Spectroscopic Methods for the Characterisation of Dairy Products. II. Mid Infrared Study of the Melting Temperature of Cream Triacylglycerols and of the Solid Fat Content in Cream . Le Lait , 77 : 671 – 681 .
- Ismail , A.A. , Van der Voort , F.R. , Emo , G. and Sedman , J. 1993 . Rapid Quantitative-Determination of Free Fatty Acids in Fats and Oils by Fourier-Transform Infrared-Spectroscopy . Journal of the American Oil Chemists Society , 70 : 335 – 341 .
- Dufour , E. and Frencia , J.P. 2001 . Les Spectres de Fluorescence Frontale-une Empreinte Digitale de la Viande . Viandes & Produits Carnés , 22 : 9 – 14 .
- Frencia , J.P. , Thomas , E. and Dufour , E.. 2003 . Measure of Meat Tenderness Using Front-face Fluorescence Spectroscopy . Science des Aliments , 23 : 142 – 145 .
- Lebecque , A. , Laguet , A. , Chanonat , M. , Lardon , S. and Dufour , E. 2003 . Joint Analysis of Sensory and Instrumental Data Applied to the Investigation of the Texture of Charolais Meat . Science des Aliments , 23 : 172 – 175 .
- Allais , I. , Viaud , C. , Pierre , A. and Dufour , E. 2004 . A Rapid Method Based on Front-face Fluorescent Spectroscopy for the Monitoring of the Texture of Meat Emulsions and Frankfurters . Meat Science , 67 : 219 – 229 .
- Kim , Y. , Singh , M. and Kays , S.E. 2006 . Near-infrared Spectroscopy for Measurement of Total Dietary Fiber in Homogenized Meals . Journal of Agriculture and Food Chemistry , 54 : 292 – 298 .
- Shimizu , N. , Kays , S.E. , Barton , F. , Fujita , M. , Ishikawa , N. , Oda , S. , Kimura , T. and Ohtsubo , K. 2002 . Measurement of Total Dietary Fiber in Milled Barley Using Near-infrared Transmittance Spectroscopy . Nippon Shokuhin Kagaku Kogaki Kaishi , 49 : 620 – 623 .
- Sohn , M. , Himmelsbach , D.S. , Kays , S.E. , Archibald , D.D. and Barton , F.E. 2005 . NIR-FT/Raman Spectroscopy for Nutritional Classification of Cereal Foods . Cereal Chemistry , 82 : 660 – 665 .
- Kays , S.E. , Archibald , D.D. and Sohn , M. 2005 . Prediction of Fat Content in Intact Cereal Food Products Using NIR Reflectance Spectroscopy . Journal of the Science of Food and Agriculture , 85 : 1596 – 1602 .
- Vines , L.L. , Kays , S.E. and Koehler , P.E. 2005 . A Near-infrared Reflectance Model for the Rapid Prediction of Total Fat in Cereal Foods . Journal of Agriculture and Food Chemistry , 53 : 1550 – 1555 .
- Kays , S.E. and Barton Ii , F.E. 2002 . Rapid Prediction of Gross Energy and Utilizable Energy in Cereal Food Products Using Near-infrared Reflectance Spectroscopy . Journal of Agriculture and Food Chemistry , 50 : 1284 – 1289 .
- Kays , S.E. and Barton Ii , F.E. 2004 . Energy from Fat Determined by Near-infrared Reflectance Spectroscopy . Journal of Agriculture and Food Chemistry , 52 : 1669 – 1674 .
- Zandomeneghi , M. , Carbonaro , L. , Calucci , L. , Pinzino , C. , Galleschi , L. and Ghiringhelli , S. 2003 . Direct Fluorimetric Determination of Fluorescent Substances in Powders: The Case of Riboflavin in Cereal Flours . Journal of Agriculture and Food Chemistry , 51 : 2888 – 2895 .
- Zandomeneghi , M. , Festa , C. , Carbonaro , L. , Galleschi , L. , Lenzi , A. and Calucci , L. 2000 . Front-surface Absorbance Spectra of Wheat Flour: Determination of Carotenoids . Journal of Agriculture and Food Chemistry , 48 : 2216 – 2221 .