Abstract
Thermal properties of sweet potato were experimentally determined and modeled as a function of temperature and moisture content. The purpose is to develop empirical correlations that could predict thermal properties during sweet potato processing. Thermal conductivity from the study was 0.49 ± 0.038 Wm−1K−1 (mean ± s.d.), thermal diffusivity was 1.2 × 10⁻⁷ ± 9.05 × 10⁻⁹ m2s−1, specific heat was 3660 ± 477.4 Jkg−1K−1, and density was 1212 ± 73.5 kgm−3. All properties were determined within temperature range of 20 to 60°C and moisture content range of 0.45 to 0.75 w.b. Prediction models for the thermal properties of sweet potato were developed as a function of product temperature and moisture content with experimental data from this study. Mechanistic models were also developed for thermophysical properties of sweet potato using major food components of the product. Developed models were all presented and compared.
INTRODUCTION
Sweet potato (Ipomoea batatas) is an important vegetable. It is not particularly related to the regular potato that is sometimes called the Irish potato to distinguish it. The two crops are from different families. Sweet potato is very nutritious. In rating 58 vegetables by adding up the percentages of recommended daily allowance (RDA) for 6 nutrients (Vitamin A and C, folate, iron, copper and calcium) plus fiber, the Nutrition Action Health Letter rated sweet potato the highest with a whopping 582 points. Its nearest competitor, a raw carrot came in at 434.[Citation1] The Centre for Science in the Public Interest also rated the relative nutritional value of common vegetables and once again, the sweet potato came out on top with a score of 184, as compared with a similarly prepared regular potato, which scored only 83 points.[Citation1] Sweet potato is a popular staple food universally. It enjoys immense and increasing popularity in North and South America, Asia, and Africa.[Citation2]
The knowledge of thermal and physical properties of the food is essential for thermodynamic research and modeling the heat treatment of foods including vegetables. This is because the properties, to a large extent, determine the rate of the heat transfer process. Previously, constant average values of thermal properties were used in analyses of food processes which has lead to inaccurate analyses since these properties actually change during the process. However, modern analytical techniques have made it possible to accommodate these dynamic changes. The most important thermophysical properties in food processing, specific heat capacity, thermal conductivity, density, and thermal diffusivity of food materials depend mostly on the food's composition, temperature and density.[Citation3]
Differential scanning calorimetry was used to determine the specific heat of Tortilla chips as a function of frying time. At temperature range of 150 to 190°C, moisture content range of 1.3 to 36.1% and oil content, 0 to 27.7%, the C p of tortilla chip was 2560 to 3360 Jkg−1K−1.[Citation4] Specific heat of garlic was also determined as a function of temperature at different moisture content levels. Specific heat was found to increase with increase in temperature ranging from 2400 to 4100 Jkg−1K−1.[Citation5]
A hot wire probe was used to determine thermal conductivity of starch gel with gel concentration varying from 5 to 30% and within temperature range of 5 to 35°C. The range of k data from the experiment was 0.5 to 0.62 Wm−1K−1.[Citation6] Line heat probe was used to measure the effective thermal conductivity of deffated soy flour at room temperature. The results showed that thermal conductivity increased with increasing bulk density varying from 0.03 to 0.09 Wm−1K−1.[Citation7] Thermal conductivity of deep fat fried potatoes was determined from heat penetration into cylindrical samples between 50 and 100°C.[Citation8] The authors employed numerical solution of the heat transfer equation for an infinite cylinder with convective boundary conditions to fit the experimental data. Thermal conductivity of potato from the study was 0.5 to 0.9 Wm−1K−1.[Citation8]
Thermal conductivity has been found to be generally larger in wet materials.[Citation9] At 25°C, tomato and potato were reported to have thermal conductivities of 0.68 and 0.62 Wm−1K−1 at moisture content of 5 kg/kg (dry basis) as compared to thermal conductivities of 0.3 and 0.15 Wm−1K−1 at moisture content oft0.3 kg/kg (dry basis), respectively.[Citation9] Another study also reported thermal conductivity value of 0.63 Wm−1K−1 for potato at moisture content level of 6.1 kg/kg (dry basis) as compared to 0.36 Wm−1K−1 at moisture content of 2.0 kg/kg (dry basis).[Citation10]
Most of the methods for determining thermal diffusivity reported in literature were indirect in the sense that they were calculated from thermal conductivity, density, and specific heat. Direct (probe method) and indirect method was used to determine the thermal diffusivity of granular starch and the result showed that indirect method yielded more accurate values than the direct measurement as concluded from F-test at 5% significance level.[Citation11]
Despite the great potential of sweet potato, research works on its thermal properties are scarce in literature. A study of this nature is therefore important. The objective of this study was to investigate the effect of temperature and moisture content on thermal properties of sweet potato and to develop empirical models for thermal and physical properties of sweet potatoes as a function of product temperature and moisture content. Prediction models based on the thermophysical properties of major components of sweet potato and their corresponding mass or volume fractions were also developed and compared.
MATERIALS AND METHODS
Sample Preparation
Sunny II sweet potatoes grown in California (USA) were bought in 20 kg lots from the same store to reduce errors due to variation in sample. Sample sweet potatoes were used within one week of purchase. They were stored in a cooling chamber at a temperature range of 13 to 16°C and relative humidity of 85 to 90% to maintain its quality.[Citation2] The tubers were manually peeled with a hand peeler and then cut into cylinders using a cylindrical bore and a knife. Samples diameter was 4 cm and 6 cm height. A cylindrical sample holder was designed for this experiment. It is made up of two parts: the cylindrical container in which the sample is to be placed which is made of stainless steel and the cap to cover the container which is made of Teflon. A small hole was drilled on top of the cap through which the probe was inserted into the sample.
Thermal Conductivity and Thermal Diffusivity
Thermal conductivity and thermal diffusivity were measured using KD2 thermal properties analyzer (Decagon Devices Inc., Pullman, USA). It was based on a transient method of thermal properties determination. The equation describing the working principle of the KD2 is described below:
where T is final temperature (°C); T 0 is initial temperature before heating (°C); q is heat produced per unit length per unit time (Wm−1); k is the thermal conductivity of the edium (Wm−1°C−1); t is time (s); γ is Euler's constant (0.5772…); r is radial distance from the probe to the point where temperature is being measured (m); and α is thermal diffusivity (m2s−1).
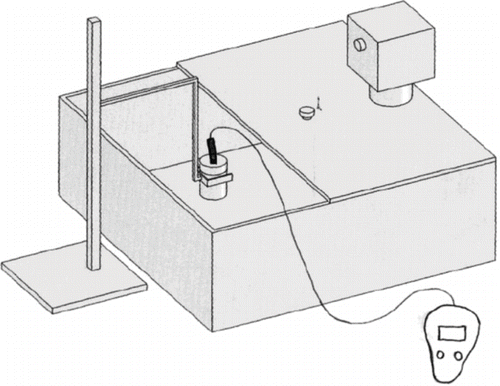
Sweet potato sample was placed inside the sample holder and covered with the cap. The holder was then held by a retort stand inside an agitated water bath (Thermomix 1441, B. Braun Instrument San Francisco, CA) that was preset at 20°C (). The sample was held this way for about 15 min to equilibrate. A thermocouple probe was used to check the temperature of the sample until a stable reading was obtained for the sample. The KD2 was inserted into the sample and the sample was allowed about 10 more minutes to equilibrate. The KD2 was switched on at this stage, and thermal conductivity, thermal diffusivity, and product temperature were recorded. The process was repeated for 30, 40, 50, and 60°C and four other sets of results were recorded for thermal conductivity, thermal diffusivity and product temperature. For higher temperatures (40 to 60°C), the packed sample was first heated in a microwave oven (Panasonic NN-5553C, Matsushita Corporation, Franklin Park, IL) for 20 to 40 seconds depending on the desired temperature. The power setting of the oven was adjusted to the maximum, 800 W. The sample was then transferred to the water bath and allowed about 20 to 40 min to equilibrate before the reading was taken. Moisture content of the sample was determined by oven method after each experiment to confirm the previous value measured. To simulate an infinite medium, using a specific heat estimate of 3500 Jkg−1K−1 for sweet potato at 20°C, the radial distance r, at which (T-T0) from EquationEq. (1) is zero over a test time of 100 s is 0.51 cm. The radius of our sample was 2.0 cm which is therefore adequate for this purpose. This is also greater than the least value of 0.5 cm required to minimize error due to finite sample diameter using our probe.[Citation4] Prior to determining k of sweet potato, KD2 was calibrated by determining the k of agar at room temperature. Agar is a polysaccharide that has very similar thermal properties with water. The ratio of determined k for agar to the theoretical k value found in literature was used as the calibration factor for our experiment.
Figure 1 Experimental set up for determining thermal conductivity and thermal diffusivity.
Material Density
Material density of samples was measured with a Gas-pycnometer (Multipycnometer, Quantachrome Corporation, Boynton Beach, FL), which uses gas of very small atomic size as the displacement medium. The very small atomic size of the gas ensures total penetration of the material pores. The pycnometer measures the volume of the sample which was then adjusted with the mass of the sample to give the material density of the product. The operational equation of the pycnometer is given below:
where V P is volume of sample to be determined (cm3); V C is volume of sample cell (cm3); P 1 is pressure after pressurizing the reference volume only (Pa); P 2 is pressure after including V C . (Pa); and V R is reference volume (cm3). Prior to determining the material density of sweet potato, the pycnometer was calibrated by determining the reference volume, V R , and the sample cell volume, V C . This was done by supplying 20 psi of gas to the sample cell when it contained a steel sphere of known volume and also when it was empty (contained no sphere) and then measuring two pressure values each from the sample cell and from the reference volume. Calibrated V R and V C were given by the following equations:
and
where V C = volume of sample cell; V R = reference volume; V S = volume of sphere (cm3), P 1 ′ = pressure from the reference volume without steel sphere inside (Pa); P 2 ′ = pressure from the reference volume and sample cell volume without steel sphere inside (Pa); P 1 = pressure from the reference volume with steel sphere inside (Pa); and P 2 = pressure from the reference volume and sample cell volume with steel sphere inside (Pa). The weight of the sample was measured by a mass balance and the ratio of the mass to the volume given by the pycnometer represents the material density of the sample. The material density was determined within a product moisture content range of 0.45–0.75 wb.
Specific Heat
The specific heat for this study was determined indirectly from the thermal conductivity, thermal diffusivity and the material density previously determined. From the relation:
where C p is specific heat (Jkg−1K−1); k is thermal conductivity (Wm−1K−1); ρ is density (kgm−3); and α is thermal diffusivity (m2s−1).
Moisture Content
Moisture content of the sample was varied by drying in a microwave oven at 800 W. Preliminary test was performed to evaluate moisture loss of the sample versus microwave drying time. Afterwards, samples were heated for the period required to achieve the desired sample moisture content. After heating, moisture content was again determined by oven dry method[Citation12] to confirm the value. Moisture content range used for the study was 0.45–0.75 wb.
Initial Product Temperature
The KD2 thermal properties analyzer simultaneously provides temperature of the sample while determining its thermal properties. Also the water bath has a temperature controller which regulates fluctuations within ± 0.1°C to keep the water and the sample at the required temperature. Initial water bath temperature values used were 20, 30, 40, 50, and 60°C. Product temperatures were measured and used in developing our empirical models.
Data Analysis and Thermal Properties Modeling
Thermal conductivity and thermal diffusivity measurements were made with the KD2, while density measurement was taken with the gas-pycnometer. The data were analyzed using PROC GLM of SAS for the effect of individual factors and interactions between them. Type 1 error rate was set at α = 0.05. We have 2 replications, 4 levels of moisture content and 5 levels of temperature for thermal conductivity and thermal diffusivity experiments (). Density was not included in the model to avoid multicollinearity among the variables since density was related to moisture content. The correlation between the density of sweat potato and moisture content was:
Table 1 Levels of factors for thermal conductivity and thermal diffusivity experiments
where ρ is density (kg/m3), and m is moisture content, decimal (wet basis).
Comparison with Mechanistic Models with Major Food Components
Thermal and physical properties of sweet potato were determined from the thermal properties of its major components namely carbohydrate, protein, fat, fibre, ash, and water. A previous work[Citation3] was utilised in determining the thermal conductivity, thermal diffusivity, material density and specific heat capacity of pure protein, carbohydrate, fat, fibre, ash and water. Choi and Okos[Citation3] used a modified probe method to determine the thermal conductivity and thermal diffusivity of pure component suspension of each major food component for a solid range of 10 to 60% and a temperature range of 40 to 150°C. The authors also used volumetric pycnometer and differential scanning calorimeter to measure density and specific heat, respectively. The experimental values obtained were then used by them to develop general mathematical models with the weight fractions or volume fractions of major components of foods. Group models were developed for individual properties.
The maximum and minimum of thermal conductivity of a two-phase system as series (two phases are thermally in series with respect to the direction of heat flow) and parallel distribution (two phases are thermally in parallel with respect to the direction of heat flow) was determined[Citation13] and.[Citation14] Series model is represented below:
where ∊ i the volume fraction of ith component phase; k i is the thermal conductivity of ith phase; and k is the effective thermal conductivity of the composite medium predicted by the series model.
Parallel model is represented by:
Both the perpendicular (series) and parallel models were tested in our present study however the parallel model consistently gave higher values, which were also closer to values found in literature for all three of specific heat, thermal conductivity and thermal diffusivity of sweet potato and similar products. This is in agreement with a reported study that the parallel model applies better to non-fibrous materials where thermal properties are not dependent on direction of heat flow.[Citation15]
For specific heat, the prediction model in terms of food components[Citation3] presented below was used in our work:
where X i is the weight fraction of ith component phase; C pi is the specific heat capacity of ith phase; and C p is the effective specific heat capacity. Prediction model used for density[Citation3] is:
where X i is the weight fraction of ith component phase; ρ i is the density of ith phase; and ρ is the density. Thermal diffusivity for this study was evaluated indirectly from values of thermal conductivity, density and specific heat:
The models developed by the authors[Citation3] were used to predict the variation of food components properties with temperature, while the moisture content in the product was varied within 0.45 to 0.75 w.b. to predict the variation of properties with moisture content of the food. Mass ratio of major food components in sweet potato was obtained from literature[Citation16] and is presented in . Volume fractions of the components were developed as a function of temperature and moisture content from the weight fraction and density of the components.
Table 2 Percentage composition of major food components in sweet potato (adapted from USDA, 1963)
RESULTS AND DISCUSSIONS
Thermal Conductivity
From the experiment, thermal conductivity of sweet potato was 0.49 ± 0.038 Wm− 1 K−1 (mean ± s.d) for temperature range of 20.5–60°C and moisture content range of 0.45 to 0.75 w.b. (). For statistical analysis, moisture content, m, temperature, T and interaction between the factors, m∗T were considered. Statistical information for models tested is presented in . For moisture content, both linear and quadratic effects on thermal conductivity of sweet potato were significant (p < 0.05) but only linear effect was significant for product temperature. There was no interaction effect. The model developed was:
Table 3 Thermal conductivity of sweet potato determined by KD2
Table 4 Statistical information on models tested
Thermal conductivity of sweet potato from our mechanistic models with food component mass[Citation3] was 0.30 to 0.41 Wm−1K−1 for temperature range of 20–60°C and moisture content range of 0.45 to 0.75 w.b. (). Thermal conductivity of sweet potato increased with moisture content and temperature. Both the parallel and perpendicular models from the food component model resulted in a lower value of k when compared with the experimental data but the parallel model gave predictions closer to experimental values. The RMSE (root mean square deviation) between predictive values from the two models and our experimental data were 0.094 for parallel model and 0.115 for perpendicular model. RMSE between the measured data and the empirical model developed from it was 0.005. The simplified regression model with temperature and moisture content developed from parallel model and food composition of sweet potato was:
Table 5 Thermal conductivity of sweet potato by prediction model (Parallel)
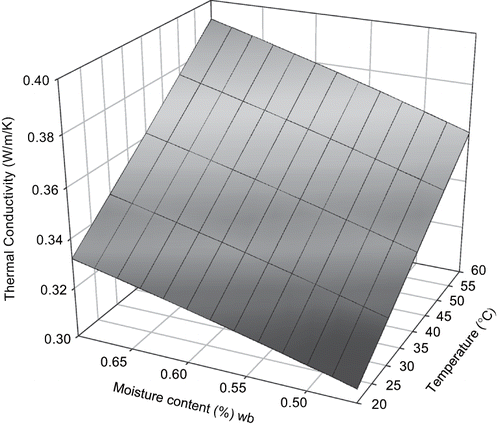
Three dimensional surface mesh plots of thermal conductivity from both empirical and mechanistic (parallel) models were made for visual comparison ( and ).
Figure 2 Thermal conductivity of sweet potato calculated from experimental model as a function of moisture content and temperature.
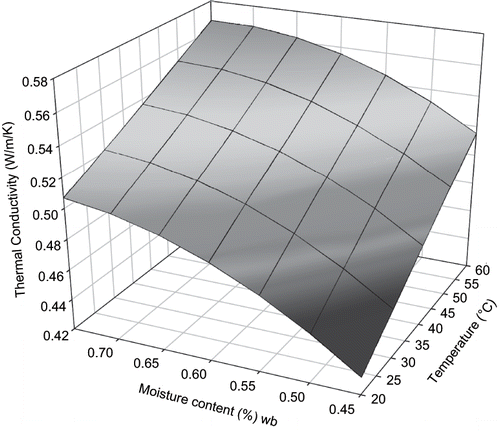
Figure 3 Thermal conductivity of sweet potato as a function of moisture content and temperature calculated from food component mass fraction model (parallel).
Thermal Diffusivity
Thermal diffusivity of sweat potato in this study was 1.0 × 10⁻⁷ to 1.3 × 10⁻⁷ m2s−1 (). This was comparable with 1.1 × 10⁻⁷ m2s−1 reported for thermal diffusivity of sweet potato at 40°C.[Citation17] Linear effects of moisture content, m, and temperature, T on thermal diffusivity of sweet potato (p < 0.05) were significant. The detailed statistical information for the model component is given in . The empirical model developed was:
Table 6 Thermal diffusivity of sweet potato determined by KD2
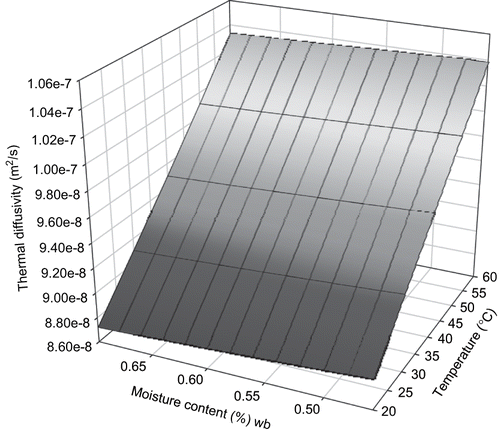
Thermal diffusivity of sweet potato from the food components mass prediction model was 8.7 × 10⁻⁸ to 1.09 × 10⁻⁷ m2s−1 for temperature range of 20–60°C and moisture content range of 0.45 to 0.75 w.b. (). RMSE between experimental data and predictive model was 2.72 × 10⁻⁸. RMSE between the measured data and empirical model developed from it was 1.75 × 10⁻⁸. The mechanistic models with the food components were simplified using regression modeling approach to relate the thermal diffusivity with moisture content and product temperature. The simplified model developed was:
Table 7 Thermal diffusivity of sweet potato from prediction model (Parallel)
Three dimensional surface mesh plots of thermal diffusivity from both models were made ( and ). The effect of temperature was predominant as could be seen from the plot and the model.
Figure 4 Thermal diffusivity of sweet potato from an experimental model as a function of moisture content and temperature.
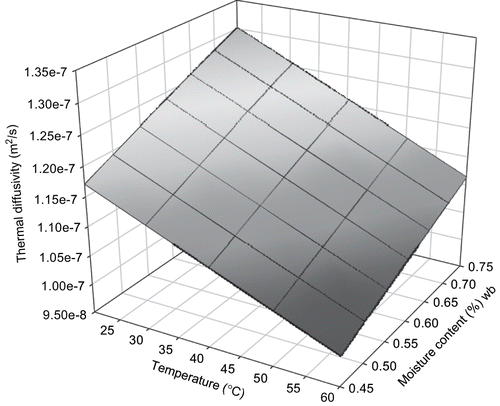
Figure 5 Thermal diffusivity of sweet potato as a function of moisture content and temperature calculated from food component mass fraction model.
Specific Heat
For the same range of temperature and moisture content as for thermal conductivity, specific heat of sweat potato was 3660 ± 477 Jkg−1K−1 (mean ± sd.) results are presented in . From statistical analysis, linear effects of moisture content, m, and temperature, T were significant on specific heat of sweet potato (p < 0.05). The detailed statistical result is presented in . The empirical model developed was:
Table 8 Calculated specific heat of sweet potato from experimental k, α, and ρ
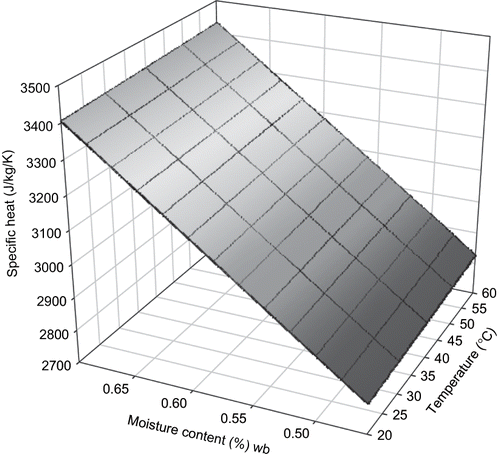
The range of specific heat of sweet potato from the food component mass fraction model was 2763 to 3558 Jkg−1K−1 for the temperature range of 20 to 60°C and moisture content range of 0.45 to 0.75 w.b. (). The simplified mass fraction model with temperature and moisture content developed is:
Table 9 Specific heat of sweet potato by prediction model (Parallel)
Two 3-dimensional surface mesh plots of specific heat from both models were plotted ( and ). Observations from the models and the plots suggest that the effect of moisture content is predominant in determining C p of sweet potato. RMSE between experimental data and the mass fraction model for C p was 838.2. RMSE between the measured data and empirical model developed from it was 550.
Figure 6 Specific heat of sweet potato from an empirical model as a function of moisture content and temperature.
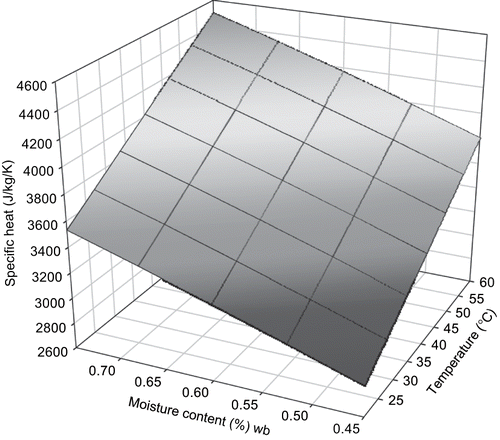
Figure 7 Specific heat of sweet potato as a function of moisture content and temperature calculated from food component mass fraction model.
Material Density
Material density of sweet potato was determined and modeled as a function of moisture content. Four moisture content levels of 0.75, 0.65, 0.55, and 0.45 were used. The result from the experiment is presented in and . Density was modeled as a function of moisture content, w.b. (EquationEq. 18). Coefficient of determination (R2) was 0.97 and mean square error (MSE) was 156.1.
Figure 8 Average density of sweet potato as a function of moisture content at 95% confidence level determined using a multipycnometer.
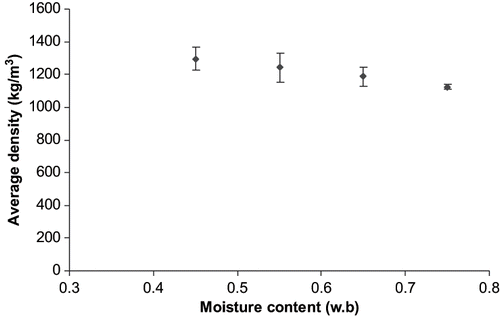
Table 10 Density of sweet potato determined by Multipycnometer
Material density of sweet potato from the food component mass fraction model was 1082 to 1218 kgm−3 for the temperature range of 20 to 60°C and moisture content range of 0.45 to 0.75 w.b. (). The simplified mass fraction model with temperature and moisture content developed is:
Table 11 Material density of sweet potato by prediction model (Parallel)
where ρ is density (kg/m3); T is temperature (°C); and m is moisture content (w.b.). Observation from the result showed that material density of sweet potato reduces with increase in both moisture content and temperature of the product.
Regression modeling of our results was first done using exponential functions. We believed this should fit our data best since the kinetics of energy, mass and momentum transfer and reactions is usually in exponential fashion in nature. However the polynomial equation fits better with the data () and this probably supports why most thermal properties models in literature were polynomial. There could be variation with source in the properties of food component.[Citation3] This means that there could be a difference between the thermal conductivity of carbohydrate extracted from beef and that extracted from potato. Even same crop specie (horse beans) that were grown in different locations exhibit difference in qualitative and quantitative carbohydrate composition.[Citation18] Thermal properties of food materials also depend on any factors that affect the heat flow paths through the material such as percent void spaces, shape, size, and arrangement of void spaces, homogeneity and orientation of fibers.[Citation19] The variation between the thermal properties models derived from major food compositions and the empirical models could be due to any or all of the reasons given above.
CONCLUSIONS
A study of thermal properties of sweet potato was carried out. Prediction models were developed for thermal properties of sweet potato over various ranges of moisture content and temperature both from experiments and mechanistic models with major food components of sweet potato. For thermal conductivity, thermal diffusivity, and specific heat, the parallel model gave better predictions than the perpendicular (series) model. Thermal properties values from models of major components of sweet potato were generally lower than values from our experiments. We speculate this could be largely attributed to variation between sweet potato and the sources of components used in determining thermal properties models used in this study and also the factors that affect heat flow patterns in both products. The derived models would provide a reasonable estimate of thermal conductivity, thermal diffusivity, and specific heat of sweet potato. It is recommended that more work be done to further investigate the effect of moisture content and temperature on thermal properties of sweet potato at higher temperature values at which point there might be significant moisture migration from the product to environment or measurement sensors during heating and measurement.
Related Research Data
REFERENCES
- Cummings , B. 2005 . Growing Sweet Potato in East Texas . Van Zandt County Extension Bulletin ,
- Kotecha , P.M. and Kadam , S.S. 1998 . “ Sweet potato ” . In Handbook of Vegetable Science and Technology: Production, Composition, Storage and Processing , Edited by: Salunkhe , D.K. and Kadam , S.S. 71 – 98 . New York : Marcel Dekker .
- Choi , Y. and Okos , M.R. 1985 . “ Effects of Temperature and Composition on the Thermal Properties of Foods ” . In Food Engineering and Process Applications , Edited by: Lemaguer , M. and Jelen , P. Vol. 1 , 93 London : Elsevier .
- Moreira , R.G. , Palau , J. , Sweat , V.E. and Sun , X. 1995 . Thermal and Physical Properties of Tortilla Chips as a Function of Frying Time . Journal of Food Processing and Preservation , 19 : 175 – 189 .
- Kramkowski , R. , Kamiński , E. and Serowik , M. 2001 . Effect of Moisture and Temperature of Garlic on its Specific Heat . Electronic Journal of Polish Agricultural Universities , 4 ( 2 ) : 1
- Renaud , T. , Briery , P. , Andrieu , J. and Laurent , M. 1992 . Thermal Properties of Model Foods in the Frozen State . Journal of Food Engineering , 15 : 83 – 97 .
- Wallapapan , K. and Sweat , V.E. 1982 . Thermal Conductivity of Deffated Soy Flour . Trans. ASAE , 26 : 1440 – 1444 .
- Califano , A.N. and Calvelo , A. 1991 . Thermal Conductivity of Potato Between 50 and 100°C . Journal of Food Science , 56 : 586 – 589 .
- Maroulis , Z.B. , Saravacos , G.D. , Krokida , M.K. and Panagiotou , N.M. 2002 . Thermal Conductivity Prediction for Foodstuffs: Effect of Moisture Content and Temperature . International Journal of Food Properties , 5 ( 1 ) : 231 – 245 .
- Krokida , M.K. , Michailidis , P.A. , Maroulis , Z.B. and Saravacos , G.D. 2002 . Literature Data of Thermal Conductivity of Foodstuffs . International Journal of Food Properties , 5 ( 1 ) : 63 – 111 .
- Drouzas , A.E. , Maroulis , Z.B. , Karathanos , V.T. and Saravacos , G.D. 1991 . Direct and Indirect Determination of the Effective Thermal Diffusivity of Granular Starch . Journal of Food Engineering , 13 ( 2 ) : 91 – 101 .
- Association of Official Analytical Chemists . 2002 . Official Methods of Analysis of AOAC International , 17th , Vol. 2 , Gaithersburg, MD : AOAC .
- Woodside , W. and Messmer , J.H. 1961 . Thermal Conductivity of Porous Media . I. Unconsolidated Sands. Journal of Applied Physics , : 1688
- Brailsford , A.D. and Major , K.G. 1964 . Thermal Conductivities of Aggregates of Several Phases Including Porous Materials . British Journal of Applied Physics , 15 : 313
- Stroshine , R. 1998 . Physical Properties of Agricultural Materials and Food Products , West Lafayette, IN : Purdue University .
- United States Department of Agriculture . 1963 . Agriculture Handbook No 8; Composition of Foods; Raw, Processed, Prepared , Washington, DC : USDA .
- Wadsworth , J.I. and Spadaro , J.J. 1969 . Transient Temperature Distribution in Whole Sweet Potato Roots during Immersion Heating . Food Technology , 23 : 219
- Cerning , J. , Saposnik , A. and Guilbot , A. 1975 . Carbohydrate Composition of Horse Beans of Different Origins . Cereal Chemistry , 52 ( 2 ) : 125 – 138 .
- Sweat , V.E. 1995 . “ Thermal Properties of Food ” . In Engineering Properties of Food , Edited by: Rao , M.A. and Rizvi , S.S.H. 99 – 138 . New York : Marcel Dekker .