Abstract
The results of this present studies show that the colour of the seed coat of wheat kernels can be determined by digital image analysis (DIA) instead of spectrophotometry. High linear correlations (p < 0.05) were found between colour measurements of the seed coat performed by these techniques. The colour on the cross-sections of wheat kernels was related to the colour of their seed coat. A high correlation was also observed between the colour of the seed coat and the colour of the endosperm of wheat kernels. In all measurements colour was described by the RGB, XYZ, and L*a*b* models. Colour indices, i.e. hue (h0) and saturation (S*) were also calculated.
INTRODUCTION
One of the most important goals to be achieved by grain producers is to estimate and preserve the technological and hygienic quality of the product. The principles of grain quality grading have to be established in every country, taking into account the classifications already applied in the EU and on the global food market.Citation[1] It follows that there is an urgent need to develop an objective, reproducible, rapid, and inexpensive system that would permit a reliable quality assessment of raw materials from agricultural production.Citation[2] Grain quality evaluation is based, among others, upon grain uniformity, type and quantity of impurities, the level of detected fissures, grain size, moisture content of grain, as well as the concentration and quality of protein. All of these parameters can be successfully determined by digital image analysis (DIA).[Citation3,Citation4,Citation5] DIA also enables the measurement of optical density of the surface and cross-section of the endosperm in wheat or barley kernels. In addition, this method allows the analysis of changes in grain color caused by pest infestation, mould growth, changes in the moisture content of grain or overheating, as well as changes in the chemical composition (levels of phenolic compounds) of the seed coat of wheat kernels when various processing and handling technologies are used. Color measurements of the endosperm cross-section (referred to as vitreousness or mealiness of the endosperm) may be used in order to determine wheat quality grade. Studies on the microstructure of the wheat endosperm by scanning microscopy serve a similar purpose. Digital image analysis for distinguishing between cereal species, estimating grain quality and contamination levels have been tested at numerous research centres. First reports on this topic were published by Zayas et al.,Citation[6] Neuman et al.,Citation[7,Citation8] and Majumdar & Jayas.Citation[9] Another outstanding contribution was also made by Majumdar & Jayas.Citation[10,Citation11,Citation12,Citation13] Digital image analysis is also used to grade wheat grain and determine wheat varieties based on the geometric features of kernels.Citation[8] The optical quality (color) of the surface and cross-section of the wheat endosperm can also be tested by digital image analysis. This method is also applied to determine the numbers and dimensions of three types of starch granules in the endosperm of soft and hard wheat kernels.Citation[14,Citation15,Citation16] According to Dexter,Citation[17] digital image analysis may be a powerful tool for control over the milling process. Milling efficiency could be greatly improved under conditions of constant and direct monitoring of the changing parameters of products. Berman et al.Citation[18] formulated, based on multifactor analysis of variance and regression analysis, an empirical equation explaining about 70% of estimated variation of flour extraction. The possible correlation between seed coat color and the concentration of phenolic compounds was also examined.Citation[19] Majewska et al.Citation[20,Citation21,Citation22,Citation23] investigated the relationships between a variety of technological quality attributes of winter and spring wheat kernels and their geometric parameters determined by DIA. Microscopic images of wheat kernels were also studied.Citation[24,Citation25] The results of these studies confirmed a significant difference between the microstructure of the endosperms of vitreous and mealy kernels, and statistically significant differences between wheat varieties. Computer visual systems use mainly the RGB model for color description, whereas spectrophotometric measurements are based upon the XYZ model that can be converted into L*a*b*. The conversion of the RGB and XYZ models into L*a*b* enables to obtain more information on color. It allows the calculation of hue, saturation and absolute color difference between two objects. Naturally, both of these techniques have some advantages and disadvantages. Spectrophotometers provide reproducible results of color measurements, with strictly specified spectral composition of light (D65, C) and observer (10 0 , 20). However, these instruments are expensive and measure color over a small area only. Computer vision systems are inexpensive, but color measurements are burdened with errors stemming from changing conditions (unstable illumination, a variety of apparatus used, including scanners, digital cameras, and CCD cameras). Despite these disadvantages digital image analysis is becoming a powerful tool for quality assessment of food products. The aim of the present study was to determine the correlations between the color of the seed coat of wheat kernels, measured with a spectrophotometer and by digital image analysis, and the color on their cross-section.
MATERIALS AND METHODS
Materials
The experimental materials comprised 17 varieties of spring and winter wheat that have a high proportion in the cropland structure and seed reproduction in Poland: BANTI, JASNA, KOBRA, KOKSA, KORWETA, MEWA, NAWRA, OPATKA, PEGASSOS, SAKWA, SUKCES, SYMFONIA, TONACJA, TORKA, VINJETT, ZEBRA, and ZYTA. Wheat was harvested from production fields in September of 2004 year.
Instruments
The colour on the cross-section of the wheat endosperm was measured on a test stand for digital image analysis, equipped with a stereoscopic microscope, model SL 64 T EDUKO, an OLYMPUS Z3040 camera, and a computer with MultiScan software, ver.11.06. The colour of the seed coat of wheat kernels was measured with a spectrophotometer (MiniScan XE Plus, HunterLab, observer 100, light D65) and by digital image analysis, using a flat scanner (ScanMaker 4800, Microtek, MultiScan ver.11.06).
Methods
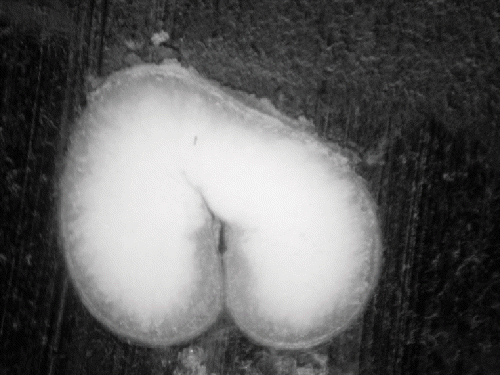
The colour on the cross-section of the wheat endosperm was measured on 120 kernels selected randomly from each variety. One part of each kernel was cut off, and 12 kernels (turned to the same side) were glued to cardboards. The cardboards with glued kernels were put into a mould, 20 mm in diameter and 15 mm in height. Paraffin wax was melted in a dryer at 60°C, and mixed with a dye. The dye was selected to expose the difference in colour between the wheat endosperm and the background. The cross-section obtained is shown at .
Figure 1 Cross-section through a wheat kernel (author: Zapotoczny).
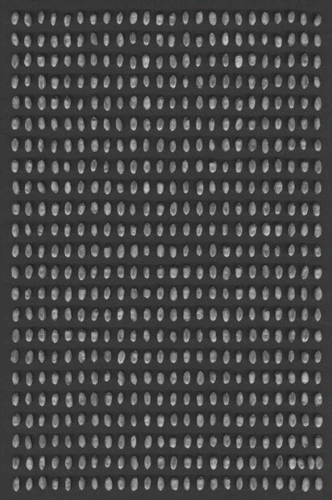
The moulds with kernels were placed in a dryer for about 2 min in order to equalize the temperature of the moulds and paraffin. Then they were paraffin-embedded and cooled at room temperature until paraffin had hardened. Blocks of hard paraffin were put into a microtome, model MΠC–2, and cut to a depth of 4–5 mm on the side of embedded kernels. Samples prepared in this way were placed under a microscope and illuminated from above with artificial light; 24-bit images of the endosperms of wheat kernels were taken with resolution set to 1024/768 pixels, and saved in TIFF format. Colour measurements of the seed coat were performed on 600 kernels of each variety. Three hundred kernels (in two sets) were grouped together for this purpose and grooves down (.).
Figure 2 Kernel arrangement–scanner (author: Zapotoczny).
Digital Image Analysis
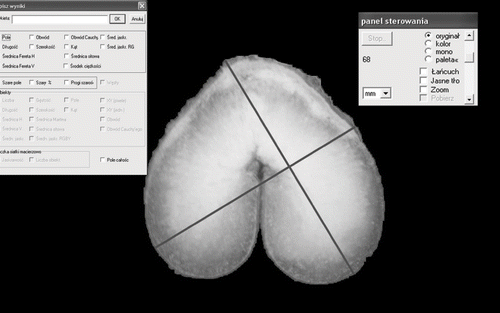
In order to distinguish between the kernel endosperm cross-section and the background, the images were processed using MultiScan software. Non-linear and median filters, and binarization with hysteresis were applied. In the majority of images, the background contained considerable quantities of impurities, which was a consequence of the sample preparation technique employed. Therefore, in order to discriminate between the kernel endosperm cross-section and the background, the cross-section was outlined along endosperm perimeter (). This solution was found to be quicker and more effective than performing several complex operations.
Figure 3 Image preparation for measurement (author: Zapotoczny).
Automated colour measurement of the seed coat was preceded by developing a method for filtration transformations of images. Because the images were saved as 24-bit ones, 8 bits per each RGB channel, the first step was to eliminate the redness component. The images contained considerable amounts of impurities (pieces of wheat kernels, dust particles, etc.), so they were filtered using a non-linear median filter (radius 3). This was followed by image binarization (threshold 98) and conversion into a 1-bit image. This permitted automated identification of objects and colour determination within the outline. Colour measurement with a spectrophotometer was performed in grain mass. Thirty replications were made for each variety.
Colour
The colour of the endosperm and seed coat, determined by DIA, was saved in the RGB system, which was then transformed into XYZ and L*a*b*. Hue h0 and saturation S* were also computed. The statistical package Statistica 7.1 was used. The computational procedures were developed based on the information and software provided at http://www.easyrgb.com/math.html. The colour of the seed coat measured with a spectrophotometer was described in the L*a*b* system. For converting colour models, the following mathematical formulas were used:
XYZ to L*a*b*
RGB to XYZ
XYZ to RGB
XR= 94.81, YR= 100.0, ZR= 107.3 parameters of standard whiteness point for observer 100 and light D65.
RESULTS AND DISCUSSION
Colour in the RGB System
The values of the RGB components in colour measurements of the seed coat and endosperm of wheat kernels are presented in Figs. . shows the results of an analysis of linear correlations (p < 0.05). Regardless of the measuring technique, all colour components were significantly and highly correlated. For the coordinate R (redness), the correlation between colour measurements of the seed coat performed with a spectrophotometer and scanner was 0.89. In the case of colour measurements of the wheat endosperm, the coordinate R was correlated at a level of 0.82 with the component obtained with a scanner, and 0.77 with that obtained with a spectrophotometer. Similar relationships were recorded for the greenness component G. The lowest correlations were observed between colour measurements of the endosperm and seed coat in the case of the blueness component B for the scanner (0.51) and for the spectrophotometer (0.52).
Figure 4 Component R for particular varieties.
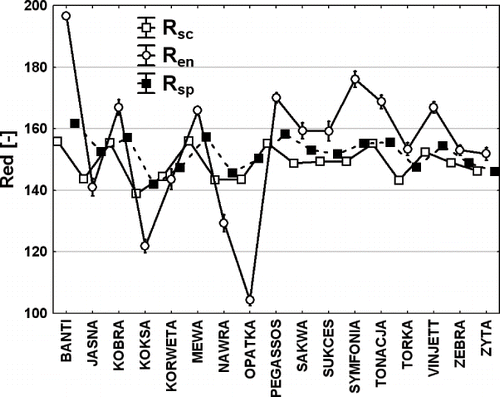
Figure 5 Component G for particular varieties.

Figure 6 Component B for particular varieties.
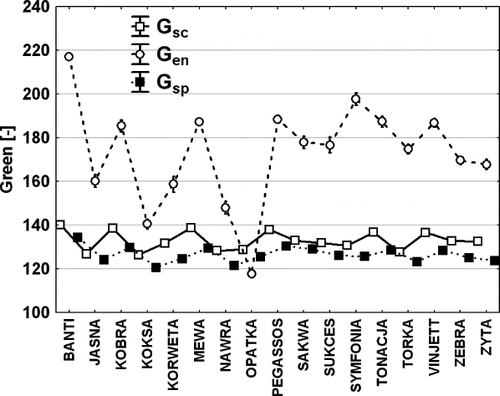
Table 1 Correlation for RGB components (linear correlation coefficients between studied parameters – 17 wheat varieties)
Wheat variety OPATKA had the lowest values of the redness, greenness and blueness components (Ren, Gen, Ben), and var. BANTI—the highest. Var. OPATKA differed significantly from the other varieties in endosperm colour – obtained results suggest that this variety was characterised by the most vitreous endosperm, while variety BANTI had the most mealy endosperm. Both these varieties belonged to spring form, but they are differed in class of technological quality.
Colour in the XYZ System
and present the values of the coordinates XYZ from colour measurements of the seed coat and endosperm. All measured components were highly correlated, irrespective of the measuring technique. A very high linear correlation was found between the colour components of the seed coat, obtained with a spectrophotometer and scanner. The correlation coefficients ranged between 0.77 and 0.91 (). Weaker relationships were observed between the colour of the endosperm and the colour of the seed coat, but the values of correlation coefficients were still high (0.60 to 0.78). Var. OPATKA was characterized by the lowest values of colour components XYZ for the seed coat and endosperm, and var. BANTI – by the highest.
Figure 7 Components X, Y for particular varieties.
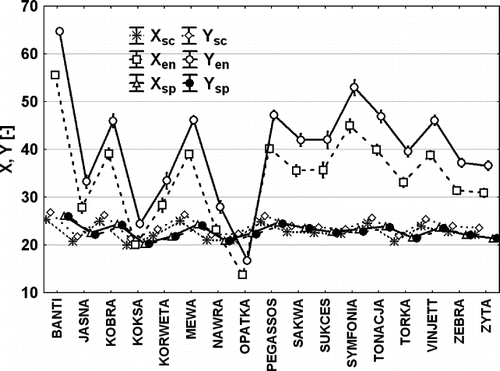
Figure 8 Components Z for particular varieties.
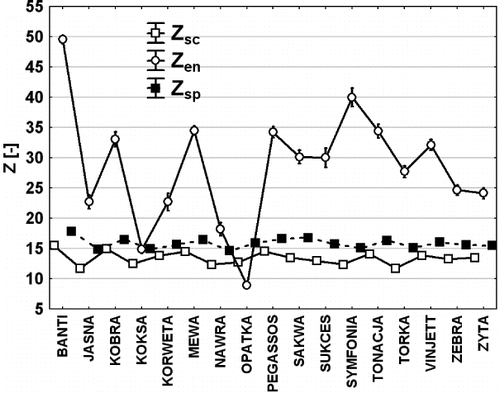
Table 2 Correlation for XYZ components (linear correlation coefficients between studied parameters – 17 wheat varieties)
Colour in the L*a*b* system
Lightness L*
There was a highly significant correlation between the lightness component of the seed coat measured with a spectrophotometer and by DIA (0.90), whereas the coefficients of correlation between the lightness of the endosperm and the lightness of the seed coat were 0.75 and 0.76, depending on the measuring technique (). The lightness (L*) of the seed coat measured with a spectrophotometer ranged from 52.11 units for var. KOKSA to 57.94 for var. BANTI (). The colour lightness of the seed coat measured using a scanner ranged from 53.19 units for var. KOKSA to 58.73 for var. BANTI. Variety BANTI had the lightest endosperm (84.24), and var. OPATKA – the darkest (47.35). Low values of the parameter L* were also recorded for varieties KOKSA and NAWRA.
Figure 9 Component L* for particular varieties.
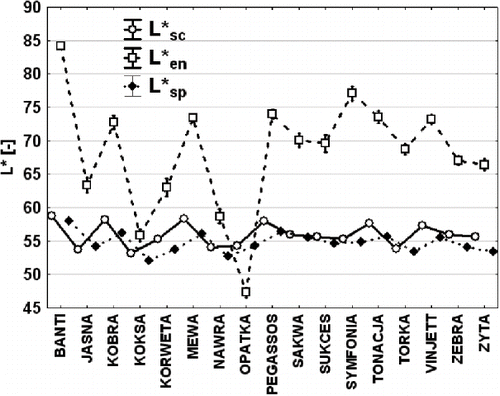
Table 3 Table of correlation for L*a*b* components, hue and saturation of color components (linear correlation coefficients between studied parameters – 17 wheat varieties)
Redness (a*) and yellowness (b*)
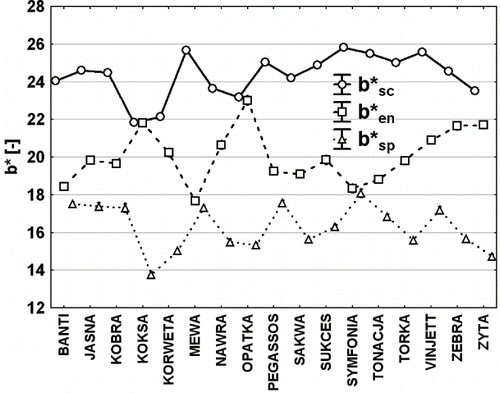
Similarly as colour lightness, redness and yellowness of the seed coat measured by two techniques were significantly correlated (p < 0.05) (, and ). The coefficient of linear correlation was 0.84 for redness (a*) and 0.80 for yellowness (b*). There was no statistically significant correlation between the redness of the endosperm and the redness of the seed coat measured with a spectrophotometer and scanner. The yellowness of the endosperm and seed coat showed statistically significant correlations for all measuring techniques.
Figure 10 Component a* for particular varieties.
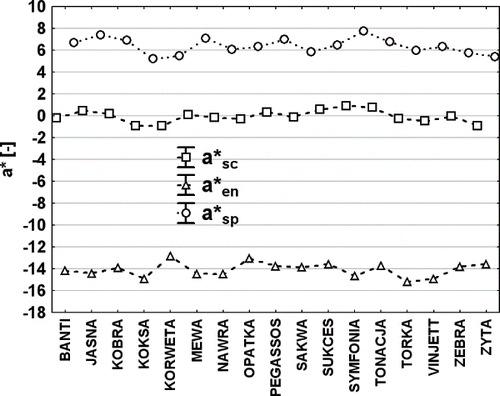
Figure 11 Component b* for particular varieties.
Hue (h0) and saturation (S*)
No statistically significant correlations were found between the hue ( and and ) of the seed coat measured with a spectrophotometer and scanner. The hue of the endosperm was not correlated with the hue of the seed coat. There was only a correlation between the saturation of the endosperm and seed coat measured by spectrophotometer (−0.66) (, ).
Figure 12 Color hue for particular varieties.
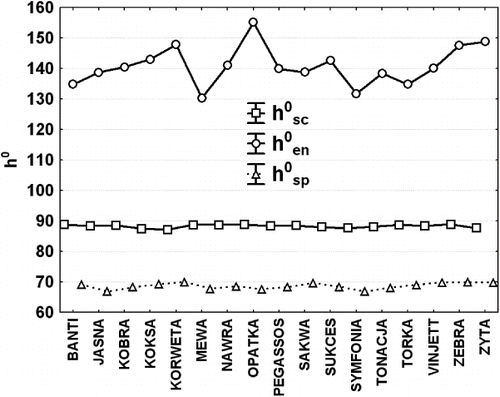
Figure 13 Color saturation for particular varieties.
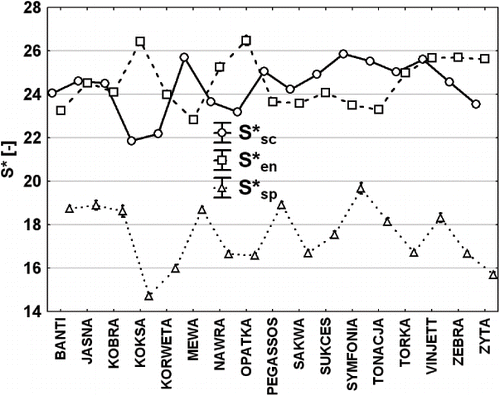
Table 4 Results of wheat grain color measurements—hue and saturation
CONCLUSIONS
The results of the study showed that there was a high linear correlation (p < 0.05) between the colour of the seed coat measured with a spectrophotometer and by digital image analysis. This indicates that both visual techniques may be successfully used for colour assessment of wheat grain. A high correlation was also found between the colour of the seed coat and the colour of the endosperm of wheat kernels. The conversion of the XYZ and RGB models into the L*a*b* model enabled the computation of the hue and saturation of colour. The lowest correlations were observed between the hue of the seed coat and endosperm, and particular components of the colour models. Var. BANTI (spring wheat, class B of technological quality) had the lightest seed coat, and spring wheats var. KOKSA and NAWRA (class A of technological quality)—the darkest. Similar results were obtained for colour measurements of the endosperm, except for the fact that the endosperm of spring wheat var. OPATKA (class A of technological quality) was much darker, compared with the other varieties. The obtained results can be useful in elaborating of vision systems for wheat grain quality grading.
COLOUR MEASUREMENTS OF WHEAT KERNELS
| Symbols | ||
| S* | = |
Saturation, CIE 1976 |
| h0 | = |
Hue CIE 1976 |
| −a*, +a* | = |
The green-red CIE 1976 |
| −b*, +b* | = |
The blue-yellow CIE 1976 |
| L* | = |
Lightness CIE 1976 |
| en | = |
Endosperm |
| sc | = |
Scanner |
| sp | = |
Spectrophotometer |
| R, G, B | = |
colour model |
| X, Y, Z | = |
colour model |
ACKNOWLEDGMENTS
The author is grateful to Tomasz Bulge, Tomasz Kawałko and Marcin Pokojski for their help in preparing the experimental materials. The authors are grateful for the financial support provided by the Ministry of Scientific Research within the framework of grant no. P06T 046 29.
REFERENCES
- Grundas , S. 2002 . “ Monitoring jednorodnosci ziarna zbóz - propozycje rozwiazan aparaturowych dla celów hodowlanych i przemyslowych ” . In Biuletyn Informacyjny nr 7 , PAN Oddzial w Lublinie .
- Sabliov , C.M. , Boldor , D. , Keener , K.M. and Farkas , B. E. 2002 . Image processing method to determine surface area and volume of axi-symmetric agriculture products . International Journal of Food Properties , 5 ( 3 ) : 641 – 653 .
- Karababa , Ersan and Yalçin , CoŞkuner . 2007 . Moisture dependent physical properties of dry sweet corn . kernels International Journal of Food Properties , 10 ( 3 ) : 549 – 560 .
- Lan , Y. , Fang , Q. , Kocher , M.F. and Hanna , M.A. 2002 . Detection of fissures in rice grains using imaging enhancement . International Journal of Food Properties. , 5 ( 1 ) : 205 – 215 .
- Ramesh , M.N. 2001 . An application of image analysis for the study of kinetics of hydration of milled rice in hot water . International Journal of Food Properties , 4 ( 2 ) : 271 – 284 .
- Zayas , I.Y. , Lai , F.S. and Pomeranz , Y. 1986 . Discrimination between wheat classes and varieties by image analysis . Cereal Chemistry , 63 ( 1 ) : 52 – 56 .
- Neuman , M. , Sapristein , H.D. , Shwedyk , E. and Bushuk , W. 1989 . Wheat grain color analysis by digital image processing: I. Methodology . Journal of Cereal Science , 10 ( 3 ) : 175 – 182 .
- Neuman , M. , Sapristein , H.D. , Shwedyk , E. and Bushuk , W. 1989 . Wheat grain color analysis by digital image processing: II. Wheat class determination . Journal of Cereal Science , 10 ( 3 ) : 183 – 192 .
- Majumdar , S. and Jayas , D.S. 1999 . Classification of bulk samples of cereal grains using machine vision . Journal of Agriculture Engineering Research , 73 ( 1 ) : 35 – 47 .
- Majumdar , S. and Jayas , D.S. 2000 . Classification of cereal grains using machine vision: I. Morphology models . American Society of Agricultural Engineering. Transactions of the ASAE , 43 ( 6 ) : 1669 – 1675 .
- Majumdar , S. and Jayas , D.S. 2000 . Classification of cereal grains using machine vision: II. Color Models. Morphology models . American Society of Agricultural Engineering. Transactions of the ASAE , 43 ( 6 ) : 1677 – 1680 .
- Majumdar , S. and Jayas , D.S. 2000 . Classification of cereal grains using machine vision: III. Texture Models. Morphology models . American Society of Agricultural Engineering. Transactions of the ASAE , 43 ( 6 ) : 1681 – 1687 .
- Majumdar , S. and Jayas , D.S. 2000 . Classification of cereal grains using machine vision: IV. Combined Morphology, Color, and Texture Models . American Society of Agricultural Engineering. Transactions of the ASAE , 43 ( 6 ) : 1689 – 1694 .
- Bechtel , D.B. , Zayas , I. , Kaleikau , L. and Pomeranz , Y. 1990 . Size-distribution of wheat starch granules during endosperm development . Cereal Chemistry , 67 ( 1 ) : 59 – 63 .
- Bechtel , D.B. , Zayas , I. , Dempster , R. and Wilson , J.D. 1993 . Size-distribution of starch granules isolated from Hard1 Red Winter and Soft Red Winter wheats . Cereal Chemistry , 70 ( 2 ) : 238 – 240 .
- Zayas , I.Y. , Bechtel , D.B. , Wilson , J.D. and Dempster , R.E. 1994 . Distinguishing selected hard and soft red winter wheats by image analysis of starch granules . Cereal Chemistry , 71 ( 1 ) : 82 – 86 .
- Dexter , J.E. 1997 . Praktyczne wykorzystanie badan przy przemiale pszenicy . Przeglad Zbozowo- Mlynarski , 2 : 16 – 19 . str
- Berman , M. , Bason , M.L. , Ellison , F. , Peden , G. and Wrigley , C.W. 1996 . Image analysis of whole grains to screen for flour-milling yield in wheat breeding . Cereal Chemistry , 73 ( 3 ) : 323 – 327 .
- Klepacka , J. , Fornal , L. , Borejszo , Z. and Gudaczewski , W. 1998 . Gestosc optyczna powierzchni ziarniaków pszenicy a zawartosc zwiazków fenolowych w okrywie nasiennej . Materialy XXIX Sesji Naukowej Komitetu Technologii i Chemii Zywnosci PAN , Olsztyn 21–23 .09.1998, str 268–269
- Majewska , K. and Gudaczewski , W. 2000 . Correlation between some technological quality factors of wheat grain and its geometrical features . Natural Sciences , 6 : 67 – 79 .
- Majewska , K. , Gudaczewski , W. and Fornal , L. 2000 . Wielkosc ziarniaków pszenicy a cechy reologiczne ciasta . Inzynieria Rolnicza , 5 ( 16 ) : 153 – 162 .
- Majewska , K. and Filipowicz , A. 2002 . Wplyw wielkosci ziarna na zmiany wartosci przemialowej pszenicy . Inzynieria Rolnicza 9 , 42 : 177 – 185 .
- Majewska , K. , Bialobrzewski , I. and Filipowicz , A. 2003 . Korelacje miedzy wymiarami geometrycznymi ziarniaków pszenicy jarej i wybranymi wyróznikami jej jakosci technologicznej . Inzynieria Rolnicza , 7 ( 49 ) : 85 – 91 .
- Fornal , J. , Jelinski , T. , Sadowska , J. and Quattrucci , E. 1999 . Comparison of endosperm microstructure of wheat and durum wheat using digital image analysis . International Agrophysics , 13 ( 2 ) : 215 – 220 .
- Konopka , I. , Kozirok , W. and Tanska , M. 2005 . Wheat endosperm hardness. Part I. relationships to colour of kernel cross-section . European Food Research Technology , 220 : 11 – 19 .