Abstract
The use of automated penetration measurements as a means to evaluate the hardness of lipid crystal networks is ubiquitous in the literature, but lacks consistency in the methodology applied, or the analysis used. This study provides a framework for the standardization of methodology and parameters used to measure hardness. A relatively large variety of lipid samples of varying hardness were tested with a texture analyzer. Penetration depth, speed, and probe type were independently varied to determine the optimum procedure with which to obtain force-displacement curves, and a variety of analysis techniques were considered to interpret these curves. Optimal curves were obtained at a penetration speed of 0.5 mm/s, using a constant penetration depth of 1.5 mm, and either a needle or ball probe depending upon the hardness or nature of the sample. The maximum force parameter was found to be the most unambiguous measure of hardness. The results from maximum force show close correlation with that from cone penetrometry—a method widely used in industry.
INTRODUCTION
Hardness is a measure of a material's resistance to permanent deformation. For fat crystal networks, hardness is an important macroscopic measurable which contributes to the sensory perception of the fat crystal network.[Citation1,Citation2] It is an important physical property among others which contributes to the functionality of commercial fats such as margarines and shortenings.[Citation3,Citation4] It can also affect the processing and handling requirements of the fat. Thus, a standardized measurement will benefit the industrial processing of lipids and fats.
Hooke's law of elasticity states that, for relatively small deformations of an object, the displacement or size of the deformation is directly proportional to the deforming force or load. The region of proportionality is referred to as the elastic region of the material. Elastic behaviour of solids is explained by the fact that small displacements from equilibrium positions of their constituents, molecules, atoms, or ions are also proportional to the force that causes the displacement. The “yield point of a material” occurs when the material no longer obeys Hooke's law. Hardness is related to the Young's modulus[Citation1] of the material, which is the ratio of stress to strain, determined within the elastic region.
The elastic behavior of fats, however, cannot be explained using the simple molecular arguments above. Due to the existence of hierarchies of structure, stressing of the macrostructure of a lipid network also involves the stressing of aggregates of crystals, single crystal entities, etc. As a fat is being penetrated by a probe, intramolecular forces are being disrupted within various limits of elasticity. The scale of a fat crystal network microstructure is 0.2–250.0 microns,[Citation5] while that of an indentation measurement is of the order of millimeters.[Citation6,Citation7] It has however been convincingly argued by Narine and Marangoni[Citation1] that at the level of structure which is being stressed, the applied force varies with change in distance between structural entities in a linear manner, which translates to the macroscale. Thus, during hardness testing, the probe passes through many microstructures (∼ 4 to 5000 given a small indentation distance of 1 mm and the structure size given above). This possibly explains why the force-displacement graphs of some fats display multiple regions of linearity as well as multiple yield points.
The measurement of hardness of fats by means of cone penetrometry is a well established and widely used technique[Citation1,Citation8–12] (and others too numerous to mention) carried out by a variety of standard methods.[Citation13,Citation14] From cone penetrometry data, several constants can be obtained such as the yield value[Citation10–12,Citation15] or the hardness index.[Citation8,Citation10,Citation15,Citation16] The hardness of a fat sample can also be determined by loading an indenter of known geometry onto the sample and measuring force response as a function of displacement.[Citation7,Citation15–21] The technique is frequently used in a variety of applications ranging from thin films, to alfalfa cubes to fat networks, among others.[Citation7,Citation15,Citation16,Citation21–24] Parameters such as the self described force at maximum displacement (FAMD), maximum force (MF), or slope of the linear segment of the force-displacement curve are commonly used as a measure of hardness. Obtaining complete force displacement curves via indentation, in lieu of the final distance of penetration as in cone penetrometry, is useful in determining hardness as well as brittleness, homogeneity, or consistency of a sample. However, for fully automated test equipment (controlled speed and penetration depth), significant variations exist between researchers with respect to the methodology used as shown in .
Table 1 Summary of testing parameters, geometries and analysis from the force-displacement curve literature
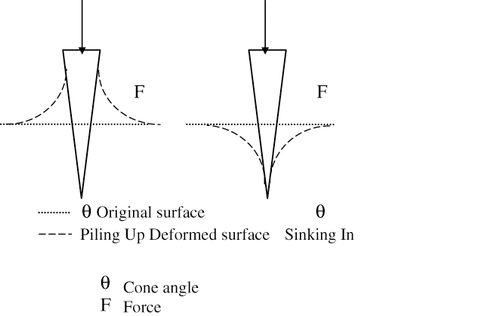
Sample response during measurement affects the continuity (smoothness) of the force displacement curve obtained. If the sample is not homogeneous or is brittle, the measured force as a function of distance will not demonstrate a continuous curve. As well, the sample can break or crack during the measurement process, and the sudden absence of cohesive energy or of resistance to further penetration by the geometry, causes discontinuities in the force displacement curves obtained. Fracture planes in the material may be interpreted from the force–displacement curve incorrectly as yield points. Sinking in, if the sample is hard, and piling up if the sample is soft () lead to difficulties in calculating the hardness as the contact area becomes difficult to measure and/or calculate.[Citation23] Therefore, homogeneous samples are ideal for creating force displacement curves, but uncontrollable factors (brittleness, sinking and piling) may also come into play.
Figure 1 Piling-up and sinking-in phenomena.
This study uses a TA.XT+ Texture Analyzer (Stable Microsystems, Surrey U.K.), and a “Precision Penetrometer” (Precision Scientific Company, Chicago, USA) to find the optimal combination of test parameters (depth of penetration, speed, and probe geometry) that allows an effective, repeatable and non-biased method to measure hardness of fats. Fat samples common to the shortenings industry as well as binary mixtures of purified TAGs are used to provide a framework for the standardization of methodology and parameters used to measure hardness.
EXPERIMENTAL PROCEDURES
All temperatures are reported to ± 0.5°C, and all depths and speeds are reported to ± 0.1 mm and ± 0.1 mm/s respectively. Measurements for each set of parameters tested were performed at least 8 times and the errors expressed are the standard deviations from the mean and a Students t-test was performed where appropriate.
Materials
Fully hydrogenated canola (FHCO) (supplied by Bunge Oil, Bradley IL., USA) was mixed with refined canola oil (RCO) (Canbra Foods, Lethbridge, AB, Canada) in xFHCO = 25, 50, 75, and 100% (w/w) dilutions and stored at −5°C in glass jars tightly covered to minimize oxidative degradation. The sample was melted to 90°C and stirred for 2 min using a motorized mechanical stirrer then poured into stainless steel pans 1-mm thick (62 mm in diameter, 42-mm tall). The samples were then equilibrated at 90°C for 5 min and left to cool overnight (18 h) at room temperature (24°C, also the testing stage temperature) prior to testing. The samples were of approximately equal mass (∼ 36.0 ± 0.5 g).
Commercially available canola-oil based margarine (Canola Harvest, Canbra Foods, Lethbridge, AB, Canada) was tested in the plastic container it was purchased in. The margarine was tempered overnight at room temperature. Binary mixtures of purified (> 97% by GC-FID) 1, 2−dilauroyl-stearoyl-sn-glycerol (LLS) and 1, 3−dilauroyl-2-stearoyl-sn-glycerol (LSL) were prepared in varying (w/w) concentrations (20, 40, 60, and 100%). Each sample was melted at 90°C and stirred for 2 min using a motorized mechanical stirrer before pipetting approximately 300 mg of the molten sample into small aluminum pans (diameter 7.4 ± 0.01 mm and height 3.1 ± 0.01 mm). The sample was heated to 90°C then cooled at 3°C/min to a final temperature of 20 °C (also the testing stage temperature).
Force-Displacement Measurements
After processing, the sample was transferred to a temperature controlled chamber (Autotune CAL 9300, CAL Controls Ltd., Herts, UK) already set up and maintained at the testing temperature. The chamber is fitted to a “TA.XT+ Structure Analyzer” (Stable Microsystems, Surrey U.K.) with a 1.0 kg load cell for force-displacement measurement. Sample penetration and data acquisition were controlled by the “Texture Exponent 32” software (Version 2.0.0.7, www.SaxSoft.com) provided with the instrument.
Cone Penetrometry Measurements
Cone penetrometry was performed with a ‘Precision Penetrometer’ (Precision Scientific Company, Chicago, USA) using the American Oil Chemists' Society Official Method for consistency measurements.[Citation13,Citation14] It was also performed with the TA.XT+ Texture Analyzer using an automated method provided with the instrument. Both instruments were fitted with the same stainless steel penetration cone of mass 2.5 g and angle 8° (ASTM D 1321–65).[Citation14] The measure of hardness was taken as the distance into which the cone penetrates the sample over a 5-s period. The displacement of the cone was read on the Vernier scale on the “Precision Penetrometer” in 1/10 mm. In the case of the TA.XT+ Texture Analyzer, the displacement of the cone was calculated by the Texture exponent 32 software.
Analysis of Force Displacement Curves
Three methods of analysis were considered. Method 1 involved fitting a straight line to the linear region of the force displacement curve and taking the slope as an indicator of hardness as done by others.[Citation7,Citation15,Citation21] The FAMD as a measure of hardness[Citation7,Citation16,Citation18] was used in Method 2. The MF[Citation7,Citation15,Citation17–19] in the force displacement curve was used in Method 3.
Experimental Design
Fractional Factorials design in its so-called Latin square design version (an incomplete (nested) design where interaction effects are negligible)[Citation25] was used for the optimization of the parameters (depth, speed of penetration, type of probe). The runs were not randomized. Three stainless steel geometries (provided by Texture Technologies Corp.) were investigated. The geometries were: a cone with an angle of 45° (cone) (TA 15), a truncated cone with angle of 8° with tip diameter of 0.14 to 0.16 mm (needle) (ASTM D 1321-65) (14), and a ball with diameter 3.175 mm (ball) (TA 8A). Penetration depths of 1.0, 1.5, 2.0, 2.5, 3.0, and 3.5 mm and penetration speeds of 0.5 mm/s and 2.0 mm/s were studied.
The t-test, the most commonly used method to evaluate the differences in means between two groups was used in this study. The statistical significance was described by the standard, two-tailed t-test probability (p-level). Recall that p-value represents the probability of error involved in accepting the existence of a difference and is a decreasing index of the reliability of a result.[Citation26]
RESULTS AND DISCUSSION
The experimental design is justified because the type of probe did not interact with the speed for the penetration depth range to an extent that would be of practical relevance.
Best Analysis Method of Force Displacement Curves
shows typical and representative traces obtained for the binary LLS/LSL mixtures obtained using the TA.XT+ Texture Analyzer fitted with a needle probe with a penetration depth of 1.5 mm and probe speed of 0.5 mm/s. Force-displacement curves are obviously complex and fitting a straight line to any of them would not be logical as the data is neither smooth nor linear, but disrupted by multiple apparent yield points. Thus using the slope of a straight line fitted to these curves would be an erroneous measurement of hardness.
Figure 2 Typical force displacement curves for binary mixtures of the pure TAG LLS mixed with LSL (% w/w).
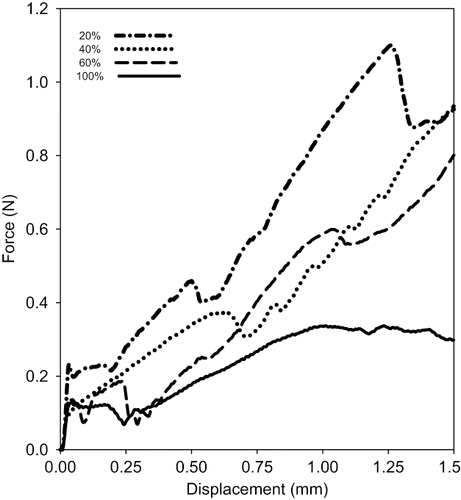
Using FAMD as a measurement of hardness appears to be acceptable. However, one can clearly see the decrease in force in the force-displacement curves of the 20 and 100% LLS samples. If one were to take the FAMD as a measure of hardness, one would be disregarding the force required to penetrate the sample to 1.5 mm. The decrease in force as the displacement increases may be due to sample cracking, which, was found to be inconsistent even within a sample.
For the 20 and 100% LLS samples it was quite clear that FAMD is not equivalent to MF. The MF analysis method was found to produce consistent values for the relative hardness of a sample. As the MF method is not affected by multiple yield points, or the creation of fissures in the sample, the MF of a force displacement curve of a sample was taken as the measure of the relative hardness of the sample.
Optimizing Hardness Measurements Using the TA Texture Analyzer
Penetration depth
To determine the effect of depth of indentation, each sample was tested at a constant speed (0.5 mm/s) and geometry (needle). The force displacement curves obtained for the six different penetration depths were very similar, and in fact, were difficult to discern. shows typical force displacement curves for the 0.50FHCO sample. One can see the smooth increase of the force with the increase of penetration depth. The behavior shown in is representative of the results obtained for the other samples tested. and compare the relative hardness of each of the samples within and between the penetration depths tested, respectively. The 75% FHCO sample is consistently 4.1 (± 0.5) to 6.8 (± 0.8) times harder (a window of 2.7 times the hardness) than the 50% FHCO sample while the 100% FHCO sample is 21 (± 2) to 38 (± 4) times harder (a window of 17 times the hardness) than the 50% FHCO sample.
Figure 3 Typical force displacement curves for the 50% fully hydrogenated canola in canola oil sample penetrated to depths of 1.0, 2.0, 2.5, 3.0, 3.5, 4.0, and 5.0 mm.
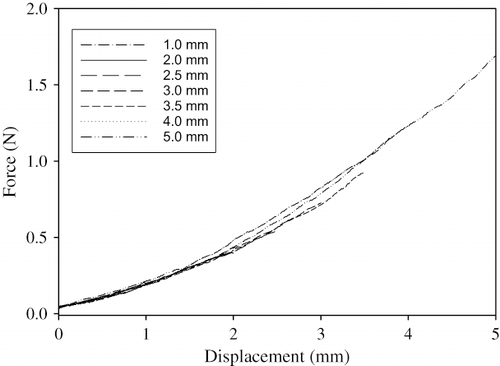
Table 2 Relative hardness for each sample compared (a) within depths and (b) between depths
Comparing between depths, one can see that penetrating 2.5 mm in the 75% FHCO sample, for example, gives a relative hardness value 3.3 ± 0.2 times greater than that for the same sample penetrated to 1.0 mm. Increasing the depth of penetration causes significant increases (P < 0.001) in the absolute hardness measurement obtained for the 75 and 100% FHCO hard fat samples. The average increase in relative hardness at each of the penetration depths versus the 1.0 mm penetration increases (from 1.0 ± 0.0 at 1 mm to 5.4 ± 0.7 at 3.5 mm) as the penetration depth increases. Therefore, while the depth of penetration does affect the absolute hardness of the samples measured, especially for the samples containing higher levels of hard fat, the samples tested with the same experimental procedure are shown to have the same relative hardness regardless of the penetration depth used.
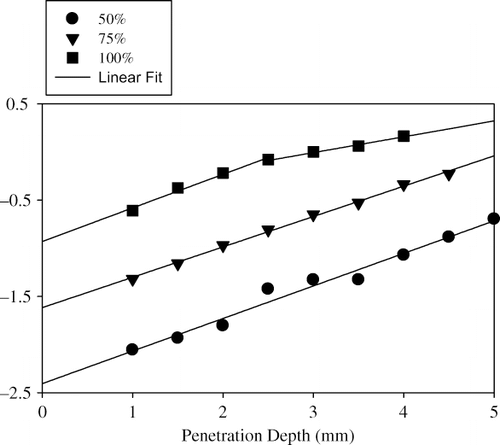
shows the MF for the FHCO/RCO samples penetrated with a needle at 0.5 mm/s. As expected, MF increased with the penetration depth. The relative hardness as determined by log(MF) was very well fitted by straight lines (R 2 > 0.9843). The lines are significantly parallel for all the samples for penetration depth lower than 3 mm and are significantly parallel for the 75% FHCO and 50% FHCO for the whole tested range. One can however note the relative hardness of the 100% FHCO sample was consistently the highest. The relative hardness between samples is not affected by the penetration depth even for larger than 3-mm penetration depth. This however, sets the limits at which the geometry (here the needle) can be used for direct quantitative comparative measurements.
Figure 4 Relative hardness within each sample (50, 75, and 100% fully hydrogenated canola in canola oil) at different penetration depths using the needle probe.
Given that the relative hardness is independent of the penetration depth (assuming a constant penetration depth for all samples being compared, as discussed in the previous paragraph) a penetration depth of 1.5 mm was chosen as it allows for the use of small sample pans (diameter 7.4 ± 0.01 mm and height 3.1 ± 0.01 mm), requiring minimal sample (an important factor when working with valuable and limited samples), and which can then be carefully tempered by cooling the pans within a cooling chamber such as a Linkam LTS 350 (Linkam Scientific Instruments, Tadworth, Surrey, United Kingdom).
Penetration speed
There was no optimum speed of penetration in the measurement of relative hardness as illustrated in showing the force-displacement curves of the 50% FHCO sample recorded at six different speeds of penetration. and c show representative curves of the relative hardness of the 50% FHCO , 75% FHCO and 100% FHCO samples recorded at 0.5 mm/s and 2.0 mm/s with a needle probe. shows typical force displacement curves for the 25% FHCO , 50% FHCO and margarine samples at the same penetration speeds tested with a ball probe. It can be seen from that the relative hardness for each sample compared within speeds is quite similar. The relative hardness when compared between speeds () is significantly different (P > 0.1) for all samples with the exception of the 50% FHCO sample tested with the ball geometry for which the hardness measured at 2 mm/s was not found to be significantly different from that at 0.5 mm/s. However, there are other factors to be considered as the speed of penetration has other effects on the sample and the instrument.
Figure 6 Force displacement curves for the 25 and 50% fully hydrogenated canola in canola oil and margarine samples using the ball probe with representative curves shown. a) 0.5 mm/s; and b) 1.5 mm/s.

Figure 5 Representative force-displacement curves using the needle probe recorded for the fully hydrogenated canola in canola oil samples. (a) 50%FHCO at six different speeds of penetration; (b) 50, 75, and 100%FHCO samples recorded with 0.5 mm/s; and (c) 50, 75, and 100%FHCO samples recorded with 2.0 mm/s.
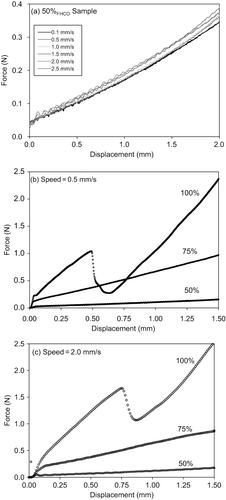
Table 3 Relative hardness for each sample compared (a) within speeds and (b) between speeds
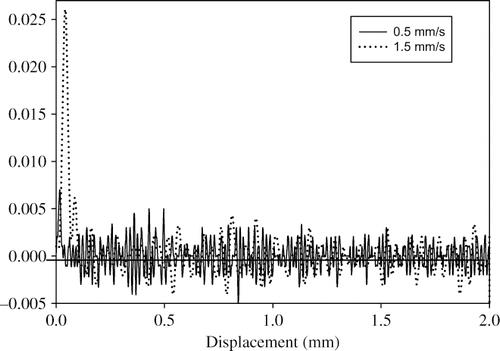
It is also interesting to compare the signal response of the TA.XT+ Texture Analyzer at the higher penetration speed. A test was run with a needle pushing through the air at different speeds. Representative force-displacement curves obtained with 0.5 and 2.0 mm/s for the “penetration” through air is shown in . Clearly there is a steep increase in the initial force measured by the TA.XT+ Texture Analyzer when the penetration speed is 1.5 mm/s. This initial peak of the curve is due to the response of the machine at the high speed and probably resulted from the acceleration of the probe from 0 to 1.5 mm/s. Note that this force was at the level of the noise when the penetration speed was less than 1.5 mm/s and therefore not recorded. Also, whilst obtaining relative hardness measurements, it was observed that brittle samples tend to fracture more often during penetration when a high penetration speed is used. This cracking, combined with the advantage of more data points obtained at slower penetration speeds, and the need to minimize disturbances caused by the equipment used, leads one to propose that a slow speed, 0.5 mm/s, is adequate for measuring hardness in a wide variety of fat samples.
Figure 7 Typical force displacement curves obtained at 2 speeds with the measurement proceeding through air.
Probe geometry
Using a penetration depth of 1.5 mm and speed of 0.5 mm/s, the effect of geometry type on the force displacement curve was investigated. Typical results are shown in , for the margarine sample. The ball probe gave the “highest” force response and the curve displays a “convex” like shape which reaches a plateau. Both the 45° and 8° (needle) cones had a lower force response and the curves were concave with the larger angle cone having a larger force response than the needle. So clearly, this is proportionally dependent on the contact area of the probe with the surface of the sample.
Figure 8 Using a penetration depth of 1.5 mm and speed of 0.5 mm/s, the effect of geometry type on the force displacement curve was elucidated using a margarine sample with representative curves shown.
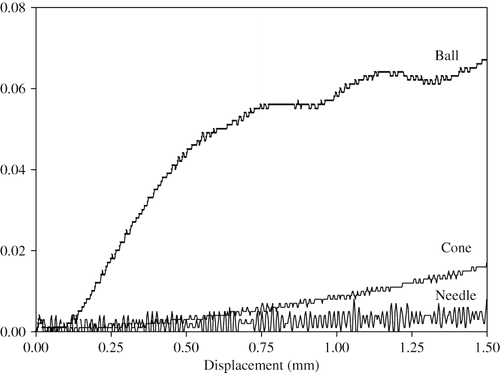
The cone probe tended to cause cracking within the sample, even for softer samples. This could be due to a more drastic increase in cross sectional area of the geometry as the penetration occurred. Therefore, the use of the cone geometry was not further investigated. It was found, for the 50% fully hydrogenated canola sample penetrated to 1.5 mm at 0.5 mm/s, that the ball geometry (0.16 ± 0.015 N) produced 10x the response than the needle geometry (1.5 ± 0.15 N). This would prove advantageous for softer fats, but would be unsuitable for harder fats as the higher force response would cause a machine to overload. Thus, it was concluded that the needle was suitable for hard fats and the ball for softer fats. This agrees with the data shown in where the needle was not sensitive enough to determine significant changes in hardness of the softest sample tested (50%FHCO sample) with increasing depth. It is important to note that in order to compare the relative hardness of two or more samples; one must ensure that the same apparatus and testing procedures, particularly the same probe geometry, are utilized. Thus the nature of the sample set will determine the necessary probe geometry. Therefore, to obtain optimal force displacement curves, a penetration speed of 0.5 mm/s and either a needle (harder fats) or ball (soft fats) geometry is required. The depth of penetration has no effect on the relative hardness measured but should be kept constant for a set of measurements within which one may wish to compare.
Cone Penetrometry Measurements
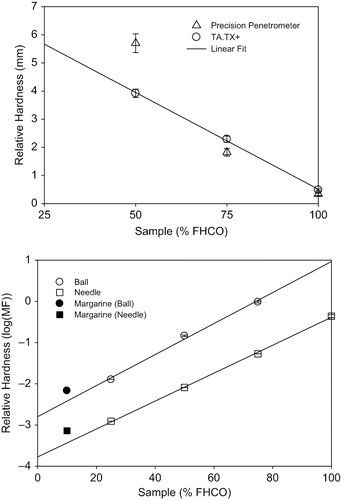
shows the relative hardness (average distance into which the cone penetrates the sample over a 5 second time period) of the samples by cone penetrometry. There was no cone penetrometry reading possible for the margarine and 25%FHCO samples as they were too soft to measure using this method. Hardness from TA.TX+ readings was very well fitted with a straight line (R 2 = 0.9998). For the 75% FHCO and 100% FHCO samples, the TA.XT+ Texture Analyzer gave significantly (P < 0.01 in all instances) softer values than the Precision Penetrometer. The Precision Penetrometer found the 50% FHCO sample to be softer than that found by the TA.XT+ Texture Analyzer.
Figure 9 Average relative hardness values as determined: a) by cone penetrometry using the Precision Penetrometer and the TA.XT+ Texture Analyzer; and b) by force displacement curves obtained with a depth of 1.5mm, speed of 0.5 mm/s and with each a ball and needle geometry.
Using MF as an indicator of relative hardness, the force displacement curves for the FHCO/RCO and margarine samples (representative curves of which are shown in and ) were analyzed. It has been found that the force response was significantly (P > 0.001 in all instances) higher for the measurements taken with the ball probe than with the needle probe as noted previously. However, for softer samples, margarine and 25%FHCO; the ball probe was more sensitive than the needle geometry. For example, the difference in average MF of the margarine and 25% FHCO sample is 0.059 ± 0.006 N for the ball and 0.002 ± 0.001 N for the needle, a difference in sensitivity of an order of magnitude. For the harder samples, as in the case of the 100% fully hydrogenated canola sample, the MF exceeded the limit permitted by the 1.0 kg load cell.
shows the average relative hardness values indicated by log (MF) for both the needle and ball probes. The linear fits of the experimental data (R 2 = 0.9998) were significantly parallel. The needle and ball geometries are both suitable for measuring the relative hardness of a fat sample, with the needle being best suited for harder fats, and the ball for softer samples. Therefore, in the range of hardness investigated here, the comparison of the measurements of hardness made by a needle can be safely compared to those made using a ball. The close correlation between cone penetrometry and the MF of the force displacement curves suggest the suitability of the latter for measurement of the relative hardness of lipid networks. Interestingly the phenomena of piling up (soft) and sinking in (hard) was observed in the fat samples tested, analogous to that seen previously for metals.[Citation23,Citation27]
CONCLUSION
This study proposes clear and defensible guidelines for the measurement of relative hardness based on the optimization of testing parameters (penetration speed, penetration depth and probe geometry) of an automated analyzer. Using this method, reliable values for hardness can be obtained by different researchers and safely compared and contrasted to the benefit of the field. While force at maximum displacement (FAMD) and maximum force (MF) would appear to provide similar values for the relative hardness, it was found that they are, in fact, quite distinct and there are advantages to using the latter. The depth of penetration has no effect on the measured relative hardness but should be kept constant for a given set of measurements. The needle was found to be more suitable for hard fats and the ball for softer fats highlighting the necessity to choosing the probe geometry according to the hardness range where it would fit. The appropriate parameters for testing the hardness of the fat samples investigated here are a penetration speed of 0.5 mm/s, a penetration distance of 1.5 mm and either a ball (soft fats) or needle (harder fats) geometry. The method was proven for use on any commercial margarine, blends of hard fat in oil or pure TAG lipid networks tested on similar compressive mechanized materials analyzers. The MF obtained from these optimum force-displacement curves can be safely used as an effective, repeatable, and non-biased measure of relative hardness. A set of samples with controlled hardness such as mixtures used in this study would be useful standards to which the measured hardness could be compared. Note that the same testing procedures and apparatus must be used in order to use the relative hardness of such standards with different samples.
ACKNOWLEDGMENTS
We would like to thank Bunge Oils, Alberta Agricultural Research Institute, Alberta Canola Producers Commission, Alberta Crop Industry Development Fund, Alberta Agriculture Food and Rural Development, and NSERC, for financial support for the research. Furthermore, we would like to thank Marsha Khelawan and Maria Irizar, who assisted with select hardness measurements and sample preparation.
Related Research Data
REFERENCES
- Narine , S.S. and Marangoni , A.G. 2001 . Elastic modulus as an indicator of macroscopic hardness of fat crystal networks . Lebensmittel-Wissenschaft Und-Technologie-Food Science and Technology , 34 ( 1 ) : 33 – 40 .
- Narine , S.S. and Marangoni , A.G. 1999 . Microscopic and rheological studies of fat crystal networks . Journal of Crystal Growth , 199 : 1315 – 1319 .
- Sengul , M. , Ertugay , M.F. , Sengul , M. and Yuksel , Y. 2007 . Rheological properties of carob pekmez . International Journal of Food Properties , 10 ( 1 ) : 39 – 46 .
- Ahmed , J. , Ayad , A. , Ramaswamy , H.S. , Alli , I. and Shao , Y. 2007 . Dynamic viscoelastic behavior of high pressure treated soybean protein isolate dispersions . International Journal of Food Properties , 10 ( 2 ) : 397 – 411 .
- Narine , S.S. and Marangoni , A.G. 1999 . Fractal nature of fat crystal networks . Physical Review E. , 59 ( 2 ) : 1908 – 1920 .
- Narine , S.S. and Humphrey , K.L. 2004 . A comparison of lipid shortening functionality as a function of molecular ensemble and shear: microstructure, polymorphism, solid fat content and texture . Food Research International , 37 ( 1 ) : 28 – 38 .
- Braipson-Danthine , S. and Deroanne , C. 2004 . Influence of SFC, microstructure and polymorphism on texture (hardness) of binary blends of fats involved in the preparation of industrial shortenings . Food Research International , 37 ( 10 ) : 941 – 948 .
- Hayakawa , M. and Deman , J.M. 1982 . Interpretation of cone penetrometer consistency measurements of fats . Journal of Texture Studies , 13 ( 2 ) : 201 – 210 .
- Haighton , A. 1965 . Worksoftening of Margarine and Shortening . J. Am. Oil Chem. Soc. , 42 : 27 – 30 .
- Dixon , B.D. and Parekh , J.V. 1980 . Use of the Cone Penetrometer for Testing the Firmness of Butter . Journal of Texture Studies , 10 ( 4 ) : 421 – 434 .
- Haighton , A. 1959 . The Measurement of the Hardness of Margarine and Fats with Cone Penetrometers . J. Am. Oil Chem. Soc. , 36 : 345 – 348 .
- Rebinder , P.A. and Semenenko , N.A. 1949 . Use of the penetrating-cone method for the characterization of structure-mechanical properties of viscoplastic bodies . Doklady Akademii Nauk SSSR , 64 : 835 – 838 .
- American Oil Chemists' Society . 1989 . “ American Oil Chemists' Society Official Method ” . In Consistency , 2 Champain , IL : AOAC .
- American Society of Testing and Materials . 1965 . “ Standard Method of Test for Needle Penetration of Petroleum Waxes ” . In ASTM Standard Methods , 302 – 305 . Philadelphia , PA : ASTM .
- de Man , L. , Postmus , E. and de Man , J. 1990 . Textural and Physical Properties of North American Stick Margarines . J. Am. Oil Chem. Soc. , 67 ( 5 ) : 323 – 328 .
- Omar , Z. , Let , C.C. , Seng , C.C. and Rashid , N.A. 2005 . Crystallisation and rheological properties of hydrogenated palm oil and palm oil blends in relation to crystal networking . European Journal of Lipid Science and Technology , 107 ( 9 ) : 634 – 640 .
- Shi , Y. , Liang , B. and Hartel , R. 2005 . Crystal morphology, microstructure, and textural properties of model lipid systems . Journal of the American Oil Chemists' Society , 82 ( 6 ) : 399 – 408 .
- Danthine , S. and Deroanne , C. 2003 . Physical and textural characteristics of hydrogenated low-erucic acid rapeseed oil and low-erucic acid rapeseed oil blends . Journal of the American Oil Chemists' Society , 80 ( 2 ) : 109 – 114 .
- Kruisheer , C.I. , den Herder , P.C. , Krol , B.M. and Mulders , E.M.J. 1938 . The consistency of butter . Chemisch Weekblad , 35 : 719 – 733 .
- Tanaka , M. , Man , J.M. and Voisey , P.W. 1971 . Measurement of textural properties of foods with constant speed cone penetrometer . Journal of Texture Studies , 2 ( 3 ) : 306 – 315 .
- Tabil , L.G. , Sokhansanj , S. , Crerar , W.J. , Patil , R.T. , Khoshtaghaza , M.H. and Opoku , A. 2002 . Physical Characterization of alfalfa cubes: 1. Hardness . Canadian Biosystems Engineering , 44 ( 3 ) : 55 – 63 .
- Jansen , K.M.B. , Gonda , V. , Ernst , L.J. , Bressers , H.J.L. and Zhang , G.Q. 2005 . State-of-the-art of thermo-mechanical characterization of thin polymer films . Journal of Electronic Packaging , 127 ( 4 ) : 530 – 536 .
- Fischer-Cripps , A.C. 2006 . Critical review of analysis and interpretation of nanoindentation test data . Surface and Coatings Technology , 200 ( 14–15 ) : 4153 – 4165 .
- Wright , A.J. , Scanlon , M.G. , Hartel , R.W. and Marangoni , A.G. 2001 . Rheological properties of milkfat and butter . Journal of Food Science , 66 ( 8 ) : 1056 – 1071 .
- Keppel , G. 2007 . Design and analysis: A researcher's handbook , 624 Engelwood Cliffs , NJ : Prentice Hall .
- Brownlee , K.A. 1965 . Statistical Theory and Methodology in Science and Engineering , 570 New York : Wiley Publications .
- Cheng , Y.T. and Cheng , C.M. 2004 . Scaling, dimensional analysis, and indentation measurements . Materials Science & Engineering R-Reports , 44 ( 4–5 ) : 91 – 149 .